
Journal of Geographical Sciences >
Optimizing field management to promote the ecologicalization of agriculture in loess hilly-gully region, China
|
Huang Yunxin (1993‒), E-mail: huangyx.20b@igsnrr.ac.cn |
Received date: 2022-07-27
Accepted date: 2022-11-24
Online published: 2023-05-11
Supported by
National Natural Science Foundation of China(41931293)
The National Key Research and Development Program of China(2017YFC0504701)
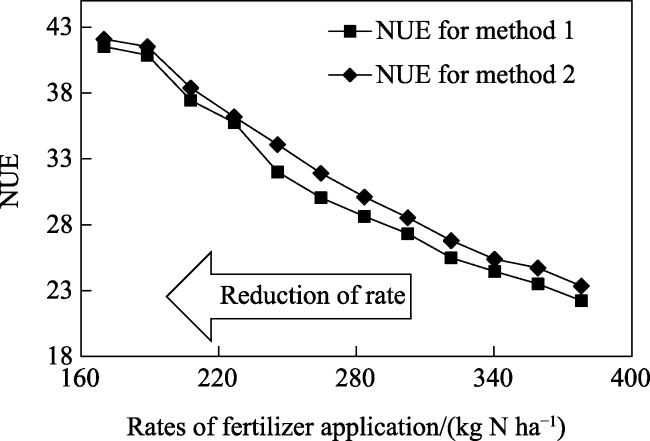
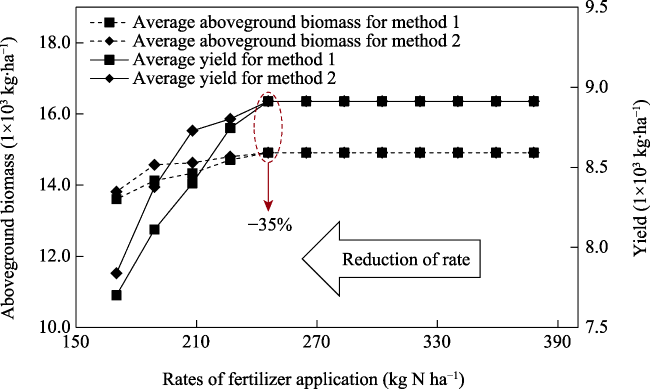
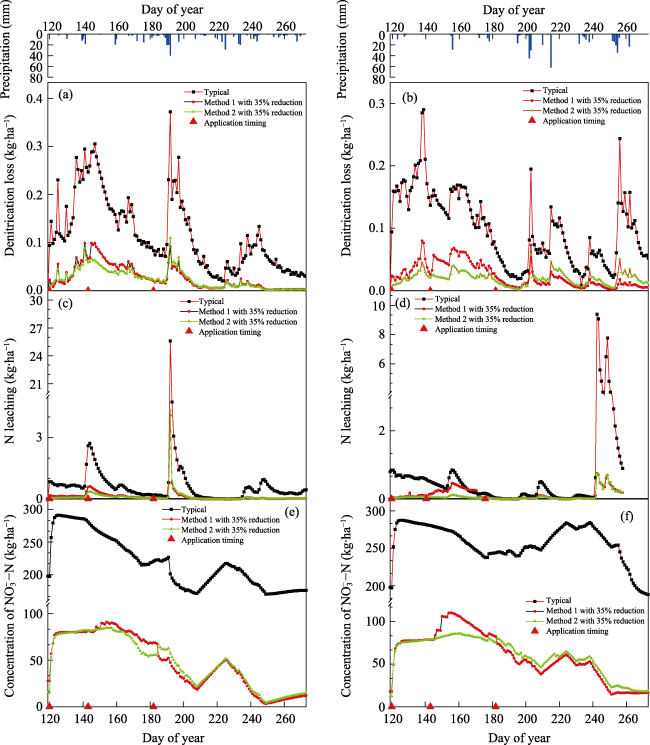
Scientific field management is an important path to realize ecological production and sustainable development of agriculture. As the main content of field management, nitrogen (N) management is the key to balance the economic and ecological benefits of agricultural production. In the loess hilly-gully region, for the fragile ecological and social system, ecologicalization of agricultural production is an important direction to promote sustainable agricultural development. However, irrational fertilization has been one of the main constraint factors, hindering the ecologicalization of local agriculture. In order to solve the problem and prove the practical significance of field management to ecologicalization of agriculture, this study aimed at evaluating the effects of different N fertilization rates and timing using Root Zone Water Quality Model (RZWQM) and then optimizing the N management. Experiments were conducted from 2018 to 2019 in Yangjuangou watershed, loess hilly-gully region, to calibrate and validate the model. The root mean square error (RMSE) of soil water content, nitrate N concentration, above-ground biomass, leaf area index ranged from 10.5-13.5 mm, 2.96-3.80 mg·kg–1, 730.3-1273.9 kg·ha–1 and 0.26-0.38, respectively, with the agreement index (d) between observed and simulated values ranging between 0.88 to 0.98. Simulation results showed that N leaching in semi-arid areas was also quite high due to concentrated rainfall and loose soil, which had previously been neglected. When the fertilization rate decreased by 35% (applying the chemical fertilizer at rate of 245.7 kg N ha–1) of typical fertilization (applying the chemical fertilizer at rate of 378.0 kg N ha–1), the leaching and residual N decreased by 72.2%-75.4% and 35.6%-50.9%, respectively, while NUE increased by 41.5%-45.2% with no reduction in maize yield. Additionally, compared with applying additional N at seedling stage in one batch, applying at seedling and jointing stages in two batches further decreased N leaching and improved NUE. Thus, a 35% reduction of typical fertilization rate combined with applying additional N at seedling and jointing stages is recommended. From the perspective of N management, this study demonstrated optimizing field management can play a positive role in the ecologicalization of agriculture, and more field management measures should be explored.
HUANG Yunxin , LI Yurui , LIU Yansui . Optimizing field management to promote the ecologicalization of agriculture in loess hilly-gully region, China[J]. Journal of Geographical Sciences, 2023 , 33(5) : 1055 -1074 . DOI: 10.1007/s11442-023-2119-5
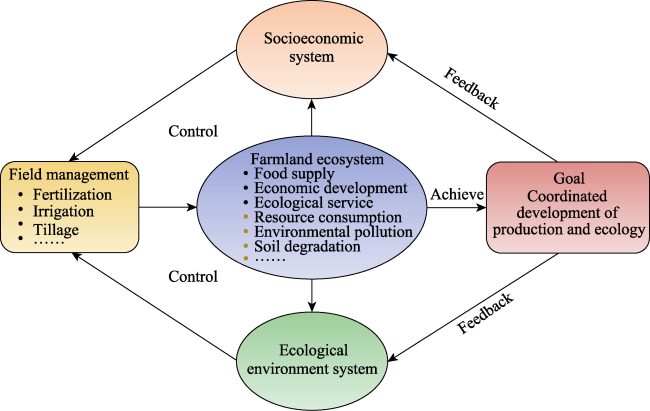
Figure 1 Practical framework for achieving ecological agricultural goal through field management |
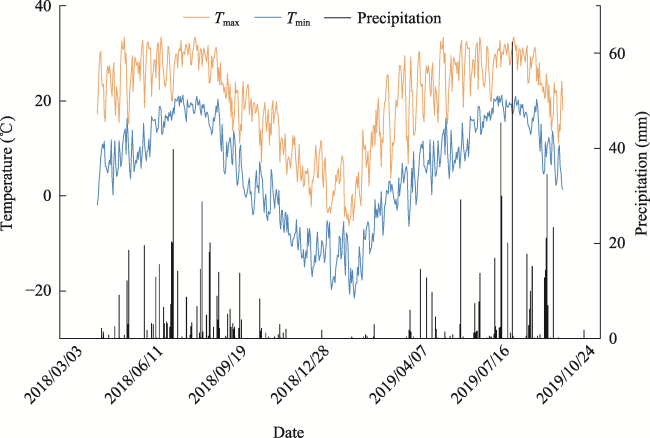
Figure 2 Daily precipitation and temperature during the study period of the experimental site |
Table 1 Different fertilization treatments over two years for calibration and validation |
| Treatments | Fertilization management | |
|---|---|---|
| 2018 | 2019 | |
| R0 | 2018‒05‒02: 60 kg N ha‒1, 17.65 kg P ha‒1, 88.24 kg K ha‒1 2018‒06‒05: Urea, 179.68 kg N ha‒1 2018‒07‒02: Urea, 143.75 kg N ha‒1 | 2019‒04‒17: 60 kg N ha‒1, 17.65 kg P ha‒1, 88.24 kg K ha‒1 2019‒07‒09: Urea, 143.75 kg N ha‒1 2019‒08‒01: Urea, 143.75 kg N ha‒1 |
| R10 | 2018‒05‒02:54 kg N ha‒1, 15.89 kg P ha‒1, 79.42 kg K ha‒1 2018‒06‒05: Urea, 161.71 kg N ha‒1 2018‒07‒02: Urea, 129.38 kg N ha‒1 | 2019‒05‒02:54 kg N ha‒1, 15.89 kg P ha‒1, 79.42 kg K ha‒1 2019‒06‒05: Urea, 129.38 kg N ha‒1 2019‒07‒02: Urea, 129.38 kg N ha‒1 |
| R20 | 2018‒05‒02: 48 kg N ha‒1, 14.12 kg P ha‒1, 70.59 kg K ha‒1 2018‒06‒05: Urea, 143.74 kg N ha‒1 2018‒07‒02: Urea, 115 kg N ha‒1 | 2019‒04‒17: 60 kg N ha‒1, 17.65 kg P ha‒1, 88.24 kg K ha‒1 2019‒07‒09: Urea, 115 kg N ha‒1 2019‒08‒01: Urea, 115 kg N ha‒1 |
Table 2 Soil hydraulic characteristic and other soil parameters for calibration |
| Soil depth (cm) | Mechanical composition (%) | Bulk density (g·cm‒3) | Porosity | Saturated hydraulic conductivity (cm·h‒1) | Field capacity at 33 kPa (cm3·cm‒3) | Soil organic matter (g·kg‒1) | ||
|---|---|---|---|---|---|---|---|---|
| Clay | Silt | Sand | ||||||
| 0-10 | 5.1 | 70.8 | 24.1 | 1.47 | 0.445 | 1.10 | 0.23 | 4.30 |
| 10-20 | 5.0 | 70.7 | 24.3 | 1.50 | 0.434 | 0.15 | 0.26 | 3.05 |
| 20-30 | 5.0 | 70.9 | 24.1 | 1.53 | 0.423 | 0.16 | 0.27 | 2.18 |
| 30-40 | 6.0 | 71.0 | 23.0 | 1.58 | 0.404 | 0.10 | 0.28 | 1.17 |
| 40-60 | 6.0 | 70.0 | 24.0 | 1.60 | 0.396 | 0.10 | 0.29 | 3.09 |
| 60-80 | 6.0 | 70.0 | 24.0 | 1.62 | 0.389 | 0.10 | 0.26 | 1.70 |
Table 3 Calibration parameters for nutrition module |
| Parameter | Description | Value range | Calibration values |
|---|---|---|---|
| Kdent | Death rate of aerobic heterotrophs | 1×10‒36-1×10‒33 | 7.5×10‒35 |
| Kdden | Death rate of autotrophs | 1×10‒34-1×10‒31 | 8×10‒32 |
| ANIT | Reaction rates of nitrification | 1×10‒10-1×10‒8 | 8×10‒8 |
| ADEN | Reaction rates of denitrification | 1×10‒14-1×10‒12 | 2×10‒13 |
| AHYD | Reaction rates of urea hydrolysis | 1×10‒6-1×10‒3 | 6.5×10‒6 |
Table 4 Descriptions of typical fertilization, different fertilization rates and timing |
| Scenarios | Descriptions |
|---|---|
| Typical fertilization | Base fertilizer (May 1): 102 kg N ha−1, 30 kg P ha−1, 150 kg K ha−1 at sowing stage Additional fertilizer (May 25): 276 kg N ha‒1 at the seedling stage |
| Reduction groups | Base fertilizer /additional fertilizer: reduced by a gradient of 5% on the basis of typical usage, until it was reduced by 55%. |
| Timing | Method 1: Base fertilizer (May 1): sowing stage Additional fertilizer (May 25): seedling stage (100% of additional N) |
| Method 2: Base fertilizer (May 1): sowing stage First Additional N (May 25): seedling stage (50% of additional N) Second Additional N (July 2): jointing stage (50% of additional N) |
Table 5 Statistics for comparing simulated values to observed values for calibration and validation |
| Items | Treatments | Calibration | Validation | ||||
|---|---|---|---|---|---|---|---|
| RMSE | d | MRE | RMSE | d | MRE | ||
| Soil water content (mm) | R0 | 10.50 | 0.85 | 5.4% | 13.5 | 0.88 | 9.1% |
| R10 | 11.72 | 0.86 | 6.2% | 14.06 | 0.82 | 6.6% | |
| R20 | 12.55 | 0.81 | 6.7% | 13.45 | 0.80 | 6.3% | |
| Nitrate N concentration (mg·kg‒1) | R0 | 2.38 | 0.83 | 14.4% | 3.80 | 0.76 | 15.9% |
| R10 | 3.55 | 0.73 | 20.8% | 3.42 | 0.80 | 16.0% | |
| R20 | 3.71 | 0.72 | 21.6% | 3.39 | 0.79 | 16.4% | |
| Above-ground biomass (kg·ha‒1) | R0 | 1273.9 | 0.98 | 8.0% | 730.3 | 0.98 | 27.8% |
| R10 | 952.82 | 0.96 | 9.4% | 987.84 | 0.96 | 35.3% | |
| R20 | 835.21 | 0.96 | 9.5% | 1126.30 | 0.95 | 33.3% | |
| Leaf area index | R0 | 0.26 | 0.98 | 16% | 0.38 | 0.94 | 21.2% |
| R10 | 0.31 | 0.96 | 27.6% | 0.47 | 0.92 | 27.0% | |
| R20 | 0.40 | 0.93 | 29.6% | 0.40 | 0.94 | 23.5% | |
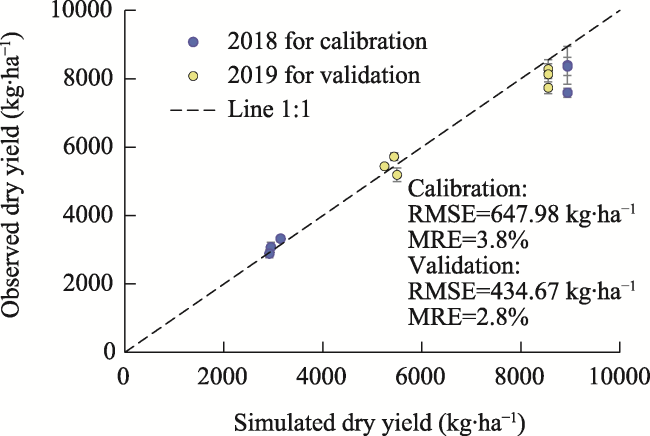
Figure 3 Comparison of observed and simulated values of maize yield for 2018 and 2019. Error bars are standard errors. |
Table 6 Average values of soil N during maize growing period under different N fertilization scenarios over two years |
| Application times | Rates of N application (kg·ha‒1) | Mineralization (kg·ha‒1) | Denitrification (kg·ha‒1) | Volatilization (kg·ha‒1) | leaching (kg·ha‒1) | Uptake by crop (kg·ha‒1) | Residual (kg·ha‒1) |
|---|---|---|---|---|---|---|---|
| In one batch | 378.0 | 44.58 | 16.03 | 10.99 | 139.24 | 229.86 | 29.35 |
| 359.1 (-5%) | 44.58 | 13.95 | 9.49 | 118.72 | 229.86 | 30.69 | |
| 340.2 (-10%) | 44.58 | 13.82 | 8.79 | 109.27 | 229.86 | 26.41 | |
| 321.3 (-15%) | 44.58 | 13.12 | 8.30 | 95.15 | 229.86 | 21.99 | |
| 302.4 (-20%) | 44.58 | 10.09 | 7.65 | 73.37 | 229.86 | 26.36 | |
| 283.5 (-25%) | 44.58 | 8.22 | 7.14 | 59.34 | 229.86 | 22.04 | |
| 264.6 (-30%) | 44.58 | 6.87 | 6.58 | 50.15 | 229.86 | 17.46 | |
| 245.7 (-35%) | 44.64 | 4.81 | 6.01 | 36.52 | 226.47 | 14.57 | |
| 226.8 (-40%) | 45.39 | 2.58 | 5.49 | 23.16 | 210.80 | 31.89 | |
| 207.9 (-45%) | 46.31 | 1.66 | 4.99 | 18.70 | 198.41 | 33.89 | |
| 189.0 (-50%) | 45.08 | 1.49 | 4.52 | 16.63 | 175.78 | 39.30 | |
| 170.1 (-55%) | 47.87 | 0.83 | 4.02 | 14.32 | 166.23 | 35.88 | |
| In two batches | 378.0 | 44.58 | 17.45 | 6.92 | 127.20 | 229.86 | 44.48 |
| 359.1 (-5%) | 44.58 | 14.76 | 6.41 | 109.44 | 229.86 | 46.16 | |
| 340.2 (-10%) | 44.58 | 13.79 | 5.93 | 101.37 | 229.86 | 36.84 | |
| 321.3 (-15%) | 44.58 | 12.04 | 5.47 | 84.99 | 229.86 | 36.24 | |
| 302.4 (-20%) | 44.58 | 9.71 | 5.04 | 67.66 | 229.86 | 37.46 | |
| 283.5 (-25%) | 44.58 | 7.24 | 4.63 | 54.12 | 229.86 | 34.74 | |
| 264.6 (-30%) | 44.58 | 5.11 | 4.23 | 39.92 | 229.86 | 32.44 | |
| 245.7 (-35%) | 44.72 | 3.09 | 4.27 | 26.88 | 227.13 | 31.84 | |
| 226.8 (-40%) | 45.21 | 2.26 | 3.44 | 19.39 | 224.12 | 30.98 | |
| 207.9 (-45%) | 45.88 | 1.63 | 3.09 | 16.89 | 203.08 | 31.12 | |
| 189.0 (-50%) | 46.70 | 1.14 | 2.24 | 13.48 | 182.45 | 37.76 | |
| 170.1 (-55%) | 48.04 | 0.78 | 2.42 | 11.32 | 171.68 | 33.66 |
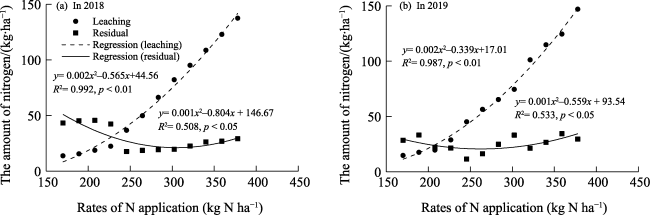
Figure 4 Simulation results of N leaching and residue in soil of different N application rates for 2018 (a) and 2019 (b). The solid line is the quadratic regression of N leaching, and the dotted line is the quadratic regression of the N residue. |
Figure 5 Simulation results of NUE of different N application schemes. NUE is abbreviation of N use efficiency. |
Figure 6 Simulated average yield and above-ground biomass of maize under different N application rates for two application methods |
Figure 7 Simulated values of denitrification, N leaching and concentration for 2018 (a, c, e) and for 2019 (b, d, f). The red dots on the horizontal axis represent the fertilization timing of base fertilizer and additional N in turn. |
| [1] |
|
| [2] |
|
| [3] |
|
| [4] |
|
| [5] |
|
| [6] |
|
| [7] |
|
| [8] |
|
| [9] |
|
| [10] |
|
| [11] |
|
| [12] |
|
| [13] |
|
| [14] |
|
| [15] |
|
| [16] |
|
| [17] |
|
| [18] |
|
| [19] |
|
| [20] |
|
| [21] |
|
| [22] |
|
| [23] |
|
| [24] |
|
| [25] |
|
| [26] |
|
| [27] |
|
| [28] |
|
| [29] |
|
| [30] |
|
| [31] |
|
| [32] |
|
| [33] |
|
| [34] |
|
| [35] |
|
| [36] |
|
| [37] |
|
| [38] |
|
| [39] |
|
| [40] |
|
| [41] |
|
| [42] |
|
| [43] |
|
| [44] |
|
| [45] |
|
| [46] |
|
| [47] |
|
| [48] |
|
| [49] |
|
| [50] |
|
| [51] |
|
| [52] |
|
| [53] |
|
| [54] |
|
| [55] |
|
| [56] |
|
| [57] |
|
| [58] |
|
| [59] |
|
/
| 〈 |
|
〉 |