Research Articles

The innovation networks shaped by large innovative enterprises in urban China

  • MA Haitao , 1 ,
  • Yehua Dennis WEI , 2, * ,
  • HUANG Xiaodong 3 ,
  • ZHANG Weiyang 4
Expand
  • 1. Key Laboratory of Regional Sustainable Development Modeling, Institute of Geographic Sciences and Natural Resources Research, CAS, Beijing 100101, China
  • 2. Department of Geography, University of Utah, Salt Lake City 84112, USA
  • 3. Institute for Global Innovation and Development, East China Normal University, Shanghai 200062, China
  • 4. Research Center for China Administrative Division, East China Normal University, Shanghai 200062, China
*Yehua Dennis Wei (1963-), Professor, E-mail:

Ma Haitao (1979-), PhD and Associate Professor, specialized in urban geography and planning. E-mail:

Received date: 2022-03-07

  Accepted date: 2022-09-06

  Online published: 2023-03-21

Supported by

The Third Xinjiang Scientific Expedition Program(2021xjkk0905)

National Natural Science Foundation of China(41971209)

National Natural Science Foundation of China(41571151)

National Natural Science Foundation of China(41901186)

Abstract

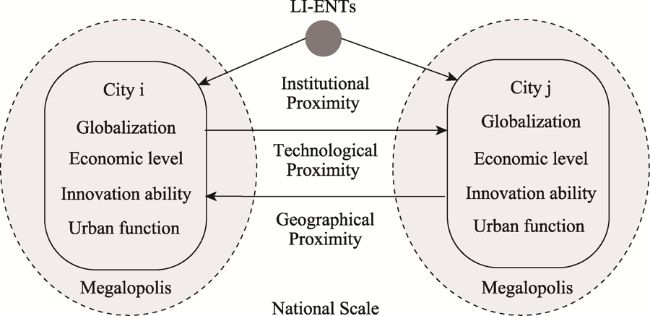
Studies investigating innovation networks shaped by large innovative enterprises (LI-ENTs), which play a very important role in intercity diffusion of technology and knowledge, are rather thin on the ground. Using location information of LI-ENTs in China, we performed a headquarter-branch analysis to generate intercity innovation linkages and analyzed the patterns and dynamics of the generated network of knowledge diffusion. Although the network covers 353 cities across China, its spatial distribution is extremely uneven, with a few cities and city-dyads dominating the structure of the network. Furthermore, intercity linkages of innovation within and of urban agglomerations, as well as their central cities, stand out. With regard to network dynamics, the economic development level, innovation ability, and administrative level of cities, as well as the geographical, institutional, and technological proximity between cities are all found to have a positive impact on intercity linkages of innovations, whilst the impact of FDI on the national distribution of Chinese innovative enterprises is negative. Most importantly, the status of cities within the urban agglomeration exerts a significant positive effect in relation to the innovative enterprises’ expansions, which reflects that the top-down forces of government and the bottom-up forces of market function together.

Cite this article

MA Haitao , Yehua Dennis WEI , HUANG Xiaodong , ZHANG Weiyang . The innovation networks shaped by large innovative enterprises in urban China[J]. Journal of Geographical Sciences, 2023 , 33(3) : 599 -617 . DOI: 10.1007/s11442-022-2065-7

1 Introduction

Large firms, especially transnational corporations (TNCs), act as both a source of innovation and an impetus for the spatial transmission of technology and knowledge at local, regional, national and global scales (Scott, 1992; Harrison, 1994; Patchell et al., 1999; Delgado-Marquez et al., 2018). Typical examples of these large firms include Apple, Google, AT&T, and Huawei, which have abundant talent and capital and dominate technological innovation globally. Two mechanisms are at work in their success: on the one hand, their institutions and branches are able to build local innovation networks and milieus that bring together local suppliers, customers, research institutions, and other enterprises, enabling the interaction of corporate knowledge with local knowledge through embeddedness (Bunnell and Coe, 2001); on the other hand, large firms optimize the product, value, and innovation chains by choosing to locate different branches in optimal locations, thus facilitating the cross-location dissemination of new knowledge, technology, and information through inter-agency linkages (Bathelt and Li, 2020). As a result, unpacking the intertwined relations between large firms and innovation has been attracting continuous attention in economic geography and innovation studies.
The proliferation of research into the relations between large firms and innovation has manifested itself in assessing the role of TNCs in global knowledge and technology diffusion and the construction of global innovation networks (Diez and Berger, 2005; Crescenzi et al., 2014). It is worth mentioning that there is also burgeoning literature on exploring the generation and spillover of innovation in relation to small and middle enterprises (SMEs) at the local scale (Piore and Sabel, 1984; Amin and Thrift, 1992). Little attention, however, has been paid to the diffusion of innovation of “large firms” - especially large innovative enterprises (LI-ENTs) - at the national scale (Malecki, 2014), which emerges as a vital process in shaping national innovation systems, as well as an essential strand of innovation dispersal. LI-ENTs not only own a large number of patent rights, but they also possess technical secrets that are only circulated within the enterprises; they not only publish annual reports, papers, etc., but also hold many written materials containing knowledge and information which can only be circulated within enterprises (innovative enterprises pay special attention to the protection of core technologies and key information). More importantly, LI-ENTs often have multiple departments undertaking different innovation links and sharing different functions, and these departments constitute a mechanism for the rapid transfer of knowledge within the enterprises. In this paper, we seek to address this research lacuna by focusing on large enterprises with a high level of innovation ability, i.e., LI-ENTs, and unpacking the intercity innovation networks shaped by LI-ENTs at national scale.
Apart from the relatively neglected lens of innovation dispersal of LI-ENTs at national scale, this paper is also rooted in the context of China, in which scientific and technological development has experienced unprecedented growth (Liefner and Hennemann, 2011; Andersson et al., 2014; Zhang and Wu, 2019; Zhang et al., 2020), with crucial driving forces from state-owned large enterprises. In terms of innovation input, China’s R&D investment as a percentage of GDP reached 2.41% in 2021, closely approaching the Organization for Economic Co-operation and Development (OECD) average of 2.68%; meanwhile, total R&D investment in the country approached $378 billion, a sum second only to that of the US. Unlike other middle-income countries where the public sector is responsible for a large share of R&D expenditure, in China spending by enterprises accounts for three quarters of the country’s total R&D spending. In terms of innovation output, China has also seen a rapid increase in patents. The National Intellectual Property Administration of the People’s Republic of China received 1.4 million patent applications in 2019, which is more than twice the amount received by the United States Patent and Trademark Office. In 2016, China filed the world’s third-highest number of applications under the Patent Cooperation Treaty (PCT); here, ZTE was the most frequent, and Huawei the second most frequent PCT filer in the world (WBG and DRC, 2019). Furthermore, as a main characteristic of party-state of China, state-owned LI-ENTs have played an important role in the diffusion of technology and knowledge (Malecki, 2014). This is especially the case when facing increasing national technological protection and international competition for innovation in the era of US-China decoupling.
Against this backdrop, this research attempts to explore the patterns and dynamics of knowledge diffusion resulting from LI-ENTs in China. To be specific, we try to answer three key questions as follows: how are China’s LI-ENTs and their subsidiaries distributed spatially in China, what kind of intercity knowledge communication network does this distribution constitute, and what factors have influenced the pattern of the network?
The remainder of this paper is organized as follows. The next section presents a literature review of innovation geography from two strands including geographies of enterprises innovation and intercity innovation relations, and provides a general discussion of generating intercity relations, which is followed by an introduction of the analytical framework. After that, we present our data and methodology. The subsequent results section is presented in two parts: a description of the geography and network of Chinese LI-ENTs, and a discussion on results of network analysis. The paper concludes with an overview of its major findings, policy implications and suggestion for avenues of future research.

2 Literature review and analytical framework

2.1 Geographies of enterprises innovation

Past research has emphasized the importance of SMEs with respect to cluster innovation (Piore and Sabel, 1984; Amin and Thrift, 1992), arguing that the inter-firm networks established by SMEs (Perry, 1999) are better adapted to supporting just-in-time production and flexible production, thereby enabling the rapid dissemination of knowledge and the generation of innovations (Black, 2003). However, research on cluster innovation at the urban scale has shown that tacit knowledge redundancy can become a barrier to cluster/city-level innovation, and that clusters/cities with stronger innovation capabilities are becoming increasingly externally oriented (Feldman, 2000). Linkages between large business sectors located in different clusters/cities are also highlighted as an important external knowledge conduit for a given cluster/city.
Compared with extensive research on innovations of SMEs, relatively little attention has been paid to the role played by large enterprises within the existing literature on the geography of innovation. This is mainly attributed to the flexibility research in the 1980s (Piore and Sabel, 1984), which criticized the weak competitiveness of the vertically integrated large enterprises in the post-industrial world. However, scholars have remained keenly aware of the unique advantages of big business in generating innovation. First, existing scholarship has shown that large enterprises can combine strategic flexibility with access to powerful economies of scale - for this reason, it has been argued, such enterprises are best placed to develop and exploit innovations (Florida and Kenney, 1990) and frequently function as mainsprings of development and growth over long periods (Scott, 1992; Patchell et al., 1999). Second, it has been noted that the subsidiaries of large firms are able to tap into finely graded technical divisions of labor in cities via the organizational mechanism of subcontracting (Harrison, 1992, 1994). This capacity facilitates the exchange and integration of local urban knowledge within large enterprises, stimulating innovation generation. Third, through their vertically integrated organizations and strong management mechanisms, multidivisional and multilocational corporations have been shown to be able to integrate and leverage the innovation resources of different cities and work together in order to promote corporate innovation (Delgado-Marquez et al., 2018).
With regards to existing research on the innovation of large enterprises, identifying the importance of TNCs in both the international diffusion of knowledge and technology and the construction of global innovation networks has been at the heart (Cordell, 1973; Diez and Berger, 2005; Crescenzi et al., 2014). Researchers have pointed out that because of the division of functions in the TNC sector, when knowledge and technology is diffused from the country of a TNC’s headquarters to the country of its subsidiaries, only knowledge related to branch production (lower-level knowledge from the perspective of the technology system) is transferred (Patel, 1996). Beyond the technology possessed by the TNCs, diffusion is also influenced by the level of technology accumulation in the countries where the subsidiaries are located, which can make it easy or difficult to absorb high-level knowledge (Fu et al., 2011; Mustapha and Mendi, 2015). On the whole, however, factors such as firms’ core technological interests, national technology protection constraints, and national collaborative innovation capabilities mean that it remains difficult for TNCs to innovate internationally across national divides and barriers (Lundvall, 1992; Fu et al., 2011).

2.2 Intercity innovation relations

As intercity innovation linkages grow, the networked nature of these relationships is becoming clear. Cities develop different functions and positions in these intercity innovation networks (Shearmur 2012; Wang et al., 2016). Liefner and Hennemann (2011) classify cities in an innovation network into four types, based on the spatial concentration of knowledge: knowledge corridor cities, knowledge gateway cities, knowledge diversion cities, and knowledge edge cities. Matthiessen’s research team has analyzed the network structure of world cities in relation to changes in the field of scientific knowledge (Matthiessen et al., 2002), classifying cities into five types based on co-authorship and citation relationships, namely: hot spots, “focus on success” cities, “volume growth but loss in reputation” cities, neutral cities, and black holes (Matthiessen et al., 2010). From these studies, it can be seen that urban access to different pools of knowledge is unevenly distributed and that network position is becoming increasingly important in the process of combining knowledge and innovation in cities.
LI-ENTs are one of the most important drivers of intercity innovation relations, not only because they instigate many forms of intercity innovation cooperation, but also because they contribute to the functional specialization of cities. When firms choose to separate management and R&D activities from the producing city, and when firms choose to separate their primary activities, i.e., management and R&D, from their secondary activities, i.e., actual production, the functional specialization of cities is strengthened (Duranton and Puga, 2005). The basic motivation for splitting an organization in this way is to maximize benefits from regionally bound location factors (Audretsch et al., 2011). This organizational pattern (both intrafirm and in the form of strategic alliances) not only strongly embeds national innovation systems, but can be conceptualized as linking across innovative city regions or agglomerations (Howells, 1999; Wei and Liao, 2013). Given these implications, understanding how large firms can facilitate knowledge flows between cities and enhance the innovation capacity of the country as a whole through cross-city sectoral organization and innovation activities is of great relevance to contemporary studies of the geography of innovation, and forms a core task addressed in this paper.

2.3 Generating intercity relations

Cities are not ‘autonomous entities’ that directly connect with each other, but rather ‘agglomerations composed of many distinct networks - economic, social, political, technical or infrastructural’ (Pflieger and Rozenblat, 2010). The preliminary but vital step of analyzing intercity networks involves determining how these networks are produced (Ma, 2020). Couched in the terminology of social network analysis literature, a city-to-city network is a one-mode network consisting of only one set of nodes, while a city-to-agent network, which is always the original specification of data collection in actual analyses (e.g., the presence of firms in cities), is a two-mode network consisting of two disjointed sets of nodes (i.e. cities and agents). It is possible to transform a two-mode network to a one-mode network by applying projection methods (Liu and Derudder, 2012). There are various methods of projection for different agents. For instance, the corporate command relations (Alderson and Beckfield, 2004) and the volume of intercity transport provisions can be transferred as indicators of intercity connections (Zhang et al., 2020). Another example is the widely-used interlocking network model (INM), devised by Taylor (2001) and widely applied by Globalization and World Cities Research Network (GaWC), in which office networks of advanced producer service firms across cities are used to estimate intercity connections (Chong and Pan, 2020).

2.4 Influence factors and analytical framework

LI-ENTs choose the cities in which they locate their headquarters, R&D centers, and production plants on the basis of both their own development needs and the urban setting. Whilst the development needs of enterprises vary widely, consistent factors can be identified within the perceived attributes of cities from the perspective of enterprises (Lee and Rodriguez-Pose, 2013). Based on relevant research, we argue that LI-ENTs tend to consider factors ranging from the level of globalization, the level of economic development, innovation ability, urban functions, to intercity relations when locating their branches in a city (Figure 1).
Figure 1 Research framework

Note: LI-ENTs means large innovative enterprises.

The degree of globalization reflects a city’s openness to the outside world and its absorption capacity, both of which are important to LI-ENTs operating on a national scale, as many companies aim for their innovations and products to be internationally recognized and globally competitive (Wei et al., 2019). As a result, establishing a branch office in a highly globalized city and co-locating with a branch office or supplier of a TNC may be beneficial for firms seeking to acquire new and different knowledge and to go international (McCann and Mudambi, 2005; Wei et al., 2010). However, no matter how FDI and innovation interplay, knowledge diffusion and innovation synergy are performed differently by different TNCs in the different cities where their branches are located (Wang et al., 2016). It is therefore well worth exploring the impact of FDI on the diffusion of knowledge and innovation at the national scale.
The level of economic development in a city reflects that city’s overall capabilities and is often the primary factor that LI-ENTs consider when selecting a city (Head and Mayer, 2004). To be specific, a city’s economic performance enables it to directly attract the setting up of branches of LI-ENTs, and greatly decide cities’ fixed infrastructure investments and market demands and thus generating an attractive business environment.
Location decisions of innovative enterprises, however, go beyond economic factors in order to take into account a city’s innovation resources, conditions, and capabilities. Urban innovative dynamism can exert a potentially ambiguous effect on the location decisions of large enterprises, depending on the extent to which subsidiaries are embedded in local systems of innovation (Cantwell and Iammarino, 2000). Of course, the choice of location for innovative firms also depends upon the spatial organization of different value chain stages. Activities at the high-value chain stage take into account to a greater extent the innovative dynamism of the local economy, which can deliver benefits in the form of localized knowledge spillovers from indigenous firms (Jakobsen and Onsager, 2005; McCann and Mudambi, 2005).
The function of the city in the country and region is also an important factor for the location decisions of enterprises. This reflects the role of the city government on the one hand and the role of the city in the region - here, urban agglomerations in China on the other. In addition to a series of tax incentives and subsidies provided by the city government to enterprises engaged in innovation research, the government’s commitment to the attraction of talent, the innovation platform that is provided, and the innovation environment are all factors that must be considered by innovative enterprises in selecting locations. Particularly in China, there is a clear spatial-political bias towards scientific cooperation between certain cities, with national and regional capitals becoming ever more important as scientific coordination centers (Andersson et al., 2014). As a result, research on the geography of innovation in China needs to focus on political and economic factors, especially the administrative level of a city and the role of the government, which has a profound impact on its innovation capacity (Zhang and Wu, 2019). In addition, despite the increasing globalization of R&D, agglomeration economies related to the availability of physical and intangible knowledge assets also play an increasing role in determining firms’ innovation performance (Delgado-Marquez et al., 2018). As a result, the vigorous promotion of the development of urban agglomerations by the Chinese government has enhanced the status of urban agglomerations in national development and innovation, and this makes the core cities of urban agglomerations - which gather regional high-quality innovation resources - being greatly attractive locations for the headquarters and branches of innovative enterprises (Li and Phelps, 2018; Ma et al., 2018; Fang, 2020).
In addition to the attributes of the city itself, intercity relations have been increasingly deemed to be core dynamic of understanding social-economic spatial processes (Cao et al., 2019). The characteristics of intercity relations also influence the distribution and location of innovative firms’ institutions. Following the relationship framework of proximity and innovation proposed by Boschma (2005), institutional, technological, and geographical proximity between cities matter to the networking organization of innovative enterprises. In most studies, institutional proximity is defined in terms of the level of similarity of informal constraints and formal rules that are shared by actors (Boschma, 2005). The sharing of formal or informal rules and codes increases the likelihood that innovators in different cities will start a partnership (Lazzeretti and Capone, 2016). Technological proximity impacts on collaborative innovation between cities, as innovative enterprises usually consider establishing branches in cities with similar technological capabilities (Liu et al., 2019). Geographical proximity can reduce the transportation costs of interfirm connections, improve the convenience of resource and market access, and facilitate the absorption and utilization of tacit knowledge resources (Eriksson, 2011).

3 Data and methodology

3.1 Data

Given that the involvement of core secrets, as well as restrictions imposed by national technology protection regulations, both limit the innovation links between international innovation enterprises, inter-city innovation networks at national scale are thus a relatively complete system. As a result, this paper focuses on the innovation networks shaped by LI-ENTs in Urban China. It is well known that the definition of “innovation” is very broad (Malecki, 2014). Correspondingly, it is difficult to give a uniform criterion for LI-ENTs. We selected the sample enterprises in the following way. First, we established a basic enterprise database, based on the evaluation of Chinese innovative enterprises by various authoritative institutions around the world and in China (Table 1). Second, we collected data on the location of their headquarters and branches in 2018 by searching the annual reports and official websites of these enterprises, and then excluding enterprises that are only located in one city. Third, we omitted enterprises with fewer than 10 patents in 2018 (although innovation is not just about patent output, it is a relatively reliable criterion that can be given at present). The enterprises database offers the information on positions and functions of 1778 LI-ENTs across 353 cities in China.
Table 1 The evaluation of Chinese innovative enterprises by various authoritative institutions
Evaluation Institutions Number
Innovative (Pilot) Enterprises Ministry of Science and Technology of China, State- owned Assets Supervision and Administration Commission of China, All-China Federation of Trade Unions 676
(2012-2016)
National Technological Innovation Demonstration Enterprises Ministry of Industry and Information Technology of China, The Ministry of Finance of China 495
(2011-2017)
The List of 1000 Top Chinese
Innovative Enterprises
China’s Renmin University 1000
(2017)
China’s 100 most innovative
companies
Clarivate Analytic 200
(2016, 2017)
Chinese corporate in 2017 Global
Innovation 1000
Strategy& 113
(2017)

3.2 Methodology

3.2.1 Network construction

Due to the confidential nature of technology diffusion in general, the innovation linkages largely occur between headquarters and branches of large innovative enterprises, while the innovation connection between branches is relatively weak (Li and Bathelt, 2020). In other words, the intercity innovation linkages shaped by LI-ENTs are more vertical. As a result, we adopt the headquarter-subsidiary model proposed by Alderson and Beckfield (2004) rather than the INM devised by Taylor (2001) to generate the intercity innovation network, as the former emphasizes vertical connections between headquarter and subsidiary while the latter treats all potential links between nodes as effective. We encode different degrees of connection between headquarters and various branches, addressing: R&D centers (4), regional headquarters (3), production plants (2), and subordinate offices (1). These formed the four strength levels used for differential assignment within the study. Based on this schema, the directional urban relation strength of these innovative enterprises - termed the “innovation enterprise flow” (IEF) - could be calculated, using following formula:
$IE{{F}_{ij}}=\mathop{\sum }^{}w\cdot {{f}_{ij}}\left( i\ne j \right)$
where IEFij is the level of intercity links between innovative enterprise sectors; fij is the number of links from city i (headquarter location) to city j (branch location); and w is the weight of the links type.
By employing the headquarter-branch model, directional intercity relations are produced and the connectivities of cities could thus be divided into two indicators, i.e., outdegree (Oi) and indegree (Di).
The outdegree represents the city’s control over IEF, and the indegree reflects the city’s ability to attract IEF. The formula is as follows:
${{O}_{i}}=\underset{j}{\mathop \sum }\,{{F}_{ij}}\left( i\ne j \right)$
${{D}_{i}}=\underset{j}{\mathop \sum }\,{{F}_{ji}}\left( i\ne j \right)$
The city total degree (Ni) is the sum of the city outdegree and the city indegree. The higher the city total degree is, the more central the position that the city occupies within the network. The formula is as follows:
${{N}_{i}}={{O}_{i}}+{{D}_{i}}$

3.2.2 Network analysis

Acknowledging the aeolotropism of city network connections, a spatial interaction model was used in order to perform a quantitative analysis of the influencing factors of the city network in China based on the presence of innovative enterprises. Because the dependent variable is a counting variable subject to the phenomenon of over-dispersion, the negative binomial regression method was used to estimate the model. The model was built as follows:
${{Y}_{ij}}=\underset{l\in L}{\mathop \sum }\,{{\beta }_{l}}{{O}_{l}}\left( i \right)+\underset{m\in M}{\mathop \sum }\,{{\gamma }_{m}}{{D}_{m}}\left( j \right)+\underset{k\in K}{\mathop \sum }\,{{\theta }_{k}}{{d}_{k}}\left( i,j \right)+\varepsilon \left( i,j \right)+C$
where Yij is the IEF value from city i to city j; Ol(i) is the attribute factors of city i which externally establish IEF; Dm(j) is the attribute factors of city j which receives IEF (Table 2). Meanwhile, the index l belongs to the index set L and the index m belongs to the index set M, respectively. dk(i,j) is the proximity factor between city i and city j, and the index k belongs to the proximity index set K. The constant is C, the random error is ε(i,j), and the set of parameters is βl, γm, and θk.
Table 2 Description of independent variables
Variable Description Source
GDPPC Gross Domestic Production per capita (in log) China city statistical yearbooks, 2012-2016
STUDENT Number of university/college students (in log) China city statistical yearbook, 2012-2016
EXPEDITURE Amount of science and technology expenditure (in log) China city statistical yearbook, 2012-2016
FDI Foreign direct investment (in log) China city statistical yearbook, 2012-2016
ADMIN Urban administrative level (in log) Administrative division of China
POPSHARE Proportion of the population of an urban agglomeration located in a given city (in log) China city statistical yearbook, 2012-2016
DISTANCE Euclidean distance between two cities (in log) Calculated from cities longitude and latitude
PATENT Degree of deviation in patent types between cities Shanghai intellectual property platform
RELATIONSHIP Administrative relationship between cities (in log) Administrative division of China

Note: We used five-year average data for cities from 2012 to 2016.

The generation of intercity innovative enterprise flow is influenced by the thrust of the cities of origin, the pull of the destination cities, as well as the force of intercity relations. At present, no studies have proven the existence of a special urban attribute that only has a single impact on the spin off or absorption of enterprises; as such, we did not select different indicators for the cities of origin and the cities of destination in this study.
Among these indicators, per capita GDP (GDPPC) was used to measure the level of economic development. The number of university/college students (STUDENT), which reflects the stock of human capital of the city (Crescenzi et al., 2014), and the amount of science and technology expenditure (EXPEDITURE), which reflects the innovation capital investment of the city (Grillitsch and Chaminade, 2018), jointly represent the innovation ability of a city. Foreign direct investment (FDI) plays an important role in local technology imports and the promotion of innovation capacity (Wei and Liao, 2013). The urban administrative level (ADMIN) is especially an important factor in China’s top-down management system (Zhang and Wu, 2019). The proportion of the population of an urban agglomeration that is located within a given city (POPSHARE) was used in the study to reflect the city’s status within the urban agglomeration.
We chose three kinds of proximity to measure intercity relationships. Geographic proximity (DISTANCE) was measured by the Euclidean distance between two cities (Ma et al., 2014). Technological proximity (PATENT) was measured according to the degree of deviation in patent types between cities. PATENT is defined as follows:
$PATENT=\frac{\mathop{\sum }_{k=1}^{n}{{s}_{ik~}}\cdot ~{{s}_{jk}}}{\sqrt{\mathop{\sum }_{k=1}^{n}s_{ik}^{2}\cdot ~\mathop{\sum }_{k=1}^{n}s_{jk}^{2}}}$
where sik and sjk are the patent output quantity of technology k in city i and city j; n is the total number of technology types. These data are from Shanghai intellectual property platform (http://www.shanghaiip.cn/Search/login.do). The third type of proximity, institutional proximity (RELATIONSHIP), was reflected in this study by the relationship between urban administrative districts. If two cities were in the same province, the RELATIONSHIP was assigned a value of 1; otherwise, it was considered to be 0.

4 The geography and network of Chinese LI-ENTs

The headquarters of 1778 innovative companies considered in this study are located in 204 cities in China. Beijing, the capital of China, has absolute superiority in the network, as the gathering place of national innovation enterprise headquarters. The top three cities - Beijing, Shanghai, and Shenzhen - accounted for 29.18% of all headquarters, while the top 10 cities accounted for more than half of all headquarters. The three major urban agglomerations on China’s coastal areas have obvious agglomeration advantages, with headquarters in the Yangtze River Delta (YRD), Beijing-Tianjin-Hebei (BTH), and the Pearl River Delta (PRD) accounting for 24.86%, 18.90%, and 12.04%, respectively (Figure 2).
Figure 2 The city locations of the headquarters of China’s 1778 largest innovative enterprises

Note: The shaded areas in the figure show the 19 Chinese urban agglomerations, the boundary of which is based on Fang et al. (2016). This boundary is consistent in Figures 3 and 4.

The study revealed the presence of 32,064 branches located in 353 cities in China, with both scattered and concentrated features of distribution. Beijing accommodates 10.97% of all branches, and the top 10 cities contain more than half of the identified branches. The YRD, BTH, and PRD are also hubs for innovative enterprise branches, accounting for 23.59%, 16.25%, and 10.56% of the total number of branches respectively.
Figure 4 shows the oerall structure of the city network, which presents a radial pattern that extends outwards from Beijing. The highest levels of connections (IEF 400-800) occur between Beijing and Shanghai, Beijing and Shenzhen, and Beijing and Chengdu. Secondary connections (IEF 200-400) mainly occur between Beijing and some of the provincial capitals, with only one connection not including Beijing (that between Shenzhen and Shanghai). Low-level connections (IEF<200) were found to exist throughout the country. As can be seen in Figure 4, the central city of Wuhan has not fully developed in the role of connecting the east with the west and the north with the south, and the western city of Chengdu has not established high-level relations with cities in addition to Beijing. This differs from previous observations in which a rhomboid structure consisted of Beijing, Shanghai, Guangzhou/ Shenzhen, Chengdu/Chongqing, and Wuhan was detected based on mapping intercity relations of co-patents and co-papers in China (Ma et al., 2015, 2018).
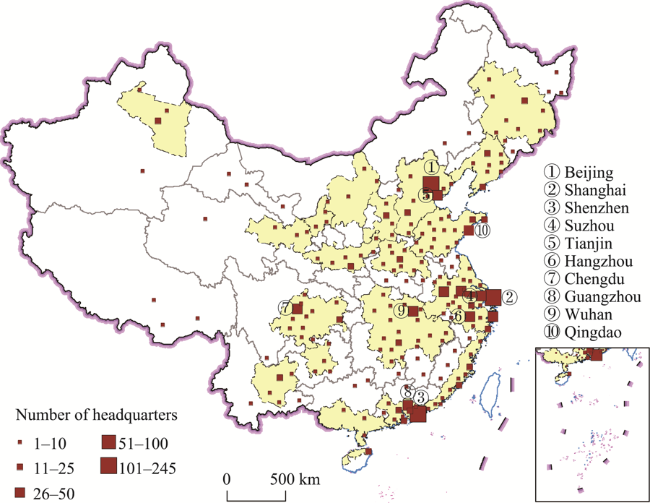
Figure 3 The city locations of the branches of China’s 1778 largest innovative enterprises
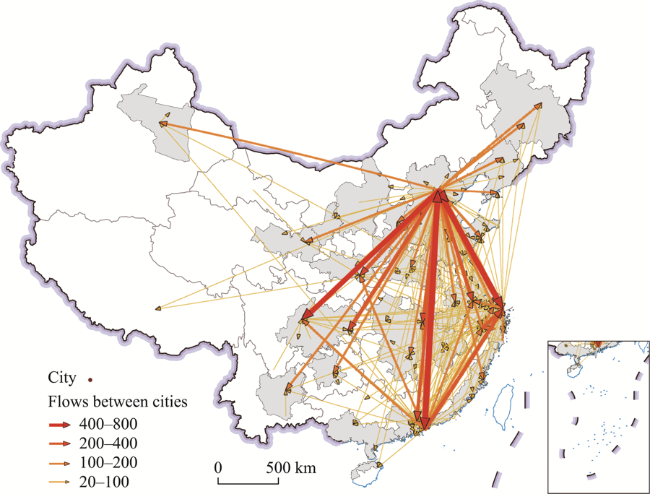
Figure 4 Intercity networks constructed by China’s 1778 largest innovative enterprises
Table 3 compares the internal and external network connections of the BTH, YRD, and PRD urban agglomerations. It is found that the cities of the YRD urban agglomeration are most closely connected with each other internally, while the outward connections of the BTH urban agglomeration are the strongest. High city primacy is evident in Beijing in BTH, Shanghai in the YRD, and Shenzhen in the PDR, and these cities play the role of hinges or hubs within their urban agglomerations.
Table 3 Internal and external connections of the three most important urban agglomerations in China
Urban agglomeration Innovative enterprise flows within the region Innovative enterprise flows out of the region
Total strength Average strength P/R (%) Total strength Average strength P/R (%)
Beijing-Tianjin-Hebei 1556 119.69 43 15063 44.30 82
Yangtze River Delta 3393 130.50 23 13180 40.31 36
Pearl River Delta 1016 112.89 33 8686 25.25 53

Note: P/R refers to proportion of the primate city (the top one) in the region.

The capital city of Beijing is the absolute core of the network; and its degree centrality is more than the sum of Shanghai (in second place) and Shenzhen (in third place). Beijing has both a high out-degree and in-degree (Table 4), and enterprises with headquarters in Beijing have set up branches in 297 cities (84.14%), whilst Beijing has attracted branches of innovative enterprises with headquarters in 139 cities (39.38%). These results show that Beijing has a strong control over the flow of innovative enterprises, acting as an important attractor.
Table 4 City node attribution in the network (top 10)
Ranking Total-degree Out-degree In-degree Radiating cities Attractive cities
1 Beijing (13714) Beijing (9926) Beijing (3788) Beijing (297) Beijing (139)
2 Shanghai (6271) Shenzhen (3423) Shanghai (3493) Shenzhen (168) Shanghai (138)
3 Shenzhen (5324) Shanghai (2778) Shenzhen (1901) Shanghai (146) Chengdu (95)
4 Hangzhou (2822) Hangzhou (1737) Chengdu (1457) Nanjing (137) Shenzhen (93)
5 Guangzhou (2493) Guangzhou (1221) Guangzhou (1272) Chengdu (134) Guangzhou (84)
6 Chengdu (2427) Wuhan (1042) Tianjin (1303) Tianjin (129) Tianjin (83)
7 Tianjin (2320) Tianjin (1017) Hangzhou (1085) Hangzhou (129) Wuhan (82)
8 Wuhan (2117) Suzhou (993) Nanjing (1084) Wuhan (127) Nanjing (75)
9 Nanjing (1923) Chengdu (970) Wuhan (1075) Guangzhou (113) Xi’an (74)
10 Suzhou (1793) Nanjing (839) Chongqing (934) Changsha (99) Chongqing (72)
The provincial capital cities also occupy high positions in the network, undertaking the function of network connection within and outside their provinces. For example, the five preferential flows of innovative enterprises that flow into Zhengzhou, the capital of Henan province, all come from within the province; five of the preferential flows that flow into Wuhan, the capital city of Hubei, come from within the province.

5 Results of network analysis

To ensure the accuracy of the model, the following processing was carried out in performing the model calculation. First, considering that the explained variable (IEF) is a non-negative integer and its variance was significantly higher than expected, negative binomial regression was selected to fit the model. Second, the multicollinearity test of the model showed that the average value of VIF of the model variable was 2.29 and the maximum value was 4.04, indicating that the model variables have no multicollinearity. Thirdly, considering the robustness of the model, AHP was adopted to introduce variables into models 1, 2, 3, 4, 5, and 6 one by one. Among them, model (6) introduced all variables and is the final result of regression. The other 5 models were used as references (Table 5).
Table 5 Regression result of the influence factors in intercity networks based on LI-ENTs
Model (1) Model (2) Model (3) Model (4) Model (5) Model (6)
O_LnGDPPC 1.941*** 1.165*** 0.513*** 0.581*** 0.625*** 0.616***
(0.029) (0.027) (0.033) (0.033) (0.034) (0.034)
O_LnSTUDENT 0.625*** 0.388*** 0.276*** 0.310*** 0.289***
(0.011) (0.013) (0.015) (0.016) (0.016)
O_LnEXPEDITURE 0.446*** 0.377*** 0.439*** 0.443***
(0.015) (0.016) (0.018) (0.018)
O_LnADMIN 0.621*** 0.602*** 0.558***
(0.048) (0.048) (0.049)
O_LnFDI -0.087*** -0.079***
(0.013) (0.013)
O_Ln(POPSHARE+1) 0.884***
(0.155)
D_LnGDPPC 1.410*** 0.689*** 0.249*** 0.287*** 0.296*** 0.281***
(0.027) (0.026) (0.032) (0.032) (0.032) (0.032)
D_LnSTUDENT 0.594*** 0.421*** 0.280*** 0.278*** 0.240***
(0.011) (0.013) (0.015) (0.015) (0.016)
D_LnEXPEDITURE 0.328*** 0.240*** 0.250*** 0.260***
(0.015) (0.015) (0.018) (0.018)
D_LnADMIN 0.877*** 0.889*** 0.811***
(0.050) (0.050) (0.050)
D_LnFDI -0.012 0.003
(0.012) (0.012)
D_Ln(POPSHARE+1) 1.514***
(0.145)
LnDISTANCE -0.502*** -0.298*** -0.135*** -0.200*** -0.208*** -0.268***
(0.025) (0.021) (0.020) (0.020) (0.020) (0.021)
RELATIONSHIP 0.884*** 1.208*** 1.335*** 1.343*** 1.335*** 1.261***
(0.067) (0.053) (0.050) (0.050) (0.050) (0.050)
LnPATENT -0.921*** -5.226*** -3.162*** -2.211*** -1.938*** -2.112***
(0.245) (0.203) (0.197) (0.203) (0.210) (0.211)
_cons -34.963*** -31.039*** -25.494*** -22.542*** -23.321*** -22.442***
(0.538) (0.443) (0.441) (0.457) (0.481) (0.483)
/lnalpha 1.131*** -0.788*** -1.799*** -1.818*** -1.750*** -1.716***
(0.034) (0.088) (0.158) (0.140) (0.134) (0.129)
Obs. 82082 82082 82082 82082 82082 82082
Pseudo R2 0.166 0.273 0.299 0.308 0.309 0.312

Standard errors are in parenthesis. *** p<0.01, ** p<0.05, * p<0.1

The results show that the urban attribute variables GDPPC, STUDENT, EXPEDITURE, ADMIN, and POPSHARE all had a significant positive impact on IEF. This indicates that if a city has a high level of comprehensive development, abundant human capital, large investments in innovation capital, a high administrative level, and high status in an urban agglomeration, it has a strong ability to attract innovative enterprises and promote the outward diffusion of innovative enterprises. The effects of GDPPC, STUDENT, EXPEDITURE, and ADMIN on innovation flow have been repetitively verified in a range of previous studies (Head and Mayer, 2004; Andersson et al., 2014; Crescenzi et al., 2014; Grillitsch and Chaminade, 2018; Zhang and Wu, 2019), while the impact of a city’s position in an urban agglomeration on innovation has received little attention from scholars. We found that although Beijing, as the national capital, and Shanghai, Tianjin, and Chongqing, as municipalities directly under the central government, benefit from their high administrative level, which brings more innovation resources and competitive advantages at the national level. With the rapid development of urban agglomerations, other core cities have also become hinges or hubs in urban agglomerations’ innovative development. Taken together, these capitals and hubs are the first place for the establishment of innovative enterprise headquarters and spin off branch offices. Most of the cities that occupy a dominant position in the urban agglomeration economy are cities with a high administrative level. Although the national government and policies give strong support (top-down), this shows that more spontaneous market forces (bottom-up) are also in operation.
Our findings on the impact of FDI on IEF were unexpected. Since the reform and opening up, China has strongly encouraged the introduction of foreign investment. With the entry of FDI, external advanced knowledge and technology are also brought in. As such, FDI has become an important external driving force for the innovative development of many cities in China, and has been confirmed by many researchers previously (Diez and Berger, 2005; Wei and Liao, 2013; Wang et al., 2016; Wei et al., 2019). However, this study found that FDI had no positive effect on the cross-city distribution of large innovative enterprises in China. In addition, the significant negative correlation between the impact of FDI on the establishment of branch offices in other cities suggests that a high level of FDI in a city does not promote but rather discourages the Chinese enterprises located in that city from establishing branches in other cities in China. Chinese enterprises located in the same city as foreign enterprises may be mostly foreign enterprises’ suppliers and service providers, which, due to the pressure of competition with foreign enterprises, tend to be small in scale and have difficulty in expanding and establishing branches in other cities. In short, the promotion effect of FDI on urban innovation cannot be transmitted to innovation diffusion among Chinese cities and can even hinder such diffusion.
A high degree of consistency was located between the influence of the urban attributes of the origin city on the transfer of IEF and the effect of the urban attributes of the destination city on the absorption of IEF: if a variable has a positive influence on the transfer of IEF, then this variable also has a positive influence on the absorption of IEF. Although the influence of the same variable on IEF transfer and absorption has different magnitudes (coefficients), no variable was found to separately affect only the spin off or the absorption of innovative enterprise institutions. This reflects the coexistence of “gathering” and “spinning off” of innovative branches when promulgating incentive policies of promoting innovation developments.
As for the relational variables, the Euclidean distance coefficient of geographical proximity variable was found to be significantly negative, indicating that geographical distance will cause great resistance to the IEF between cities. In other words, the further two cities are from one another, the more difficulties this distance will cause for the distribution of headquarters and branches for an innovative enterprise. This finding again proves the importance of geographical distance as a factor affecting the innovation connection between cities under the conditions of informatization and space of flows, because the transmission of tacit knowledge requires geographical proximity and face-to-face communication (Eriksson, 2011).
The coefficient of technological proximity was found to be significantly negative, indicating that a greater degree of IEF occurs among cities with different technology types. The vertical distribution of different levels of departments in innovative enterprises may be the main reason for this result. The coefficient of institutional proximity, however, was found to be significantly positive, which indicates that similarities in policy, culture, language, customs, rituals, etc., in a province or between provinces greatly impact on the strategic location decisions across regions of innovative enterprise departments and the generation of innovation enterprise flows, also demonstrating that innovative enterprises in China exhibit strong cultural embeddedness, and that innovation links within the corporate sector are more likely to occur between cities with a high degree of institutional and culture proximity.

6 Conclusion and discussion

This paper has explored the distribution patterns of China’s most innovative large enterprises and the intercity networks created by these LI-ENTs. We have found that the networks formed by Chinese LI-ENTs integrate almost all of the country’s prefecture-level cities, although large differences exist between cities, both in terms of their embeddedness and functional role within the network, factors which are largely influenced by the political-economic status of the city (Zhang and Wu, 2019). LI-ENTs’ headquarters and branches were found to concentrate within national capitals, municipalities directly under the central government, and provincial capitals, and cities with high degrees of centrality within the network. Furthermore, three economically developed city clusters along China’s coast, i.e., the BTH, the YRD, and the PRD - have become host to high concentrations of LI-ENT institutions. In particular, we found that the core city of each city cluster has the function of a hub, connecting cities within and outside the cluster.
The overall pattern of the national urban network is still dominated by a radial pattern, with Beijing as its core. This pattern shows a stronger political orientation than the scientific collaboration networks (Ma et al., 2018), patent collaboration networks (Ma et al., 2015), and patent transfer networks between Chinese cities (Gui et al., 2019), and confirms that the higher the administrative level of the city, the more control it has in the network (Andersson et al., 2014). This may also be related to inter-institutional innovation hierarchies within LI-ENTs. We argue that China’s LI-ENTs have, to some extent, performed the dual function of embedding in local cities and connecting domestic cities, and thus facilitating the effective and interactive dissemination of explicit and tacit knowledge among domestic cities.
This study confirms that the formation of the intercity networks constructed by LI-ENTs is simultaneously influenced by cities’ attributes of economy, innovation, and function, as well as geographic, technological, and institutional proximity between cities. Among these factors, the city’s innovation capacity can be regarded as the “threshold” condition for LI-ENT entry; this is intertwined with the city’s political and economic character, and by influencing the location choice of LI-ENTs, it also affects the establishment of urban relations. It is worth noting that China’s urban agglomerations have played an important role in the development of innovative firms and their relationships, no matter whether they are developed or not.
This study also extends the research on the impact of FDI on innovation diffusion (Diez and Berger, 2005; Mustapha and Mendi, 2015; Piening et al., 2016) and finds that the level of urban globalization represented by FDI does not have a positive impact on the distribution patterns and urban relations of LI-ENTs in the country. This finding suggests that the impact of the globalization of TNCs and the creation of global innovation networks on knowledge diffusion and innovation may be confined to certain cities and may not be significant for other cities in China.
This study discusses how LI-ENT-based national-scale intercity networks (or national innovation networks), could be more resilient and richer in potential than global and local-scale networks, because such national-scale networks have the advantage of national-level policy support and of sharing the same institutional and cultural background. Such networks could also constitute a powerful tool in the task of building national innovation capacity, enhancing countries’ overall innovation capacity (Lundvall, 1992), and counteracting the possible risks presented by scientific and technological competition outside of the country. Of course, national scales also vary in size, and differences exist in terms of a country’s needs, and perceptions about what it takes to build innovation networks within countries and to connect them to global networks. For countries with large geographic areas and large populations, it may therefore be best to invest in establishing intra-national innovation networks. It is important to note, however, it may be safer for smaller countries not to rely only on their own innovation resources and market needs, but also to seek to embed their national networks in the global innovation network.
This paper has some limitations, which also suggest avenues for further research. It is clear that inter-city connections based on innovative enterprises consist of inter-city connection by “headquarters-branch” and the inter-city connection between innovative enterprises. Our study only uses the “headquarters-branch” method to construct an inter-city innovation network, which ignores the possible hidden knowledge flow between branches or enterprises. In other words, if the network interlocking model is adopted, a different intercity connection network is obtained. Although enterprises’ real core technology and secret knowledge are difficult to spread, with the increasingly refined division of regional innovation and the rise of small and medium-sized technology enterprises, there will be more and more knowledge connections between innovative enterprises (branches). Researchers often criticize interlocking network models for focusing on inter-enterprise connections, while it may be suitable for discussing the knowledge connection networks of enterprises, which are worthy of further attention and research.
[1]
Alderson A S, Beckfield J, 2004. Power and position in the world city system. American Journal of Sociology, 109(4): 811-851.

DOI

[2]
Amin A, Thrift N, 1992. Neo-Marshallian nodes in global networks. International Journal of Urban and Regional Research, 16(4): 571-587.

DOI

[3]
Andersson D E, Gunessee S, Matthiessen C W et al., 2014. The geography of Chinese science. Environment and Planning A, 46(12): 2950-2971.

DOI

[4]
Audretsch D, Falck O, Heblich S, 2011. Who’s got the aces up his sleeve? Functional specialization of cities and entrepreneurship. Annals of Regional Science, 46(3): 621-636.

DOI

[5]
Bathelt H, Li P F, 2020. Processes of building cross-border knowledge pipelines. Research Policy, 49(3): 103928.

DOI

[6]
Black G, 2003. The Geography of Small Firm Innovation. Boston: MA: Kluwer Academic Publishers.

[7]
Boschma R A. 2005. Proximity and innovation: A critical assessment. Regional Studies, 39(1): 61-74.

DOI

[8]
Bunnell T G, Coe N M, 2001. Spaces and scales of innovation. Progress in Human Geography, 25(4): 569-589.

DOI

[9]
Cantwell J, Iammarino S, 2000. Multinational corporations and the location of technological innovation in the UK regions. Regional Studies, 34(4): 317-332.

DOI

[10]
Cao X Z, Zeng G, Ye L, 2019. The structure and proximity mechanism of formal innovation networks: Evidence from Shanghai high-tech ITISAs. Growth and Change, 50(2): 569-586.

DOI

[11]
Chong Z, Pan S, 2020. Understanding the structure and determinants of city network through intrafirm service relationships: The case of Guangdong-Hong Kong-Macao Greater Bay Area. Cities, 103(4): 102738.

DOI

[12]
Cordell A J, 1973. Innovation, the multinational corporation: Some implications for national science policy. Long Range Planning, 6(3): 22-29.

[13]
Crescenzi R, Pietrobelli C, Rabellotti R, 2014. Innovation drivers, value chains and the geography of multinational corporations in Europe. Journal of Economic Geography, 14(6): 1053-1086.

DOI

[14]
Delgado-Marquez B L, Hurtado-Torres N E, Pedauga L E et al., 2018. A network view of innovation performance for multinational corporation subsidiaries. Regional Studies, 52(1): 47-67.

DOI

[15]
Diez J R, Berger M, 2005. The role of multinational corporations in metropolitan innovation systems: empirical evidence from Europe and Southeast Asia. Environment and Planning A, 37(10): 1813-1835.

DOI

[16]
Duranton G, Puga D, 2005. From sectoral to functional urban specialisation. Journal of Urban Economics, 57(2): 343-370.

DOI

[17]
Eriksson R H, 2011. Localized spillovers and knowledge flows: How does proximity influence the performance of plants. Economic Geography, 87(2): 127-152.

DOI

[18]
Fang L. 2020. Agglomeration and innovation: Selection or true effect? Environment and Planning A: Economy and Space, 52(2): 423-448.

DOI

[19]
Feldman M P, 2000. Location and innovation:The new economic geography of innovation, spillovers, and agglomeration. In: ClackG L, FeldmanM P, GertlerM S et al. (eds). The Oxford Handbook of Economic Geography. Oxford: Oxford University Press, 373-394.

[20]
Florida R, Kenney M, 1990. The Breakthrough Illusion:Corporate America’s Failure to Move from Innovation to Mass Production. New York: Basic Books.

[21]
Fu X L, Pietrobelli C, Soete L, 2011. The role of foreign technology and indigenous innovation in the emerging economies: Technological change and catching-up. World Development, 39(7): 1204-1212.

DOI

[22]
Grillitsch M, Chaminade C, 2018. Bridging the gap: Citizenship diversity and global innovation networks in small and medium size companies. European Planning Studies, 26(12): 2279-2303.

DOI

[23]
Harrison B, 1992. Industrial districts: Old wine in new bottles. Regional Studies, 26(5): 469-483.

DOI

[24]
Harrison B, 1994. The small firms myth. California Management Review, 36(3): 142-158.

DOI

[25]
Hayter R, Patchell J, Rees K, 1999. Business segmentation and location revisited: Innovation and the Terra incognita of large firms. Regional Studies, 33(5): 425-442.

DOI

[26]
Head K, Mayer T, 2004. Market potential and the location of Japanese investment in the European Union. Review of Economics and Statistics, 86(4): 959-972.

DOI

[27]
Howells J, 1999. Competition, cooperation and the state. Research Policy, 28(1): 101-105.

DOI

[28]
Jakobsen S E, Onsager K, 2005. Head office location: Agglomeration, clusters or flow nodes? Urban Studies, 42(9): 1517-1535.

DOI

[29]
Lazzeretti L, Capone F, 2016. How proximity matters in innovation networks dynamics along the cluster evolution: A study of the high technology applied to cultural goods. Journal of Business Research, 69(12): 5855-5865.

DOI

[30]
Lee N, Rodriguez-Pose A, 2013. Original innovation, learnt innovation and cities: Evidence from UK SMEs. Urban Studies, 50(9): 1742-1759.

DOI

[31]
Li P F, Bathelt H, 2019. Headquarters-subsidiary knowledge strategies at the cluster level. Global Strategy Journal, 10(3): 585-618.

DOI

[32]
Li Y C, Phelps N, 2018. Megalopolis unbound: Knowledge collaboration and functional polycentricity within and beyond the Yangtze River Delta Region in China, 2014. Urban Studies, 55(2): 443-460.

DOI

[33]
Liefner I, Hennemann S, 2011. Structural holes and new dimensions of distance: The spatial configuration of the scientific knowledge network of China’s optical technology sector. Environment and Planning A, 43(4): 810-829.

DOI

[34]
Liu X J, Derudder B, 2012. Two-mode networks and the interlocking world city network model: A reply to Neal. Geographical Analysis, 44(2): 171-173.

DOI

[35]
Lundvall B A, 1992. National Systems of Innovation:Towards a Theory of Innovation and Interactive Learning. London & New York St. Martin’s Press.

[36]
Ma H T, 2020. The theoretical construction and network simulation of intercity innovative relationships in knowledge flow space. Acta Geographica Sinica, 75(4): 708-721. (in Chinese)

DOI

[37]
Ma H T, 2022. Evolutionary networks of interurban technological collaboration across Chinese city-regions. Regional Studies, Regional Science, 9(1): 457-460.

[38]
Ma H T, Fang C L, Lin S N et al., 2018. Hierarchy, clusters, and spatial differences in Chinese inter-city networks constructed by scientific collaborators. Journal of Geographical Sciences, 28(12): 1793-1809.

DOI

[39]
Ma H T, Fang C L, Pang B et al., 2014. The effect of geographical proximity on scientific cooperation among Chinese cities from 1990 to 2010. Plos One, 9(11): e111705.

[40]
Ma H T, Fang C L, Pang B et al., 2015. Structure of Chinese city network as driven by technological knowledge flows. Chinese Geographical Science, 25(4): 498-510.

DOI

[41]
Ma H T, Wei Y H D, Dai L et al., 2022. institutional systems, geographical proximity, and technology transfer across cities in the Guangdong-Hong Kong-Macau Megalopolis, China. EPA: Economy and Space, 54(11): 0308518X2211048.

[42]
Malecki E J, 2014. The geography of innovation. In: Fischer M M, Nijkamp P (eds). Handbook of Regional Science, Berlin: Springer,375-389.

[43]
Matthiessen C W, Schwarz A W, Find S, 2002. The top-level global research system, 1997-99: Centres, networks and nodality. Urban Studies, 39(5/6): 903-927.

DOI

[44]
Matthiessen C W, Schwarz A W, Find S, 2010. World cities of scientific knowledge: Systems, networks and potential dynamics. Urban Studies, 47(9): 1879-1897.

DOI

[45]
McCann P, Mudambi R, 2005. Analytical differences in the economics of geography: The case of the multinational firm. Environment and Planning A, 37(10): 1857-1876.

DOI

[46]
Mustapha N, Mendi P, 2015. Multinational corporations as channels for international technology transfer: Evidence from the South African innovation survey. South African Journal of Economic and Management Sciences, 18(1): 128-142.

DOI

[47]
Patchell J, Hayter R, Rees K, 1999. Innovation and local development:The neglected role of large firms. In: Malecki E J, Oinas P (eds). Oinas P (eds). Making Connections:Technological Learning and Regional Economic Change. Aldershot: Ashgate, 109-142.

[48]
Patel P, 1996. Are large firms internationalizing the generation of technology? Some new evidence. IEEE Transactions on Engineering Management, 43(1): 41-47.

DOI

[49]
Perry M, 1999. Small Firms and Economic Networks. London: Routledge.

[50]
Pflieger G, Rozenblat C, 2010. Urban networks and network theory: The city as the connector of multiple networks. Urban Studies, 47(13): 2723-2735.

DOI

[51]
Piening E P, Salge T O, Schafer S, 2016. Innovating across boundaries: A portfolio perspective on innovation partnerships of multinational corporations. Journal of World Business, 51(3): 474-485.

DOI

[52]
Piore M J, Sabel C F, 1984. The Second Industrial Divide. New York: Basic books.

[53]
Scott A J, 1992. The role of large producers in industrial districts: A case study of high technology systems houses in Southern California. Regional Studies, 26(3): 265-275.

DOI

[54]
Shearmur R, 2012. Are cities the font of innovation? A critical review of the literature on cities and innovation. Cities, 29: S9-S18.

[55]
Taylor P J, 2001. Specification of the world city network. Geographical Analysis, 33(2): 181-194.

DOI

[56]
Wang Y D, Ning L T, Li J et al., 2016. Foreign direct investment spillovers and the geography of innovation in Chinese regions: The role of regional industrial specialization and diversity. Regional Studies, 50(5): 805-822.

DOI

[57]
World Bank Group WBG, Development Research Center of the State Council, The People’s Republic of China (DRC), 2019. Innovative China: New Drivers of Growth. Washington, DC: World Bank.

[58]
Wei Y H D, Li J A, Ning Y M, 2010. Corporate networks, value chains, and spatial organization: A study of the computer industry in China. Urban Geography, 31(8): 1118-1140.

DOI

[59]
Wei Y H D, Liao F H F, 2013. The embeddedness of transnational corporations in Chinese cities: Strategic coupling in global production networks. Habitat International, 40: 82-90.

DOI

[60]
Wei Y L, Kang D, Wan Y Z, 2019. Geography, culture, and corporate innovation. Pacific-Basin Finance Journal, 56: 310-329.

DOI

[61]
Zhang F Z, Wu F L, 2019. Rethinking the city and innovation: A political economic view from China’s biotech. Cities, 85: 150-155.

DOI

[62]
Zhang M, Partridge M D, Song H S, 2020a. Amenities and the geography of innovation: Evidence from Chinese cities. Annals of Regional Science, 65: 105-145.

DOI

[63]
Zhang W Y, Derudder B, Wang J et al., 2020b. An analysis of the determinants of the multiplex urban networks in the Yangtze River Delta. Tijdschrift Voor Economische en Sociale Geografie, 111(2): 117-133.

DOI

Outlines

/