Research Articles

Impact of cascade reservoirs on the delayed response behaviour of sedimentation in the Three Gorges Reservoir

  • LI Xin , 1 ,
  • REN Jinqiu 2, 3 ,
  • XU Quanxi 4 ,
  • YUAN Jing 4 ,
  • ZHANG Wei , 1, *
Expand
  • 1. State Key Laboratory of Water Resources and Hydropower Engineering Science, Wuhan University, Wuhan 430072, China
  • 2. Changjiang Survey, Planning, Design and Research Co., Ltd., Wuhan 430010, China
  • 3. Hubei Key Laboratory of Basin Water Security, Wuhan 430010, China
  • 4. Bureau of Hydrology, Changjiang Water Resources Commission, Wuhan 430010, China
*Zhang Wei (1979-), Professor, E-mail:

Li Xin (1994-), PhD Candidate, E-mail:

Received date: 2021-11-22

  Accepted date: 2022-06-09

  Online published: 2023-03-21

Supported by

National Key R&D Program of China(2017YFC0405202)

National Natural Science Foundation of China(U2040218)

Abstract

Delayed response behaviour commonly occurs in conjunction with changes in riverbed scouring and sediment deposition and is a key component in understanding the intrinsic behaviour of reservoir siltation. Due to the complexity of the riverbed siltation process, the variability in the factors that influence siltation and the limitations of available research methods, the understanding of the delayed response behaviour of the sedimentation process in the Three Gorges Reservoir (TGR) is currently merely qualitative, and there is a lack of quantitative in-depth understanding. In addition, the effects of changes in water and sediment conditions on sedimentation in the TGR before and after cascade reservoir impoundment have not been quantified, so further studies are needed to provide a reference for better understanding the intrinsic behaviour of sedimentation in the TGR and the implications for the long-term use of the reservoir. Based on measured water and sediment data from 2003 to 2020 and topographic data from 2003 to 2018, a delayed response model for sedimentation in the TGR is constructed and combined with theoretical derivation to analyse the changes in the delayed response behaviour of the TGR before and after the impoundment of the cascade reservoirs and the associated causes. Then, the influence of changes in water and sediment conditions in previous years on sedimentation in the reservoir area is determined. The results show that (1) the improved delayed response model of sedimentation, which considers variations in external water and sediment conditions, reservoir scheduling, and riverbed adjustment rates, can effectively reflect the sedimentation process in the TGR, especially after the impoundment of the cascade reservoirs. Additionally, the typical section elevation delayed response model can simulate the section elevation adjustment process. (2) After the impoundment of the cascade reservoirs, the decreased variation in incoming water and sediment and more concentrated incoming sediment in the flood season increased the adjustment rate of the riverbed, and the delayed response time of TGR sedimentation was shortened from the previous 5 years to the previous 3 years. The impact of the previous water and sediment conditions is not negligible for the sedimentation process in the TGR, and the cumulative proportion of the previous influence reaches more than 60%. (3) The influence of incoming sediment on the sedimentation process and typical section adjustment process in the reservoir area increased after the impoundment of the cascade reservoirs, and the influence of the water level in front of the dam on sedimentation remained the largest.

Cite this article

LI Xin , REN Jinqiu , XU Quanxi , YUAN Jing , ZHANG Wei . Impact of cascade reservoirs on the delayed response behaviour of sedimentation in the Three Gorges Reservoir[J]. Journal of Geographical Sciences, 2023 , 33(3) : 576 -598 . DOI: 10.1007/s11442-023-2097-7

1 Introduction

After an external disturbance, a river system starts to respond to the disturbance over a certain period of time (the so-called reaction time); then, a certain amount of time (the so-called relaxation or recovery time) is required to reach a new equilibrium state through sediment erosion, transfer and sediment flushing (Graf, 1977; Simon, 1992; Simon and Rinaldi, 2006). Consequently, riverbed evolution lags behind changes in water and sediment conditions. This delayed response phenomenon exists widely in the processes of riverbed evolution and adjustment. Through studies of delayed response behaviour, we can better understand the process of riverbed evolution and the connections between water and sediment changes and riverbed adjustment (Zheng et al., 2014a).
To study the delayed response phenomenon in the evolution of riverbeds, many researchers have developed various methods. Some researchers have conducted empirical analyses by establishing functional relationships based on measured data (Feng et al., 2005; Wu et al., 2008; Shen et al., 2013). Others have used various rates to simulate the riverbed adjustment process based on observations (Hooke, 1995; Simon and Thorne, 1996; Kasai et al., 2004; Simon and Rinaldi, 2006; Choi et al., 2017) or applied artificial neural networks and mathematical models to perform relevant research (Li et al., 2010). Alluvial rivers are characterized by complex water-sediment variation processes and variable influencing factors, and the above methods can be used to study and understand the delayed response process; however, there are still difficulties in quantitatively describing the influence of previous water-sediment conditions and the corresponding delayed response behaviour. The delayed response model proposed by Wu (2008b) can help to solve these problems. The method is based on the principle of automatic river adjustment and combined with previous experience in rate process estimation (Graf, 1977; Simon, 1992; Hooke, 1995; Simon and Thorne, 1996; Kasai et al., 2004), and it can be used to quantitatively analyse and simulate the river adjustment process. Thus, this model has been widely used in studies of bankfull discharge prediction, bankfull area and riverbed flushing and siltation (Wu et al., 2006; Li and Wu, 2011a; Zheng et al., 2014b; Lyu et al., 2020). Some researchers have also used it in the studies of river morphological adjustment patterns. For example, Wu et al. (2006) found that the changes in the elevation of Tongguan were related to the current year and the previous 6 years of water and sediment and the water level before Sanmenxia dam construction. Wang et al. (2020) found that the adjustment of the morphology of the main channel area in the lower Yellow River was influenced by the current year and the previous 7 years of water and sediment conditions, and Lyu et al. (2018b) found that the channel geometry in the Yichang-Chenglingji Reach of the Middle Yangtze River section was related to the water and sediment conditions in the current year and previous 4 years. Zhang et al. (2016) found that the cross-sectional area at Shashi station from 1991 to 2002 was related to the water and sediment conditions in the current year and previous 6 years, while the cross-sectional area at Shashi station from 2003 to 2011 was related to the water and sediment conditions in the current year and previous 4 years. Because the external water and sediment conditions, boundary conditions and degree of artificial influence in each river section differ, different delayed response behaviours are typically observed in different river sections and different periods in the same river section. Therefore, the above model cannot be used directly and needs to be adjusted and optimized according to the characteristics of different river sections.
As the largest hydropower project in the world, the Three Gorges Reservoir (TGR) was built not only for flood management but also for power generation, shipping and water utilization. The sediment problem has been carefully considered and is one of the key technical issues in the TGR (Hu and Fang, 2017). Most previous research into TGR sedimentation has focused on analyses of flood peak and sediment peak propagation characteristics, predictions of the long-term siltation balance, and reservoir scheduling optimization (Chen et al., 2008a, 2008b; Ahn and Song, 2017; Huang et al., 2019; Ren et al., 2020). However, previous studies have neglected the quantitative exploration of the delayed response of sedimentation in the reservoir area and have failed to perform quantitative analyses of the influence of previous water and sediment conditions on sedimentation in the reservoir area. Consequently, the sedimentation adjustment process in the reservoir area could not be fully understood. To date, only Tang et al. (2019) have established a simplified delayed response model of sedimentation by considering the sediment inflow and water level before dam construction and then discussed the preliminarily delayed response behaviour of sediment deposition in the TGR. However, the constructed model, which does not consider the water conditions, sediment particle size or variations in the channel adjustment rate, cannot completely reflect and simulate the sedimentation process in reservoirs. Moreover, the successive construction and operation of the Xiangjiaba and Xiluodu Reservoirs have changed the water and sediment conditions in the TGR (Zhu et al., 2017; Yuan and Xu, 2018; Lu et al., 2019), which in turn have affected the sedimentation characteristics and potentially influenced the sedimentation delayed response behaviour. It is unknown how and why the delayed response behaviour of the TGR changed after the impoundment of the cascade reservoirs. The delayed response phenomenon is one of the key factors associated with the reservoir siltation process; if this phenomenon is ignored, it is impossible to fully grasp the process and intrinsic behaviour of reservoir siltation. To ensure the long-term use of the TGR, it is necessary and important to gain an in-depth understanding of the reservoir sedimentation and section morphology adjustment processes in terms of delayed response behaviours.
In this study, the TGR region was selected as the study area, and the focus of this study was sediment deposition and cross-sectional morphology in the TGR area. To quantitatively study the delayed response behaviour of sedimentation in the TGR, understand the adjustment process of sedimentation in the reservoir area and then obtain the detailed sedimentation trend in the TGR, the following objectives are explored in this paper: (1) Through analyses of water and sediment conditions, adjustments in sedimentation and section morphology in the TGR before and after the impoundment of the cascade reservoirs, and theoretical derivation, we optimize the existing reservoir sedimentation delayed response model and establish a delayed response model between the section morphology and the water and sediment conditions. (2) Based on the above models, we analyse the reasons for the changes in the delayed response of sediment accumulation in the TGR before and after the impoundment of the cascade reservoirs and then quantify the influence of the previous hydrological conditions on sediment accumulation in the reservoir area. (3) Based on the above two models, the impact of cascade reservoir impoundment on the sedimentation process and the section morphology adjustment process in the TGR are evaluated, and the causes of this impact are analysed.

2 Study area

The Yangtze River is the largest river in China, with a total length of 6300 km, and it is usually divided into upper, middle and lower reaches based on the Yichang and Hukou hydrological stations. The upper Yangtze River is approximately 4540 km long, and its drainage area is approximately 100 million km2, accounting for 55% of the total Yangtze River basin. In the upper Yangtze River, many tributaries exist, including the Yalong River, Minjiang River, Jialing River, Wujiang River and many other small rivers. The Three Gorges Dam, one of largest dams in the world, with a reservoir storage capacity of 3.93×10¹⁰ m3, is located on the mainstream of the upper Yangtze River, approximately 38 km upstream of Yichang station, as shown in Figure 1. In recent years, four dams and the associated cascade reservoirs have been constructed on the lower Jinsha River to achieve better utilization of water and hydropower resources. From upstream to downstream, these dams include the Wudongde, Baihetan, Xiluodu and Xiangjiaba dams. The Xiangjiaba dam started to impound water in October 2012 (Li et al., 2011); after that, the sediment load transported into the TGR decreased sharply. The annual inflowing suspended sediment load was 2.03×10⁸ t/a from 2003 to 2012, and this total decreased by approximately 70% after 2013. The decrease in the suspended sediment load has influenced the sediment deposition process in the TGR.
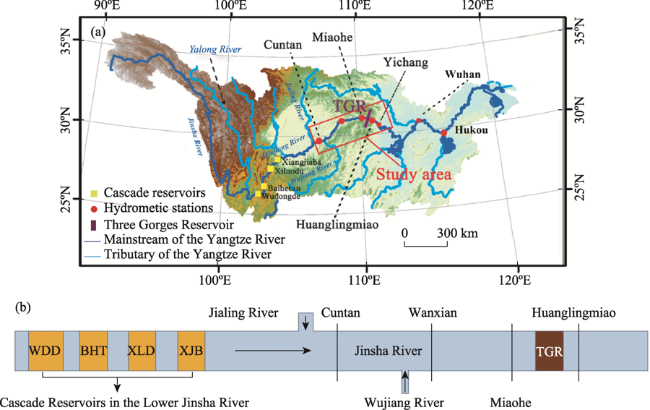
Figure 1 Map of the study area: (a) The Three Gorges Reservoir and the cascade reservoirs on the Lower Jinsha River; (b) A graphic showing the relative positions of the tributaries, dams and hydrological stations (WDD, BHT, XLD and XJB denote Wudongde, Baihetan, Xiluodu and Xiangjiaba, respectively)

3 Data and methods

3.1 Data

The water and sediment entering the TGR come mainly from the mainstream of the upper Yangtze River and its tributaries. Since the TGR began to impound water in 2003, human activities, such as upstream soil and water conservation, have resulted in reduced sediment inflows and a slight decrease in runoff (Wang et al., 2016). The impoundment of the cascade reservoirs on the lower Jinsha River has resulted in further interception of sediment in the upper reaches, and the amount of sediment entering the TGR has decreased by 70% (Li et al., 2011; Lu et al., 2019). To further study the changes in water and sediment conditions and the changes in scouring and deposition in the TGR, several typical hydrological stations maintained by the Changjiang Water Resources Commission (CWRC) were selected for study. The incoming water and sediment from the Yangtze River and the main tributaries (including the Jialing River) flow past Cuntan station and then into the TGR, so Cuntan station was selected as the representative station for assessing the amount of water and sediment entering the TGR. Miaohe station is close to the upstream side of the dam, and the water level at Miaohe station is used as the water level in front of the dam. The Huanglingmiao station is the first hydrological station downstream of the dam, so it was selected to calculate the material exiting the reservoir. To study the effect of the cascade reservoirs on the delayed response of sedimentation, the study period was divided into 2003-2012 and 2013-2020 subperiods. The selected measured data are shown in Table 1.
Table 1 Data and uses
Data type Station Period Main uses
Daily discharge and sediment
concentration
Cuntan and Huanglingmiao 2003-2020 Analysis of the characteristics of incoming water and sediment;
Analysis of sedimentation characteristics
Actual topographical information
in the reservoir area
- 2003-2018 Analysis of the morphological adjustment
pattern in the reservoir area
Daily discharge, sediment concentration and sediment particle size Cuntan 2003-2020 Study of the delayed response behaviour of sedimentation and morphological adjustment during the flood season
Daily average water level Miaohe 2003-2020
Topographical information in the reservoir area - 2003-2018

Note: The data in Table 1 are daily measurements and are provided by the CWRC.

3.2 Methods

3.2.1 Sediment discharge method

The sediment discharge method, also known as the sediment transport method or sediment balance method, mainly uses the measured amount of transported sediment, the sediment input and output measured at two hydrological stations in the upper and lower reaches of a river section and the law of conservation of mass to calculate the difference between the input sediment amount and the output sediment amount to estimate the amount of erosion or in the river section (Dai and Lu, 2014; Yang et al., 2018).
From 2003-2020, the incoming sediment from the Wujiang River accounted for 5.6% of the incoming sediment in the TGR. In the flood season, the proportion of sediment from the Wujiang River was even smaller. When calculating the sediment deposition in the entire TGR and each interval of the TGR, the incoming sediment from the Wujiang River can be neglected for simplicity. Therefore, the sediment deposition in the TGR was obtained by subtracting the sediment observed at Huanglingmiao station from that observed at Cuntan station. The sediment deposition in each interval of the TGR was the difference in the amount of sediment at each pair of adjacent hydrological stations.

3.2.2 Methods for assessing the changes in sedimentation and thalweg elevation in a typical cross-section

The delayed response model was proposed based on the automatic adjustment of the riverbed. It is assumed that the adjustment variation dy/dt in a characteristic variable y of the riverbed after an external disturbance is proportional to the difference between the current state y of the variable and the equilibrium state ye (Wu, 2008a). This process of riverbed evolution to a new equilibrium state after a disturbance can be described by the following equation (Graf, 1977; Wu, 2008b):
${dy}/{dt}\;\text{=}\beta (yey)$
where y and ye are the actual value of the characteristic variable at a given moment and the equilibrium value of its trend, respectively. β is the characteristic parameter of the rate of adjustment of riverbed evolution, which indicates the speed of the adjustment process. The basic theoretical delayed response model can be obtained by transforming the general solution, which is shown in Eqs. (2) and (3) (Wu et al., 2012).
The single-step analytical model:
$y={{y}_{0}}{{e}^{-\beta t}}+(1-{{e}^{-\beta t}}){{y}_{e}}$
The multistep analytical model:
${{y}_{n}}=(1-{{e}^{(-\beta \Delta t)}})\sum\limits_{\text{i=}1}^{\text{n}}{({{e}^{-\left( n-i \right)\beta \Delta t}}){{y}_{{{e}_{i}}}}\text{ }}+{{e}^{(-n\beta \Delta t)}}{{y}_{{{e}_{0}}}}\text{ }$
Based on Eqs. (2) and (3) above, the single-step analytical model considers the measured eigenvalue, which is dependent on the measured values and requires various conditions. Therefore, the simulation results obtained with the single-step model are better than those of the multistep iterative model. However, unlike the single-step analytical model, the multistep iterative model does not need to consider the initial values of the simulation variables in each period, so it has advantages in prediction and scenario analysis. Therefore, the multistep iterative model is selected in this study to construct the sediment deposition delayed response model, which is subsequently applied in analyses.
In Eq. (3), yn is the characteristic variable after the nth time step. Note that the equilibrium state is constantly changing with external disturbance changes, but it is difficult to observe this state because of the delayed response of the river evolution process. Therefore, the key to the modelling process is to determine the equilibrium values of the characteristic variables (Wu et al., 2012). This research focuses on sedimentation and the elevation of the thalweg point in a typical cross-section, so the construction methods for feature variables are different for different research objects, which are introduced separately below.
(i) Sedimentation
1) The existing model for sedimentation
Some researchers have proposed delayed response models for siltation in reservoir areas in studies of deposition in reservoirs, such as Sanmenxia Reservoir (Wu, 2008c; Wu and You, 2008). In this model, Wu et al. (2006) assumes that for reservoirs, when the area is long and large, even the variation in the water level in front of the dam in a reservoir area is large, while the variation in the water level further upstream is relatively small and can be regarded as constant, so the flow power γQJ is mainly related to QZd. The general expression QaZd can be used, and the flow-weighted average dam water level can be obtained. According to previous research results (Wu et al., 2006; Wu and You, 2008), the best result is obtained when a is 1.5. The formulas for balanced siltation in a reservoir area are shown in Eqs. (4) and (5).
${{V}_{\text{e}}}=K\bar{Z}_{\text{d}}^{\text{b}}+{{V}_{*}}$
${{\bar{Z}}_{d}}={{{\sum{\left( \frac{{{Q}_{\text{in}}}+{{Q}_{\text{out}}}}{2} \right)}}^{1.5}}{{Z}_{d}}}/{{{\sum{\left( \frac{{{Q}_{\text{in}}}+{{Q}_{\text{out}}}}{2} \right)}}^{1.5}}}\;$
where Ve and V* are the balanced sediment deposition and silting parameters, respectively (104 t); Qin and Qout are the flow discharges into and out of the TGR, respectively (m/s);$\bar{Z}$d and Zd are the flow-weighted average dam water level and daily average dam water level, respectively (m); and K is a coefficient. By introducing Eq. (4) and Eq. (5) into the multistep recursive model, Eq. (6), representing the delayed response model of sediment deposition in the reservoir area based on the flow-weighted average water level in front of the dam, can be obtained.
${{V}_{\text{n}}}=(1-{{\text{e}}^{(-\beta \Delta t)}})\sum\limits_{i=1}^{n}{({{\text{e}}^{-\left( n-i \right)\beta \Delta t}}\bar{Z}_{{{d}_{i}}}^{b})\text{ }}+K{{\text{e}}^{(-n\beta \Delta t)}}\bar{Z}_{{{d}_{0}}}^{b}+{{V}_{*}}$
where Vn is the accumulated sediment siltation in the reservoir area in the nth year. Eq. (6) is used to simulate the sedimentation process in the TGR, and the following parameters are obtained, as shown in Table 2.
Table 2 Values of the parameters in Eq. (6) for two time series
Period Parameters R2 MNE (%)
N K b β V*
2003-2012 4 8361 1.0 0.16 -1.1×10⁶ 0.97 5.33
2013-2020 3 1284 0.7 0.88 -3055 0.31 26.35
Table 2 shows that Eq. (6) yields good results for the simulated sediment accumulation and sedimentation process in the TGR before the impoundment of the cascade reservoirs (R2=0.97). After the impoundment of the cascade reservoirs, the inflow and sediment conditions in the TGR changed, leading to changes in the correlation between incoming water and sediment (R2: 0.7869-0.6138). Thus, using only changes in the inflowing flow cannot reflect the changes in the inflowing sediment. The simulation results for sediment deposition in the TGR after the impoundment of the cascade reservoirs are poor (R2=0.31). Thus, it is necessary to modify the delayed response model considering the sediment deposition characteristics of the TGR.
2) The optimized delayed response model for sedimentation
According to the statistics obtained based on water and sediment conditions, after the impoundment of the cascade reservoirs in the lower reaches of the Jinsha River, the incoming discharge and the sediment concentration in the reservoir decreased throughout the whole flood season, but the incoming sediment became more concentrated in the flood season. The influence of the changes in water and sediment conditions on the sediment deposition in the reservoir area cannot be ignored, and the effects of sediment gradation, water depth and river boundary conditions on sediment scouring and deposition in the reservoir area should also be considered. The formula for determining the sediment carrying capacity of a flow, as proposed by Zhang, can be expressed as follows (Yuan et al., 2012):
${{S}_{*}}=K{{\left( \frac{{{U}^{3}}}{gR\omega } \right)}^{m}}$
where U is the average current velocity (m/s), and R is the hydraulic radius (m). For example, taking a rectangular river section as an example, A is the river cross-sectional area (m2); Q is the flow (m3/s); and H0 is the water depth (m). Therefore, U=Q/A, and A=B·H0, R=B·H0/ (2H0+B)=αH0. Additionally, K is a coefficient (kg/m3); m is the index of the sediment carrying capacity; and ω is the settling velocity of the sediment (m/s). When the particle size of the sediment d<0.15 mm, the Concharov formula can be used (Cheng, 1997): $\omega =\frac{1}{24}\left( \frac{\gamma s-\gamma }{\gamma } \right)g\frac{{{d}^{2}}}{v}$. Substituting the above parameters into Eq. (7) yields the following formula:
${{S}_{*}}=K{{\left( \frac{{{Q}^{3}}}{\alpha g{{B}^{3}}H_{0}^{4}\omega } \right)}^{m}}=K{{\left( \frac{24\gamma \upsilon }{\alpha (\gamma s-\gamma ){{g}^{2}}}\frac{{{Q}^{3}}}{{{B}^{3}}H_{0}^{4}{{d}^{2}}} \right)}^{m}}$
According to Eq. (8), the sediment carrying capacity of water S* is related to Q3/B3H04d2. For the TGR, the average width of the reservoir area in the flood season basically remains unchanged, so B is treated as a constant, which means that the sediment carrying capacity in the TGR is mainly related to Q3/H04d2. Recall that F=Q3/H04d2, where F is defined as the sediment carrying strength, which approximately reflects the sediment carrying capacity of water, and H0 is the average water depth in the reservoir area (m). In this paper, the average dam water level H is multiplied by the coefficient L to replace the average water depth in the simulation calculation, so 0<L<1.
When the water and sediment conditions and water level in the TGR remain unchanged, after a long period of scouring and silting adjustment, a characteristic sediment deposition pattern in the reservoir area corresponding to the water and sediment conditions will eventually develop. At this time, sediment scouring and silting will achieve an equilibrium state, and the amount of sediment deposition reaches a balanced state in the TGR. Therefore, for different water and sediment conditions and water levels in front of the dam, the corresponding balanced sediment deposition state will vary. The ratio of the sediment carrying capacity F to the sediment concentration S is chosen to approximate the relationship between the current sediment carrying capacity and the average sediment concentration in the flood season and reflect the scouring and silting process in the river channel. Therefore, the balanced sediment deposition state in the TGR can be defined as follows:
${{V}_{e}}=K\frac{{{S}^{b}}}{{{({{{Q}^{3}}}/{H_{0}^{4}{{d}^{2}}}\;)}^{\alpha }}}=K{{Q}^{A}}{{S}^{B}}{{d}^{C}}{{(LH)}^{M}}$
where Ve is the balanced sediment deposition amount (104 t); K, A, B, C, L and M are coefficients, where A<0, B>0, C>0, and M>0; Q is the average runoff in the flood season (m/s); S is the average sediment concentration in the flood season (kg/m3); d is the particle size of sediment in the flood season (mm); and H is the average water level in front of the dam in the flood season (m).
The adjustment parameter β in the delayed response model reflects the potential adjustment of the river channel at a given moment, and the rate of adjustment is related to the characteristics of the riverbed itself and the upstream water and sediment conditions, which change with time (Wu, 2008b; Sear et al., 2010; Wu et al., 2012). However, in previous studies of the delayed response of sedimentation, the parameter β was usually set as a constant or expressed as a function of the average discharge in the flood season, ignoring the influence of incoming sediment on the river course adjustment rate (Wu, 2008b; Li and Wu, 2011b). Therefore, to further reflect riverbed mobility and the relationship among the upstream inflow, the sediment discharge process and the river adjustment rate, the adjustment parameter β is set based on the following formula:
${{\beta }_{i}}={{\beta }_{t}}q_{i}^{{{m}_{0}}}s_{i}^{{{n}_{0}}}={{\beta }_{t}}{{\left( \frac{{{Q}_{fi}}}{{{Q}_{i}}} \right)}^{{{m}_{0}}}}{{\left( \frac{{{S}_{fi}}}{{{S}_{i}}} \right)}^{{{n}_{0}}}}$
where Qfi is the average discharge in the flood season (m3/s); Qi is the annual average discharge (m3/s); Sfi is the average sediment concentration in the flood season (kg/m3); Si is the annual average sediment concentration (kg/m3); βt is a constant; and m0 and n0 are exponents, which are determined from measured data. By substituting Eqs. (9) and (10) into the multistep analytical mode, the formula used in the delayed response model of sediment deposition in the TGR can be obtained:
${{V}_{n}}=(1-{{\text{e}}^{(-{{\beta }_{n}}\Delta t)}}){{V}_{en}}+\sum\limits_{i=0}^{n-1}{(1-{{\text{e}}^{-{{\beta }_{i}}\Delta t}}){{\text{e}}^{-({{\beta }_{i+1}}+{{\beta }_{i+2}}+.....+{{\beta }_{n}})\Delta t}}}{{V}_{ei}}$
where Vn is the accumulated sediment siltation in the reservoir area in the nth year (104 t). Eq. (11) represents the delayed response model of sedimentation in the TGR, and it considers the early influence and delayed response through an iterative process. Thus, the synergistic effects of the water level in front of the dam and the water-sediment conditions on the cumulative sedimentation in the reservoir can be determined.
(ii) Delayed model of the thalweg elevation at a typical cross-section
For a typical section, the change in thalweg elevation is closely related to riverbed deposition and scouring (Zheng et al., 2014b; Lyu et al., 2020). Similar to the delayed response process for sediment scouring and deposition, changes in thalweg elevation also exhibit a delayed response. Research on the delayed response behaviour of the elevation at a deep alluvial point can be used to explain the delayed response phenomenon of sediment deposition to a certain extent. The riverbed elevation is usually influenced by the channel gradient, which reflects the energy required to transport sediment. Therefore, the equilibrium value of the channel elevation or the depth elevation is closely related to the channel gradient equilibrium value.
For the equilibrium gradient of riverbed Je in the reservoir area, according to the hydraulic geometry of the river (Hey and Thorne, 1986), the equilibrium gradient of Je can be expressed by Eq. (12):
${{J}_{e}}=K{{Q}^{a}}{{S}^{b}}{{d}^{c}}$
where Q is the flow discharge (m3/s); S is the sediment concentration (kg/m3); and the equilibrium gradient of riverbed Je is determined considering the effects of flow, sediment concentration and particle size.
A balanced state in Eq. (12) can be regarded as a balance in the depth elevation in a typical section; therefore, according to the mathematical definition of the channel gradient, the following equation can be obtained:
$\frac{{{Z}_{e}}-{{Z}_{*}}}{\Delta L}=K{{Q}^{a}}{{S}^{b}}{{d}^{c}}$
where Ze is the balance-state elevation of the talweg (m); Z* is the talweg elevation at a reference point (m); and △L is the longitudinal distance between the section talweg point and the reference point (m). Eq. (13) can be rewritten as follows:
${{Z}_{e}}=K{{Q}^{a}}{{S}^{b}}{{d}^{c}}+{{Z}_{*}}$
Where$K=k\Delta L$. By substituting Eq. (14) into the multistep analytical model, the formula for the elevation delayed response model of the depth of a typical section in the TGR can be obtained, as shown in Eq. (15), where K, a, b, c, β and Z* are the parameters to be calibrated.
${{Z}_{n}}=(1-{{\text{e}}^{-\beta \Delta t}})\underset{i=1}{\overset{n}{\mathop \sum }}\,\left( {{\text{e}}^{-(n-i)\beta \Delta t}}\left( KQ_{i}^{a}S_{i}^{b}d_{i}^{c}+{{Z}_{*}} \right) \right)+{{\text{e}}^{-n\beta \Delta t}}{{Z}_{0}}$
where Zn is the elevation of the thalweg in the nth period (m). Examples of the use of this model can be found in previously published articles, which have described this process in detail (Zheng et al., 2014b). In this paper, to assess the simulation accuracy of the model, we chose Eqs. (16) and (17) to calculate the accuracy (R2) and the mean normalized error (MNE) between the calculated and measured values.
${{R}^{2}}\text{=}\frac{{{\left( N\sum\limits_{i=1}^{N}{{{f}_{mi}}{{f}_{ci}}\sum\limits_{i=1}^{N}{{{f}_{mi}}\sum\limits_{i=1}^{N}{{{f}_{ci}}}}} \right)}^{2}}}{\left[ N\sum\limits_{i=1}^{N}{{{f}_{mi}}^{2}}{{\left( \sum\limits_{i=1}^{N}{{{f}_{mi}}} \right)}^{2}} \right]\left[ N\sum\limits_{i=1}^{N}{{{f}_{ci}}^{2}}{{\left( \sum\limits_{i=1}^{N}{{{f}_{ci}}} \right)}^{2}} \right]}$
$MNE=\frac{1}{N}\sum\limits_{i=1}^{N}{\left| \frac{{{f}_{ci}}-{{f}_{mi}}}{{{f}_{mi}}} \right|}\times 100%$
where N is the total number of time series and fci and fmi are the calculated and measured values in the ith year, respectively (Zheng et al., 2014b).

4 Results

4.1 Variations in flow-sediment regimes and changes in riverbed erosion and deposition

The annual runoff and sediment discharge at Cuntan station from 2003-2020 are shown in Figure 2a. The sediment entering the TGR decreased by 70% due to the impoundment of the Xiangjiaba Reservoir in 2013. In the flood season, the incoming water flux (Q) and the suspended sediment concentration (SSC) in the TGR decreased by 8% and 67%, respectively, as shown in Figure 2b. Moreover, the fluctuation ranges of Q and SSC also decreased (Q fluctuation range: 47,040-32,158 m3/s; SSC fluctuation range: 2.65-1.47 kg/m3). After the impoundment of the cascade reservoirs, the sources of the water and sediment entering the TGR changed greatly, and the source of sediment changed from the Jinsha River to other tributaries (Zhou et al., 2020). Therefore, the relationship between water and sediment in the TGR changed (R2: 0.7869-0.6138), and the incoming water and sediment no longer exhibited a strong positive correlation, as shown in Figure 2c. After the impoundment of the cascade reservoirs along the lower Jinsha River, the sediment input into the TGR became more concentrated in the flood season, and the proportion of incoming sediment in the flood season increased from 89.97% to 91.87%, while the proportion of incoming flow in the flood season decreased from 60.90% to 57.83%, as shown in Figure 2d.
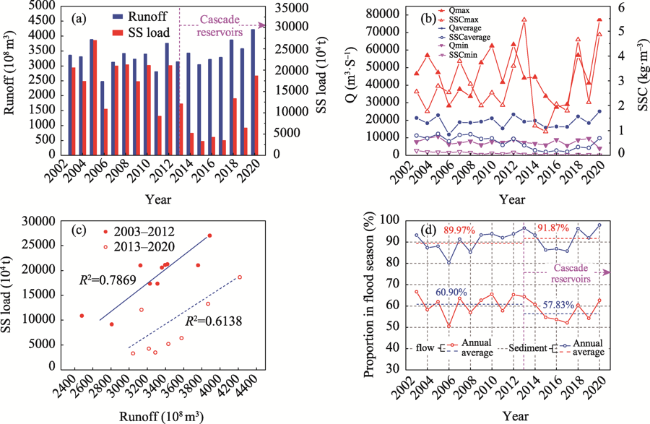
Figure 2 The water and sediment conditions of the hydrological inputs of the Three Gorges Reservoir from 2003 to 2020: (a) runoff and sediment discharge at Cuntan station, (b) flow and sediment concentration at Cuntan station in the flood season, (c) the linear relationship between the water and sediment, and (d) the proportions of flow and suspended sediment discharge in the flood season relative to those in the whole year at Cuntan station
As shown in Figure 3, after the impoundment of the cascade reservoirs, the decrease in incoming sediment in the TGR has reduced sediment deposition in the TGR by 60% since 2013. The annual and flood season sediment deposition both decreased by 62.3%, thereby also reducing the cumulative deposition rate in the TGR, while the proportion of sediment deposition in the flood season increased by approximately 4.43% (87.70%- 92.13%).
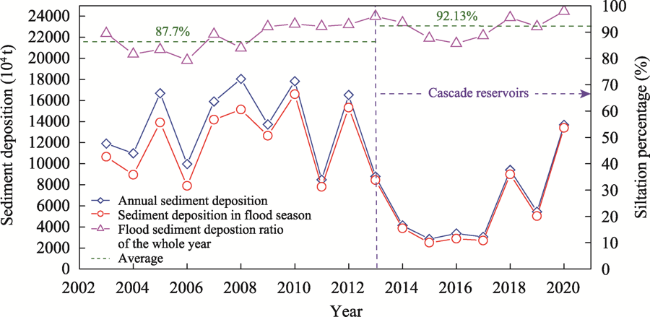
Figure 3 Sedimentation throughout the whole year and in the flood season and the proportion in the flood season
In addition, to consider cross-section variations, the scouring and silting of the riverbed are reflected in the adjustment of the section shape. Since the TGR was firstly impounded, sediment deposition has not been uniform (Hu et al., 2013; Li et al., 2015). Through a statistical analysis of the thalweg change in the reservoir area, it can be found that the distribution of sediment deposition in the TGR is uneven (Figure 4).
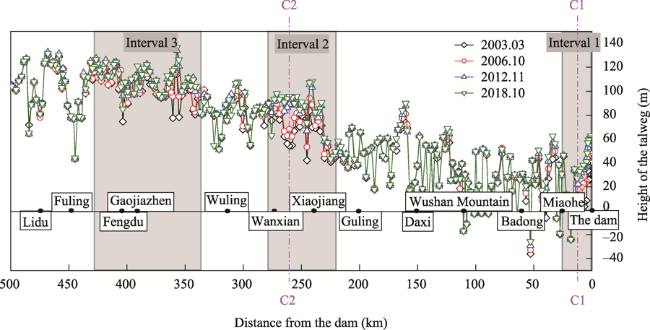
Figure 4 Change in the thalweg in the Three Gorges Reservoir from 2003 to 2018
To analyse the changes in riverbed shape after the impoundment of the TGR, a typical section is selected. As shown in Figure 4, due to the heterogeneous distribution of sedimentation in the TGR, the variation in the thalweg in the reservoir area is not uniform, and the changes in the thalweg are mainly concentrated in three areas (predam interval 1, middle Wanxian station interval 2, and interval 3 from Gaojia town to Wuling). Interval 3 is located in a fluctuating backwater zone, which changed in type from siltation to scouring after cascade reservoir impoundment (Zhang et al., 2009); consequently, this area does not reflect the sedimentation behaviour of the TGR. Therefore, intervals 1 and 2 are selected as typical intervals. The typical section shown in Figure 4 is selected for further study. Sections C1 and C2 are selected as typical sections for statistical analysis. After the impoundment of the cascade reservoirs, the rate of change in thalweg elevation decreased due to the reduction in the incoming sediment.
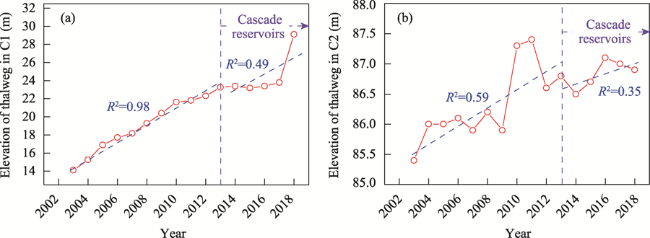
Figure 5 The thalweg change process at cross-section C1 (a) and at cross-section C2 (b)

4.2 Simulation of sedimentation in the TGR

Eq. (11) is used to fit the processes of sediment accumulation and deposition in the TGR. Considering that the water and sediment conditions of the TGR exhibited notable changes before and after the impoundment of the cascade reservoirs, the accuracy of a given calculated parameter over the whole sediment accumulation and deposition process may be low. Therefore, to improve the simulation accuracy of the model and analyse the influence of cascade reservoir impoundment on the sediment deposition characteristics and delayed response behaviour of the TGR, the measured data were divided into two periods (2003-2012 and 2013-2020) for fitting. The parameters obtained by fitting are shown in Table 3. These parameters were input into Eq. (11) to obtain the corresponding characteristic quantities. By comparing the calculated and measured values, the R2 and MNE of the model in different early influential years N were obtained, and the results are shown in Figure 6.
Table 3 Values of the parameters in Eq. (11) and R2
Year Parameters R2 MNE (%)
N K A B C L M m0 n0 βt
2003-2012 4 0.25 -0.13 0.25 0.01 0.02 12.46 -3.79 0.05 3.171 0.99 6.32
2013-2020 2 0.92 -0.01 0.11 0.01 0.02 10.12 -0.06 4.50 0.022 0.97 1.24
2003-2020 4 2.00 -0.10 0.11 0.01 0.34 8.97 -0.02 4.25 0.003 0.99 7.73
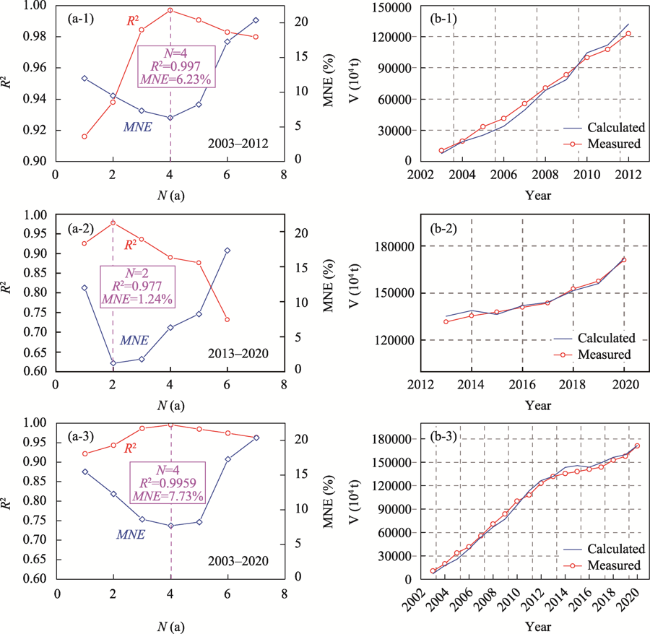
Figure 6 Simulation results of the delayed response model for sedimentation from 2003-2012, 2013-2020 and 2003-2020: (a) variations in R2 and MNE with increasing values of N; (b) the measured and calculated V values
According to the rate of adjustment of alluvial river channels, it can be found that the rate of change of the natural adjustment of river channels is much slower than the rate of change in water and sediment conditions; therefore, it usually takes a long time for a river channel to reach a new equilibrium state after an external disturbance (Wu, 2008b; Wu et al., 2012), and the same is true for the delayed response to sediment deposition. Sediment deposition and accumulation are processes with relatively long lag periods, so the delayed response trend in a current period is not fully reflected if the current period of impact for year N is small. If the current period of impact year N is too large, the influence of additional years on the delayed response of the current riverbed evolution process may eventually become negligible. Therefore, the value of N, for which the calculation accuracy R2 is maximized or the MNE is minimized, is the number of years over which the accumulated sediment is most affected by the previous water and sediment conditions (the actual number of years involved is N+1 years). According to the calculation accuracy of the model, the early influence year N was selected as the delayed response year (Wu et al., 2012; Zheng et al., 2014b).
A comparison of the results presented in Table 2, Table 3 and Figure 6 reveals that the optimized model can effectively simulate the accumulative sediment deposition process in the TGR, especially for the period after the impoundment of the cascade reservoirs. The calculation precision is increased greatly by using the optimized model for simulation (R2: 0.31-0.99). For the periods from 2003 to 2012 and 2013 to 2020, the optimized model simulation was the best when N=4 and N=2, respectively. Therefore, the delayed response time of sediment deposition in the TGR shortened from the previous 5 years (N=4) to the previous 3 years (N=2) after cascade reservoirs impoundment.

4.3 Simulation of the thalweg point elevation in a typical section of the TGR

Eq. (15) is the thalweg elevation delayed response model for a typical section in the TGR. According to the measured data, the depth elevation of typical sections in the TGR from 2003 to 2018 was calculated as the characteristic variable Zn in the model. Changes in depth are affected more by factors such as section shape than by sediment deposition (Madej, 1999; Bartley and Rutherfurd, 2002). Therefore, the period from 2003 to 2018 is selected as the research period. The parameters used to fit the two sections are shown in Table 4.
Table 4 The parameters and calculation accuracy (R2) for Eq. (15)
Cross-section Parameters R2 MNE (%)
N K A B C Z* β
C1 4 101.33 -0.21 0.65 0.51 25.32 0.51 0.88 4.99
C2 4 161.16 -0.04 0.01 0.07 11.42 5.84 0.59 0.31
By using the same judgement method as applied in 4.2, N, for which the calculation accuracy R2 is maximized or MNE is minimized, is defined as the number of years over which the elevation of the depth point in a typical section is most affected by the previous water and sediment conditions. The calculation results are shown in Figure 7.
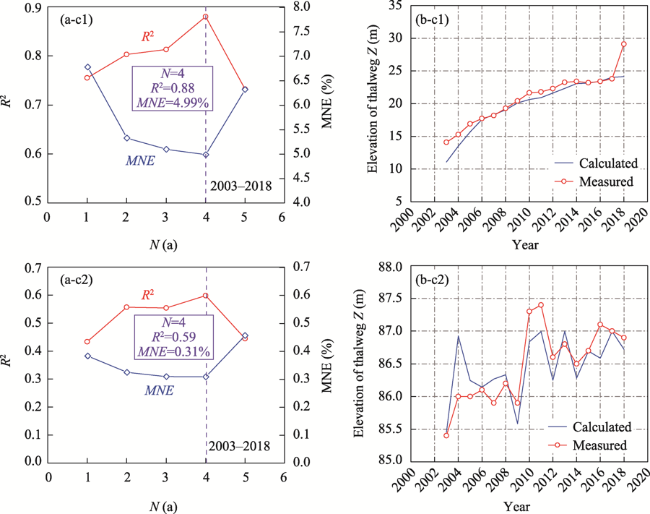
Figure 7 Simulation results of the delayed response model for the thalweg elevation from 2003-2018: (a) variations in R2 and MNE with increasing values of N; (b) the measured and calculated Z values
According to Figure 7, the delayed response model of the thalweg point elevation in a typical section can fit the variations in the thalweg elevations in cross-sections C1 and C2. After the impoundment of the TGR, the delayed response time of the typical cross-section thalweg elevation is N=4 (the previous 5 years).
The change in elevation at the section depth point is mainly related to changes in sediment scouring and deposition. Changes in sediment scouring and deposition directly influence variations in thalweg elevation. Therefore, in response to changes in water and sediment conditions and external factors, a change in elevation at a section depth point is caused by the long-term influence of sediment deposition. The results in section 4.2 show that the delayed response time N of sediment deposition before and after reservoir impoundment is 3-5 years, while that of the thalweg elevation in a typical section is 5 years. The delayed response relationships between these two factors and the water-sediment process are basically the same.

5 Discussion

The delayed response times of sedimentation in the TGR shortened after the impoundment of the cascade reservoirs. In this section, we analyse the change in the delayed response behaviour, use the model to quantify the percentage impact of each year in the previous period, and further analyse the impact of cascade reservoir impoundment in the TGR on sedimentation.

5.1 Reason for the change in the delayed response time

In a river channel system, the more severe the disturbance in the external control condition is, the longer the time required for the whole river system to absorb the external disturbance through automatic adjustment will be and the slower the automatic adjustment rate of the river will be, which suggests that the delayed response time will become longer (Wu, 2008a, b; Wu et al., 2012). Therefore, we explain the reduction in the delayed response time based on a combination of both the intensity of external disturbances and the rate of river adjustment.
In terms of the influence of an external disturbance, for the channel system of the TGR, the external control conditions (incoming water and sediment) are constantly changing under the influence of upstream rainfall and human activities (Xu and Tong, 2012; Wang et al., 2016; Yang et al., 2018; Lu et al., 2019). After the impoundment of the cascade reservoirs, the variation range of the inflowing water and sediment into the TGR decreased (the fluctuation range of the discharge in the flood season: 47,040-32,158.3 m3/s, and the fluctuation range of the sediment concentration in the flood season: 2.65-1.47 kg/m3), the variations in incoming water and sediment weakened, the external control condition (incoming water and sediment) tended to be relatively stable, and the delayed response time of sediment deposition in the whole reservoir area shortened.
From the perspective of the river course adjustment rate, theoretically speaking, after a river system is externally disturbed, the faster the river course adjustment rate is, the less time it takes to eliminate the influence of external interference (Wu, 2008b; Wu et al., 2012). The delayed response model quantifies the rate of river adjustment, and the parameter β reflects the adjustment capacity of the river at a certain moment. Previous studies have found that the adjustment rate β is related to the degree of concentration of incoming water and sediment in the flood season relative to the annual incoming water and sediment (Li and Wu, 2011b; Lyu et al., 2018a). During the flood season, the smaller the incoming flow is, the greater the sediment content, or the more concentrated the incoming sediment is, the greater the difference between the sediment content and the flow carrying capacity is, and the greater the adjustment rate is (Lyu et al., 2018a). After the impoundment of the cascade reservoirs, the sediment became more concentrated in the flood season, while the incoming flow in the flood season decreased; thus, the adjustment rate of sediment deposition became larger (β: 0.0159-0.0216), as shown in Figure 8. The channel adjustment time scale decreased, and the delayed response time of the sedimentation shortened.
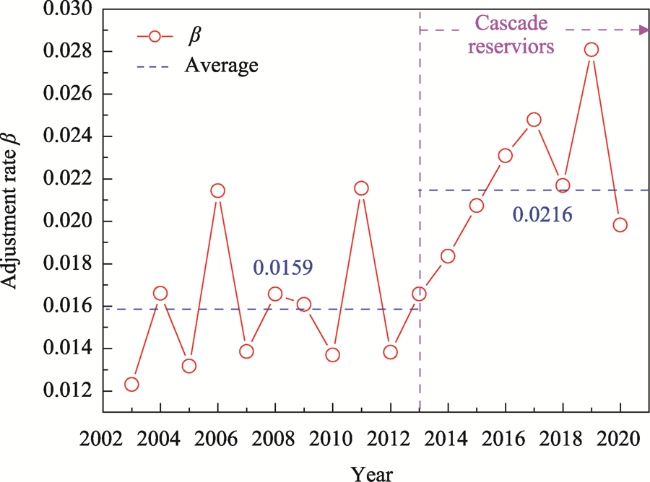
Figure 8 Adjustment rate β
Based on the above findings, it can be concluded that after the impoundment of the cascade reservoirs, the changes in the water and sediment conditions (the decreased variations in the incoming flow discharge and sediment concentration and the increase in the sediment concentration in the flood season) caused the adjustment rate of sediment deposition in the flood season to increase, and the delayed response period of sediment deposition was shortened from the previous 5 years to the previous 3 years.

5.2 Influence of different hydrological conditions in previous years on sedimentation

Numerous studies have proposed that the delayed response is a common and important characteristic of nonequilibrium morphological evolution (Wu et al., 2012; Zheng et al., 2015). Nevertheless, quantifying the impacts of previous conditions in a physical sense is still a difficult problem.
According to the comparison of the simulation results (Figure 6), in the period 2003-2012, the calculated values are much more accurate when the flow and sediment conditions in the previous five years (N=4) are considered than when only the current (N=0) conditions are considered. In the period 2013-2020, similar results can be obtained for N=2. To quantify the influence of the previous conditions, Eq. (8) can be expressed as follows: when N=2, V2=(1-e(-β2)) Ve2 +(1-e-β0)e-(β1)Ve0+(1-e-β2)e-(β1+β2)Ve1. According to the above equation, the percentage impacts of hydrological conditions can be quantified each year; for example, the impact of the current year can be expressed as (1-e(-β2)) Ve2/V2, and other impact years can be expressed in the same way. The impacts of different years are quantified as shown in Table 5.
Table 5 Impacts of different hydrological conditions in previous years on sediment in the TGR
Year Percentage influence on sedimentation (%)
Current
year
Previous
one year
Previous
two years
Previous
three years
Previous
four years
Impact of previous
periods
2007 48.00 31.95 8.94 8.00 3.11 52.00
2008 53.27 23.15 15.41 4.31 3.86 46.73
2009 37.39 34.69 15.08 10.04 2.81 62.61
2010 42.82 22.00 20.41 8.87 5.91 57.18
2011 40.96 26.86 13.80 12.81 5.57 59.04
2012 37.47 27.12 17.79 9.14 8.48 62.53
Average 43.32 27.63 15.24 8.86 4.95 56.68
2015 35.49 38.01 26.49 64.51
2016 36.22 30.79 32.98 63.78
2017 40.82 31.99 27.19 59.18
2018 37.04 35.30 27.66 62.96
2019 39.02 31.77 30.28 62.05
2020 41.13 32.44 26.42 58.87
Average 37.78 32.85 29.50 62.35
For the period 2003-2012, the average percentage impacts of the current year and the previous year to previous four years are 43%, 27%, 15%, 8% and 5%, respectively. For the period 2013-2020, the average percentage impacts of the current year and the previous year to previous two years are 38%, 32% and 29%, respectively (Table 5). In addition, for some particular years, such as 2008 and 2017, the impacts are the largest in the 2003-2012 and 2013-2020 intervals. Notably, 2008 and 2017 are the year with the largest average sediment contents in the 2003-2012 period and the year with the smallest average sediment content in the 2013-2020 period, respectively (Figure 2b); a sudden decrease or increase in sediment will naturally have a considerable impact on sedimentation, and this effect will remain over time.
Overall, the previous influence is a nonnegligible part of the sedimentation process in the TGR area, and the cumulative previous influence can be as high as 60%. Moreover, the closer to the current year, the greater the proportion of the previous impact, which is in line with the general understanding of riverbed evolution. Certain years with large changes in water and sediment conditions most influence the conditions in the current year, and this influence lasts for a certain period of time.

5.3 Impact of changes in water-sediment conditions and water level on sedimentation and thalweg elevation in the TGR

The impoundment of the cascade reservoirs changed the inflowing water and sediment conditions in the TGR, which affected reservoir sedimentation and consequently the streambed morphology adjustment process (Li et al., 2011; Zhu et al., 2017). In this section, two constructed delayed response models are used to analyse the effects of changes in water-sediment conditions and water level before dam construction on sedimentation and the morphological adjustment of the cross-section. Since fluctuations in the range of sediment particle size cannot be determined according to the existing data, the effects of flood season inflow, sediment concentration and dam water level are discussed in this paper. For the selection of different design conditions, taking the selection of the water level in front of design dam H as an example, according to the hydrological data collected in the TGR from 2003 to 2020, the maximum and minimum daily average water levels in front of the dam in the flood season are determined, and the range of water level fluctuations in front of the dam in the flood season is obtained. Then, the range is divided into 20 equal parts, and the water level in front of the design dam is expressed as Hdesign=Hflood±(Hmax-Hmin)/20. The same method is used to select the design flow and design sediment concentration. The results are shown in Tables 6 and 7.
Table 6 Calculated V values in 2012 and 2020
Calculation
conditions
Sediment deposition in 2012 Sediment deposition in 2020 Before and after 2013
Calculated Variation Calculated Variation
S+ 136885 +7791 (+6.04%) 178382 +7525 (+4.97%) S: 5.67%-7.21%
Q: 1.50%-0.03%
H: 7.68%-7.53%
Q- 132881 +3187 (+2.47%) 172106 +58 (+0.03%)
H+ 134882 +5788 (+4.48%) 186048 +13999 (+8.14%)
Unchanged 129093 - 172048 -
H- 114933 -14160 (-10.97%) 159166 -12881 (-6.92%)
Q+ 128406 -687 (-0.53%) 171996 -51 (-0.03%)
S- 122275 -6817 (-5.28%) 161565 -14339 (-9.46%)
Table 7 The change in thalweg elevation in 2012 and 2018 at C1 and C2
Cross Calculation
conditions
Change in thalweg elevation in 2012 (m) Change in thalweg elevation in 2018 (m) Before and after 2013
C1 S+ +0.1 +0.25 S: 0.11-0.37
Q: 0.33-0.28
S- -0.12 -0.48
Q+ -0.32 -0.27
Q- +0.35 +0.3
C2 S+ +0.031 +0.052 S: 0.032-0.056
Q: 0.006-0.004
S- -0.033 -0.063
Q+ -0.006 -0.004
Q- +0.006 +0.004

Note: (1): + and - denote addition and subtraction, respectively. For example, Q+ indicates that (Qmax-Qmin)/20 is added on the basis of average flow in the flood season. (2): The data in Table 6 are the differences between the original values and the calculated values under different operating conditions.

Since impoundment of the TGR began, the reservoir has continuously been managed with a variety of reservoir scheduling methods, and scheduling has resulted in the rise and fall of the water level in front of the dam; thus, the water level in front of the dam has played an important role in reservoir sedimentation in the flood season. This process is also reflected by the delayed response model, in which the influence of the water level in front of the dam on the sedimentation in the reservoir area is the largest. The changes in sediment scouring and deposition are closely related to changes in water and sediment conditions. The analysis of the water and sediment conditions (Figure 2) shows that after the impoundment of the cascade reservoirs, the proportion of sediment flowing into the reservoir during the flood season increased (89.97%-91.87%), and the proportion of inflow in the flood season decreased (60.90%-57.83%). Thus, the influence of sediment concentration entering the reservoir on sediment deposition in the reservoir area increased (5.67%-7.21%), and the influence of flow discharge entering the reservoir on sediment deposition in the reservoir area decreased (1.50%-0.03%), as shown in Table 6.
According to Table 7, increasing sediment concentrations and decreasing flows have increased the elevation of the thalweg in cross-sections, while decreasing sediment concentrations and increasing flows have reduced the elevation of the deep-cut points in cross-sections. These changes are in accordance with the basic pattern of riverbed evolution. To further illustrate the influence of the cascade reservoirs on the elevation changes of the thalweg in cross-sections, a comparison of the calculation results in different periods (Table 7) was performed. The results suggest that the influence of sediment content changes on the elevation of the thalweg in a typical section increased after cascade reservoir impoundment, while the influence of flow changes on the elevation of the thalweg in a typical section decreased. These results are in accordance with the analysis above.
Generally, the sediment deposition process in the TGR during the flood season is mainly affected by the sediment concentration in the reservoir during the flood season and the water level in front of the dam. Since the impoundment of the cascade reservoirs, the sediment concentration in the TGR during the flood season has had an increased influence on sediment deposition in the reservoir area.

6 Conclusions

In this paper, the simulation effect of the existing delayed response model of reservoir sedimentation is assessed based on actual measured hydrological data and cross-sectional data for the TGR from 2003 to 2020. Then, a sedimentation and cross-sectional morphology delayed response model is established for the TGR. The effects of the operation of the cascade reservoirs on the sedimentation delayed response behaviour and the sedimentation process in the TGR are then analysed. The main conclusions drawn from this study are as follows.
(1) Compared with that of the existing model, the equilibrium value of the improved model is based on the derivation and evolution of the sediment carrying capacity of flows, which to some extent can better reflect the relationship between the actual reservoir sediment accumulation and the water and sediment conditions. The improved model construction process considers the flow rate, sediment content, sediment grain size, water level in front of the dam and the variability in the attenuation coefficient (adjustment coefficient), and the model is verified using measured data from 2003 to 2020. The results show that the improved model yields improved calculation accuracy and effectively simulates the sedimentation process and the section morphology adjustment process of the TGR in different periods.
(2) The improved model quantifies the delayed response time of sedimentation in the TGR area and the percentage impact of the previous period. According to the simulation results of the model, after the impoundment of the cascade reservoirs, the variations in incoming water and sediment in the TGR decreased, and the incoming sediment became more concentrated during the flood period. These factors increased the adjustment rate of the riverbed and shortened the time scale of sedimentation adjustment from the previous 5 years to the previous 3 years; moreover, the time scale of cross-sectional morphology adjustment was the previous 5 years. In addition, the impact of the previous water and sediment conditions is not negligible for the sedimentation process in the TGR, and the cumulative proportion of the previous influence reaches more than 60%. During the process of sediment accumulation in the reservoir area, the influence of some years with larger or smaller incoming sediment will persist, and this influence will exist for some period of time.
(3) Based on the above two models, the influence of water-sediment changes on sedimentation and the cross-sectional morphology adjustment process in the TGR were analysed. After the impoundment of cascade reservoirs, the effects of incoming sediment on sedimentation and section morphology adjustment in the reservoir area increased as the concentration of incoming sediment during the flood season increased, and the influence of flow discharge on the sedimentation in the reservoir area decreased. Additionally, the influence of the water level in front of dam on the sedimentation process in the reservoir area remained the largest.
The TGR has been impounded for just over ten years, and the available measured data are relatively limited. Based on the existing conditions for analysis, the following patterns can be found. After the impoundment of the cascade reservoirs along the lower Jinsha River, the sediment entering the TGR became more concentrated in the flood season, the weight of influence of the incoming sediment on the whole river adjustment process increased, the river adjustment rate intensified, and the delayed response time of sedimentation in the TGR shortened. The delayed response pattern of sedimentation in the TGR can be further investigated through the collection of more measured data. In this paper, the improved model and the construction approach provide valuable references for delayed response behaviour studies in other river basins and for other reservoirs.
[1]
Ahn Jungkyu, Song Chang Geun, 2017. Numerical modeling of long term reservoir sedimentation in semi-two dimensional manner. KSCE Journal of Civil Engineering, 22(1): 135-140.

DOI

[2]
Bartley R, Rutherfurd I, 2002. Techniques to quantify the variability of thalweg profiles. In: The Structure, Function and Management Implications of Fluvial Sedimentary Systems. IAHS Publication,35-44.

[3]
Chen J, Li Y T, Deng J Y et al., 2008a. Influence on deposition of the Three Gorges Reservoir caused by the change of water silt conditions. Journal of Hydroelectric Engineering, 27(2): 97-102. (in Chinese)

[4]
Chen J, Li Y T, Sun D P et al., 2008b. Impact of operation regulation on sedimentation of Three Gorges Reservoir. Engineering Journal of Wuhan University, 41(5): 18-22. (in Chinese)

[5]
Cheng N S, 1997. Simplified settling velocity formula for sediment particle. Journal of Hydraulic Engineering, 123(2): 149-152.

DOI

[6]
Choi Jong-Woong, Hong Sung-Taek, Kim Seong-Su et al., 2017. A study on prediction of sedimentation efficiency for sedimentation basin using Lagrangian method. Journal of Korean Society of Environmental Engineers, 39(5): 229-236.

DOI

[7]
Dai S B, Lu X X, 2014. Sediment load change in the Yangtze River (Changjiang): A review. Geomorphology, 215: 60-73.

DOI

[8]
Feng P L, Liang Z Y, Huang J C et al., 2005. Study on relation between the change of channel form and the series of water and sediment in the lower Yellow River. Journal of Sediment Research, (2): 66-74. (in Chinese)

[9]
Graf W L, 1977. The rate law in fluvial geomorphology. American Journal of Science, 277(2): 178-191.

DOI

[10]
Hey Richard D, Thorne Colin R, 1986. Stable channels with mobile gravel beds. Journal of Hydraulic Engineering, 112(8): 671-689.

DOI

[11]
Hooke J M, 1995. River channel adjustment to meander cutoffs on the River Bollin and River Dane, northwest England. Geomorphology, 14(3): 235-253.

DOI

[12]
Hu C H, Fang C M, 2017. Research on sediment problem solutions for the Three Gorges Project and it operational effects. Scientia Sinica Technologica, 47(8): 832-844. (in Chinese)

[13]
Hu J, Yang S F, Wang X K, 2013. Sedimentation in Yangtze River above Three Gorges Project since 2003. Journal of Sediment Research(1): 39-44. (in Chinese)

[14]
Huang R Y, Shu C W, Tan G M, 2019. Preliminary study on transportation characteristics of sediment concentration peak of the Three Gorges Reservoir in flood season. Journal of Basic Science and Engineering, 27(6): 1202-1210. (in Chinese)

[15]
Kasai M, Marutani T, Brierley G, 2004. Channel bed adjustments following major aggradation in a steep headwater setting: Findings from Oyabu Creek, Kyushu, Japan. Geomorphology, 62(3/4): 199-215.

DOI

[16]
Li H B, Zhang X F, Hu C H et al., 2011. Impact of cascade reservoirs construction in the upper Yangtze River on sediment inflow to Three Gorges reservoirs. Journal of Hydroelectric Engineering, 30(1): 94-100. (in Chinese)

[17]
Li L Y, Wu B S, 2011a. Application of delayed response model to bankfull discharge in the Inner Mongolia reach of Yellow River. Journal of Hydroelectric Engineering, 30(1): 70-77. (in Chinese)

[18]
Li L Y, Wu B S, 2011b. Modification of delayed response model for bankfull discharges. Journal of Sediment Research, (2): 21-26. (in Chinese)

[19]
Li W J, Yang S F, Fu X H et al., 2015. Sedimentation characteristics in the Three Gorges Reservoir during the initial operation stage. Advances in Water Science, 26(5): 676-685. (in Chinese)

[20]
Li W W, Wu B S, Xia J Q et al., 2010. Application of the method of artificial neural network in calculating bankfull discharge in the Lower Yellow River. Journal of Sediment Research, (3): 17-23. (in Chinese)

[21]
Lu C H, Dong X Y, Tang J L et al., 2019. Impacts of large cascade reservoirs on runoff and sediment load variations in Jinsha River Basin. Science of Soil and Water Conservation, 17(5): 36-43. (in Chinese)

[22]
Lyu Y W, Fagherazzi S, Tan G M et al., 2020. Hydrodynamic and geomorphic adjustments of channel bars in the Yichang-Chenglingji Reach of the Middle Yangtze River in response to the Three Gorges Dam operation. Catena, 193.

[23]
Lyu Y W, Tan G M, Zheng S et al., 2018a. Improvement of river evolution delay response model in the Jingjiang Reach. Journal of Sediment Research, 43(1): 9-14. (in Chinese)

[24]
Lyu Y W, Zheng S, Tan G M et al., 2018b. Effects of Three Gorges Dam operation on spatial distribution and evolution of channel thalweg in the Yichang-Chenglingji Reach of the Middle Yangtze River, China. Journal of Hydrology, 565: 429-442.

DOI

[25]
Madej Mary Ann, 1999. Temporal and spatial variability in thalweg profiles of a gravel-bed river. Earth Surface Processes and Landforms, 24(12): 1153-1169.

DOI

[26]
Ren J Q, Zhao M D, Zhang W et al., 2020. Impact of the construction of cascade reservoirs on suspended sediment peak transport variation during flood events in the Three Gorges Reservoir. Catena, 188.

[27]
Sear D A, Newson M D, Thorne C R, 2010. Guidebook of Applied Fluvial Geomorphology. London: Thomas Telford, 120-195. doi: 10.1680/gafg.34846.0004.

DOI

[28]
Shen H B, Wu B S, Zheng S et al., 2013. Relation of bank-full discharge to effective discharge in the Inner Mongolia reach of Yellow River. Advances in Water Science, 24(4): 477-482. (in Chinese)

[29]
Simon A, 1992. Energy, time, and channel evolution in catastrophically disturbed fluvial systems. Geomorphology, 5(3-5): 345-372.

DOI

[30]
Simon A, Rinaldi M, 2006. Disturbance, stream incision, and channel evolution: The roles of excess transport capacity and boundary materials in controlling channel response. Geomorphology, 79(3/4): 361-383.

DOI

[31]
Simon Andrew, Thorne Colin R, 1996. Channel adjustment of an unstable coarse-grained stream: opposing trends of boundary and critical shear stress, and the applicability of extremal hypotheses. Earth Surface Processes and Landforms, 21(2): 155-180.

DOI

[32]
Tang X Y, Tong S C, Xu G X et al., 2019. Delayed response of sedimentation in the flood seasons to the pool level of the Three Gorges Reservoir. Advances in Water Science, 30(4): 528-536. (in Chinese)

[33]
Wang Y G, Hu C H, Liu X et al., 2016. Study on variations of runoff and sediment load in the Upper Yangtze River and main influence factors. Journal of Sediment Research, (1): 1-8. (in Chinese)

[34]
Wang Y J, Wu B S, Zhong D Y, 2020. Simulation of the main-channel cross-section geometry of the Lower Yellow River in response to water and sediment changes. Acta Geographica Sinica, 75(7): 1494-1511. (in Chinese)

DOI

[35]
Wu B S, 2008a. Delayed response model for bankfull discharge of alluvial rivers. Journal of Hydraulic Engineering, 39(6): 680-687. (in Chinese)

[36]
Wu B S, 2008b. Delayed response model for fluvial processes of alluvial rivers (I): Model development. Journal of Sediment Research, (6): 1-7. (in Chinese)

[37]
Wu B S, 2008c. Delayed response model for fluvial processes of alluvial rivers (II): Model applications. Journal of Sediment Research(6): 30-37. (in Chinese)

[38]
Wu B S, Xia J, Q, Wang Z Y, 2006. Delayed response of Tongguan’s elevation to the sedimentation in Sanmenxia Reservoir. Journal of Sediment Research, (1): 9-16. (in Chinese)

[39]
Wu B S, You T, 2008. Theoretical model for delayed response of reservoir sedimentation. Journal of Hydraulic Engineering, 39(5): 627-632. (in Chinese)

[40]
Wu B S, Zhang Y F, Xia J Q, 2008. Variation of bank-full area at Gaocun station in the Lower Yellow River. Journal of Sediment Research, (2): 34-40. (in Chinese)

[41]
Wu B S, Zheng S, Thorne C R, 2012. A general framework for using the rate law to simulate morphological response to disturbance in the fluvial system. Prog Phys Geog, 36(5): 575-597.

DOI

[42]
Xu Q X, Tong H, 2012. Characteristics of flow and sediment change in Yangtze River in recent 50 years. Hydrology, 32(5): 38-47,76. (in Chinese)

[43]
Yang H F, Yang S L, Xu K H et al., 2018. Human impacts on sediment in the Yangtze River: A review and new perspectives. Global and Planetary Change, 162: 8-17.

DOI

[44]
Yuan J, Xu Q X, 2018. Sediment trapping effect by reservoirs in the Jinsha River basin. Advances in Water Science, 29(4): 482-491. (in Chinese)

[45]
Yuan W H, Yin D W, Finlayson B et al., 2012. Assessing the potential for change in the middle Yangtze River channel following impoundment of the Three Gorges Dam. Geomorphology, 147: 27-34.

[46]
Zhang X J, Mu D W, Chen X W, 2009. Impact on sediment deposition in the backwater of the Three Gorges Reservoir area due to the changes of the upstream sediment runoff. Port and Waterway Engineering, (8): 94-97. (in Chinese)

[47]
Zhang Y C, Li L Y, Fan B L et al., 2016. Delayed response of cross section area to variable incoming flow and sediment at Shashi Segment of Yangtze River. Journal of YangtzeRiver ScientificResearch Institute, 33(7): 1-5. (in Chinese)

[48]
Zheng S, Wu B S, Tan G M, 2014a. Review on the self-adjustment behavior of alluvial rivers based on the concept of macro system. Journal of Sediment Research, (5): 73-80. (in Chinese)

[49]
Zheng S, Wu B S, Thorne C R et al., 2015. Case study of variation of sedimentation in the Yellow and Wei rivers. Journal of Hydraulic Engineering, 141(3).

[50]
Zheng S, Wu B S, Thorne C R et al., 2014b. Morphological evolution of the North Fork Toutle River following the eruption of Mount St. Helens, Washington. Geomorphology, 208: 102-116.

DOI

[51]
Zhou Y J, Wang J, Jin Z W et al., 2020. Study on processes of sediment sources to the Three Gorges Reservoir. Journal of Sediment Research, 45(4): 21-26. (in Chinese)

[52]
Zhu L L, Dong X Y, Chen Z F, 2017. Sediment deposition of cascade reservoirs in the Lower Jinsha River and its impact on Three Gorges Reservoir. Journal of Yangtze River Scientific Research Institute, 34(3): 1-7. (in Chinese)

Outlines

/