
Journal of Geographical Sciences >
Long-term passive restoration of severely degraded drylands - divergent impacts on soil and vegetation: An Israeli case study
|
Ilan Stavi, E-mail: istavi@adssc.org |
Received date: 2022-05-07
Accepted date: 2022-10-30
Online published: 2023-03-21
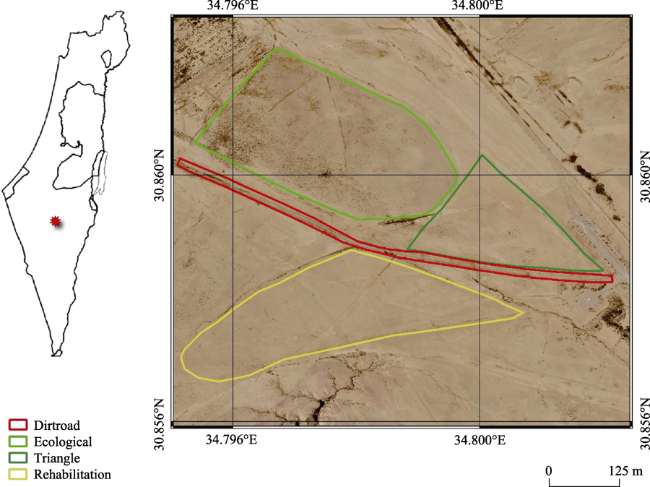
Land degradation affects extensive drylands around the world. Due to long-term misuse, the Israeli Sde Zin dryland site has faced severe degradation. The study objective was to assess the feasibility of passive restoration in recovering the site. The study was conducted in four land-units along a preservation-degradation continuum: (1) an area that has not faced anthropogenic disturbances (Ecological land); (2) an area that was proclaimed as a national park in the 1970s (Rehabilitation); (3) an area that was prone, until recently, to moderate anthropogenic pressures (Triangle); and (4) a dirt road that was subjected to long-term off-road traffic (Dirtroad). Soil was sampled and analyzed for its properties. The soil physical quality followed the trend of Ecological land > Rehabilitation > Triangle > Dirtroad. Specifically, high soil salinity in the latter three land-units is attributed to long-term erosional processes that exposed the underlying salic horizons. Herbaceous and shrubby vegetation cover was also monitored. The herbaceous vegetation cover followed the trend of Ecological land (86.4%) > Rehabilitation (40.3%) > Triangle (26.2%) > Dirtroad (2.1%), while the shrubby cover was 2.8% in the Ecological land-unit, and practically zero in the other land-units. It seems that despite the effectiveness of passive restoration in recovering the soil’s physical properties, the recovery of vegetation is limited by the severe soil salinity.
Ilan STAVI , Manuel PULIDO FERNÁNDEZ , Eli ARGAMAN . Long-term passive restoration of severely degraded drylands - divergent impacts on soil and vegetation: An Israeli case study[J]. Journal of Geographical Sciences, 2023 , 33(3) : 529 -546 . DOI: 10.1007/s11442-023-2095-9
Figure 1 A map of Israel, with an extension of the study site |
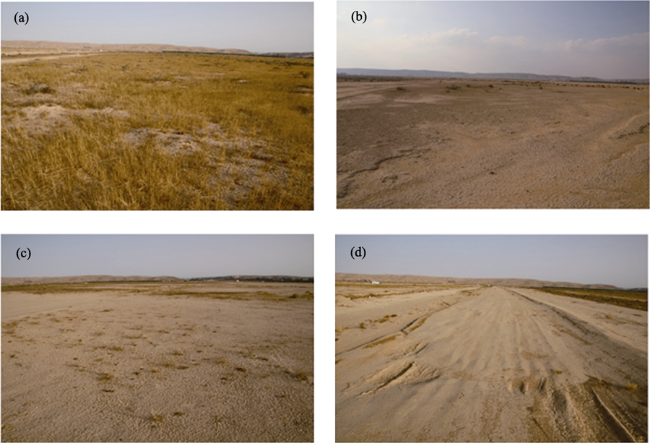
Figure 2 Characterizing views of the Ecological land (a), Rehabilitation (b), Triangle (c), and Dirtroad (d) land units. Note the dense (shrubby and herbaceous) vegetation cover in the Ecological land unit, and the developed mechanic crust covering the Dirtroad land unit |
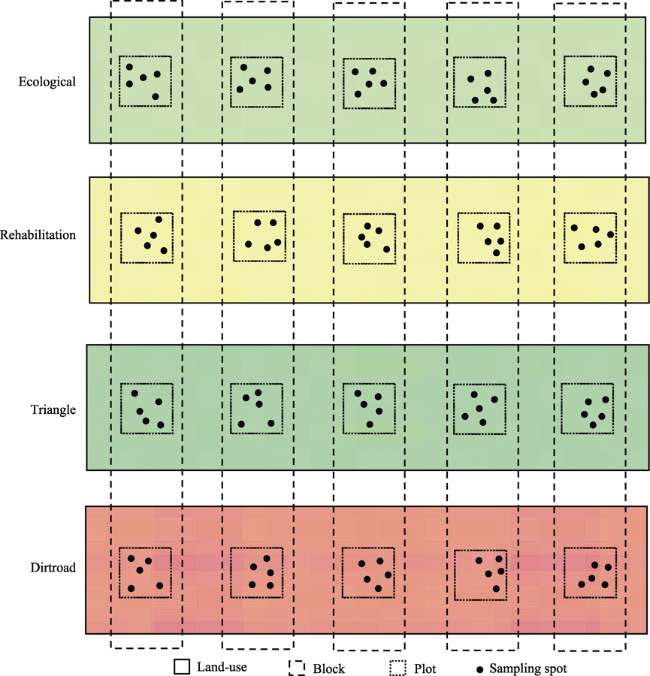
Figure 3 Schematic illustration of the study design |
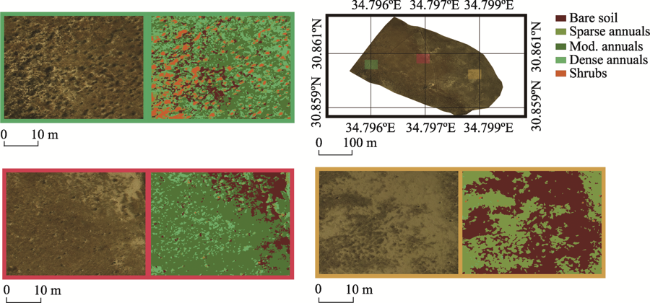
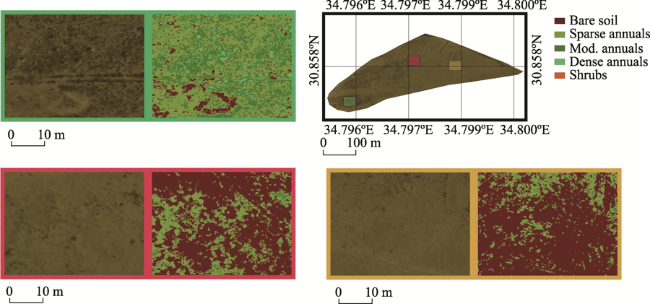
Figure 4a UAV orthophoto of the Ecological land unit (upper right panel), and extensions of three representing plots, each with a matching aerial image at the left side and the Maximum Likelihood classification product at the right side (the rest of the three panels) |
Figure 4b UAV orthophoto of the Rehabilitation land unit (upper right panel), and extensions of three representing plots, each with a matching aerial image at the left side and the Maximum Likelihood classification product at the right side (the rest of the three panels) |
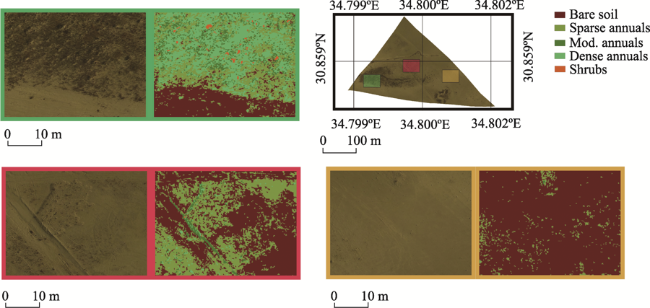
Figure 4c UAV orthophoto of the Triangle land unit (upper right panel), and extensions of three representing plots, each with a matching aerial image at the left side and the Maximum Likelihood classification product at the right side (the rest of the three panels) |
Figure 4d UAV orthophotos of the Dirtroad land unit (right column), and the corresponding extensions of four representing plots along it, each with a matching aerial image at the left side and the Maximum Likelihood classification product at the right side (left column) |
Table 1 Land unit effect on soil properties |
| P value | Dirtroad | Triangle | Rehabilitation | Ecological land | |
|---|---|---|---|---|---|
| Clay (%) | 0.0918 | 20.0 a (6.3) | 33.8 a (3.6) | 23.9 a (2.3) | 22.0 a (1.9) |
| Silt (%) | 0.0009 | 51.3 a (5.4) | 33.8 b (2.7) | 29.2 b (2.6) | 27.1 b (1.3) |
| Sand (%) | 0.0001 | 28.6 b (2.1) | 32.4 b (1.8) | 46.9 a (5.0) | 50.8 a (3.1) |
| Soil moisture (%) | 0.0001 | 3.5 a (0.1) | 3.6 a (0.1) | 3.0 b (0.1) | 1.9 c (0.1) |
| Penetration resistance (MPa) | 0.0001 | 2.66 a (0.00) | 1.81 b (0.18) | 0.86 c (0.15) | 0.81 c (0.13) |
| Stable aggregates (%) | 0.0001 | 3.2 b (0.5) | 5.0 b (0.8) | 13.4 a (2.1) | 12.6 a (1.8) |
| Slaking index | 0.0001 | 2.54 a (0.09) | 2.28 ab (0.10) | 1.98 b (0.16) | 1.08 c (0.15) |
| clay dispersion index | 0.0325 | 4.00 a (0.00) | 3.98 ab (0.02) | 3.88 ab (0.08) | 3.80 b (0.06) |
| Calcium carbonate (%) | 0.087 | 26.2 a (0.3) | 23.9 a (0.3) | 27.7 a (0.5) | 30.6 a (0.4) |
| Electrical conductivity (µS/cm) | 0.0001 | 16,332.8 a (474.5) | 13,849.9 b (966.4) | 4,917.5 c (588.2) | 1,321.9 d (235.3) |
| pH | 0.0001 | 8.20 c (0.01) | 8.10 c (0.04) | 8.29 b (0.03) | 8.44 a (0.03) |
Notes: Bold P value indicate a significant effect. Means within the same column followed by a different letter differ at the 0.05 probability level according to Tukey’s Honestly Significant Difference (HSD). Numbers within parentheses are standard error of the means. |
Table 2 Depth effect on soil properties |
| P value | 0-5 cm | 5-10 cm | |
|---|---|---|---|
| Clay (%) | 0.3847 | 26.6 a (3.1) | 23.3 a (3.0) |
| Silt (%) | 0.5198 | 32.8 a (2.5) | 37.8 a (4.4) |
| Sand (%) | 0.5026 | 40.5 a (3.3) | 38.9 a (3.8) |
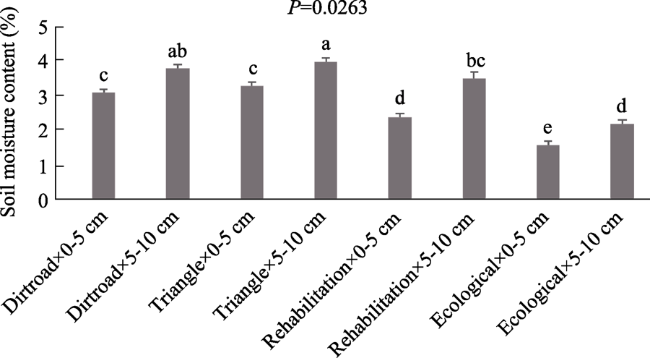
| Soil moisture (%) | 0.0001 | 2.6 b (0.1) | 3.4 a (0.1) |
| Stable aggregates (%) | 0.2891 | 9.4 a (1.1) | 7.8 a (1.2) |
| Slaking index | 0.3499 | 2.03 a (0.11) | 1.91 a (0.10) |
| clay dispersion index | 0.0913 | 3.87 a (0.05) | 3.96 a (0.02) |
| Calcium carbonate (%) | 0.7586 | 27.0 a (0.3) | 27.1 a (0.4) |
| Electrical conductivity (µS/cm) | 0.0058 | 8,279.9 b (870.8) | 9,931.2 a (731.3) |
| pH | 0.4879 | 8.26 a (0.02) | 8.24 a (0.02) |
Notes: Bold P value indicates a significant effect. Means within the same column followed by a different letter differ at the 0.05 probability level according to Tukey’s Honestly Significant Difference (HSD). Numbers within parentheses are standard error of the means. |
Figure 5 Effect of the interaction between land unit and depth on the gravimetric moisture content of soil. Notes: error bars are standard error of the means. Bars with different letters differ at 0.05 probability level. |
Table 3 Kappa coefficient of agreement and overall accuracy results of types of surface cover, according to the different land units and classification methods |
| Classification method | ||||||||||
|---|---|---|---|---|---|---|---|---|---|---|
| ML | MhD | MD | PP | SID | ||||||
| Land unit | Kappa | Acc. [%] | Kappa | Acc. [%] | Kappa | Acc. [%] | Kappa | Acc. [%] | Kappa | Acc. [%] |
| Ecological land | 0.87 | 89.93 | 0.83 | 87.29 | 0.63 | 71.93 | 0.25 | 37.34 | 0.72 | 79.01 |
| Triangle | 0.67 | 79.87 | 0.69 | 78.84 | 0.66 | 76.43 | 0.05 | 31.88 | 0.75 | 83.16 |
| Rehabilitation | 0.79 | 93.46 | 0.65 | 81.68 | 0.55 | 77.21 | 0.02 | 32.27 | 0.63 | 81.39 |
| Dirtroad | 0.82 | 93.83 | 0.47 | 95.03 | 0.49 | 95.55 | 0.83 | 99.14 | 0.49 | 95.45 |
Notes: ML - Maximum Likelihood; MhD - Mahalanobis Distance; MD - Minimum Distance; PP - Parallelepiped; SID - Spectral Information Divergence. Kappa values were divided into five categories: [1] 0.01-0.2: slight agreement; [2] 0.21-0.40: Fair agreement; [3] 0.41-0.60: Moderate agreement; [4] 0.61-0.80: Substantial agreement (underlined); and [5] 0.81-1.0: perfect agreement (bold). |
Figure 6 Types of ground surface cover according to land unit |
Table 4 Surface cover classification’s area and percentage for the Maximum Likelihood (ML) supervised classification |
| Land unit | ||||||||
|---|---|---|---|---|---|---|---|---|
| Ecological land | Triangle | Rehabilitation | Dirtroad | |||||
| Surface cover class | Area (m2) | Cover (%) | Area (m2) | Cover (%) | Area (m2) | Cover (%) | Area (m2) | Cover (%) |
| Dense annuals | 18,650.1 | 26.9 | 2,097.7 | 5.2 | 1,023.0 | 1.2 | 0.0 | 0.0 |
| Moderate annuals | 19,452.6 | 28.1 | 1,101.1 | 2.7 | 5,496.8 | 6.1 | 30.8 | 2.1 |
| Sparse annuals | 21,727.9 | 31.4 | 7,451.8 | 18.3 | 31,872.6 | 33.0 | 0.0 | 0.0 |
| Shrubby vegetation | 1,905.7 | 2.8 | 58.3 | 0.1 | 107.1 | 0.2 | 0.3 | 0.0 |
| Bare soil | 7,542.2 | 10.9 | 29,932.9 | 73.7 | 59,279.4 | 59.5 | 2,212.6 | 97.9 |
| Total area | 69,278.5 | 100.0 | 40,641.8 | 100.0 | 97,778.8 | 100.0 | 2,243.7 | 100.0 |
| [1] |
|
| [2] |
|
| [3] |
|
| [4] |
|
| [5] |
|
| [6] |
|
| [7] |
|
| [8] |
|
| [9] |
|
| [10] |
|
| [11] |
|
| [12] |
|
| [13] |
|
| [14] |
|
| [15] |
|
| [16] |
|
| [17] |
|
| [18] |
|
| [19] |
|
| [20] |
|
| [21] |
|
| [22] |
|
| [23] |
|
| [24] |
FAO, 2015. World reference base for soil resources 2014: International soil classification system for naming soils and creating legends for soil maps, update 2015. Food and Agriculture Organization of the United Nations, Rome.
|
| [25] |
|
| [26] |
|
| [27] |
|
| [28] |
|
| [29] |
|
| [30] |
|
| [31] |
|
| [32] |
|
| [33] |
|
| [34] |
|
| [35] |
|
| [36] |
|
| [37] |
|
| [38] |
|
| [39] |
|
| [40] |
|
| [41] |
|
| [42] |
|
| [43] |
|
| [44] |
|
| [45] |
|
| [46] |
|
| [47] |
|
| [48] |
|
| [49] |
|
| [50] |
|
| [51] |
|
| [52] |
|
| [53] |
|
| [54] |
|
| [55] |
SAS Institute, 1990. SAS/STAT User’s Guide. Version 6, 4th ed. SAS Institute: Cary, NC.
|
| [56] |
|
| [57] |
|
| [58] |
|
| [59] |
|
| [60] |
|
| [61] |
|
| [62] |
|
| [63] |
|
| [64] |
|
| [65] |
|
| [66] |
|
| [67] |
|
| [68] |
USDA-NRCS. Dispersive Clay Soils. EFH Notice 210-WI-6. http://www.nrcs.usda.gov/Internet/FSE_DOCUMENTS/nrcs142p2_024606.pdf.
|
| [69] |
|
| [70] |
|
| [71] |
|
| [72] |
|
/
| 〈 |
|
〉 |

