
Journal of Geographical Sciences >
An overall consistent increase of global aridity in 1970-2018
|
Luo Dengnan (1997-), MS, specialized in extreme events and terrestrial ecosystem carbon cycle. E-mail: 2020022625@m.scnu.edu.cn. |
Received date: 2022-02-21
Accepted date: 2022-09-06
Online published: 2023-03-21
Supported by
National Natural Science Foundation of China(31922053)
The Second Tibetan Plateau Scientific Expedition and Research Program(2019QZKK0405)
The Hainan University Start-up Fund(KYQD(ZR)21096)
The Key R&D Program of Hainan(ZDYF2022SHFZ042)
Climate change is expected to introduce more water demand in the face of diminishing water supplies, intensifying the degree of aridity observed in terrestrial ecosystems in the 21st century. This study investigated spatiotemporal variability within global aridity index (AI) values from 1970-2018. The results revealed an overall drying trend (0.0016 yr-1, p<0.01), with humid and semi-humid regions experiencing more significant drying than other regions, including those classified as arid or semi-arid. In addition, the Qinghai-Tibet Plateau has gotten wetter, largely due to the increases in precipitation (PPT) observed in that region. Global drying is driven primarily by decreasing and increasing PPT and potential evapotranspiration (PET), respectively. Decreases in PPT alone or increases in PET also drive global aridification, though to a lesser extent. PPT and increasing potential evapotranspiration (PET), with increasing PET alone or decreasing PPT alone. Slightly less than half of the world’s land area has exhibited a wetting trend, largely owing to increases in regional PPT. In some parts of the world, the combined effects of increased PPT and decreased PET drives wetting, with decreases in PET alone explaining wetting in others. These results indicate that, without consideration of other factors (e.g., CO2 fertilization), aridity may continue to intensify, especially in humid regions.
Key words: aridity index; climate change; arid area; drying trend
LUO Dengnan , HU Zhongmin , DAI Licong , HOU Guolong , DI Kai , LIANG Minqi , CAO Ruochen , ZENG Xiang . An overall consistent increase of global aridity in 1970-2018[J]. Journal of Geographical Sciences, 2023 , 33(3) : 449 -463 . DOI: 10.1007/s11442-023-2091-0
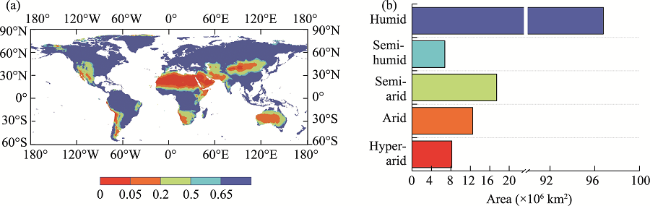
Figure 1 Multi-year mean of AI from 1970-2018 (a. Global distribution of AI; b. Total land cover associated with different aridity regimes) |
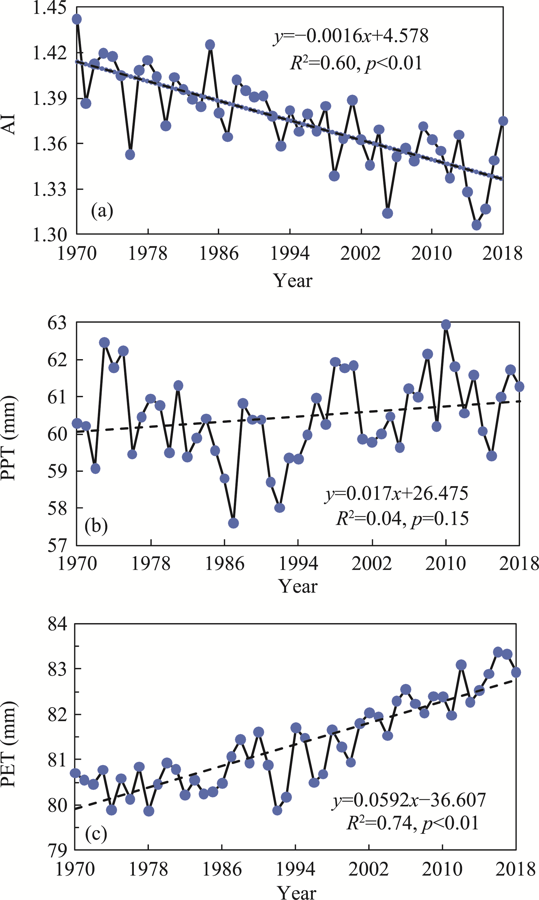
Figure 2 Trends in global averages for AI (a), PPT (b), and PET (c) from 1970-2018 (R2 is the coefficient of determination) |
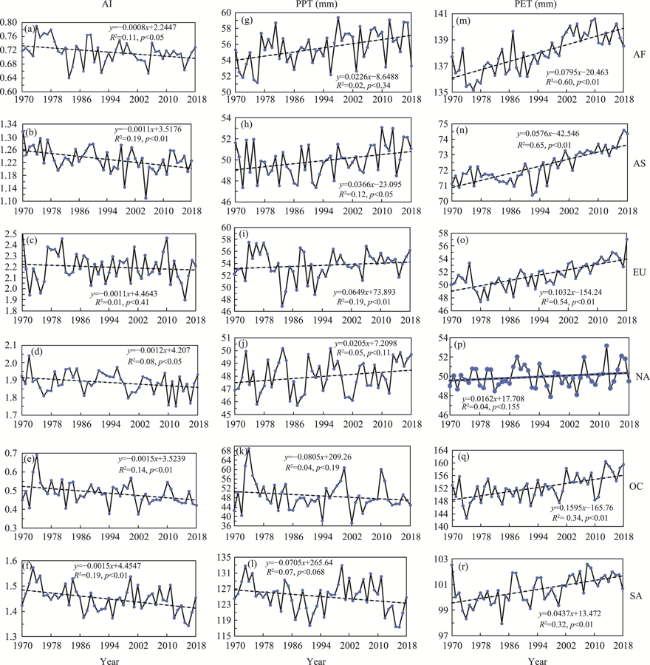
Figure 3 Inter-annual variability and temporal trends in AI, PPT, and PET across different continents(AF: Africa; AS: Asia; EU: Europe; NA: North America; OC: Oceania; SA: South America) |
Figure 4 Spatial variability and trends in AI (a), PPT (b), and PET (c) across the globe. -- and - denote a significant (p<0.05) and non-significant (p>0.05) decline, respectively. ‘0’ indicates no obvious trend and + and ++ denote a non-significant and significant increase, respectively. The black and gray bars denote significance at the 95% and 90% confidence levels, respectively. Black points indicate significance at the 95% confidence level. |
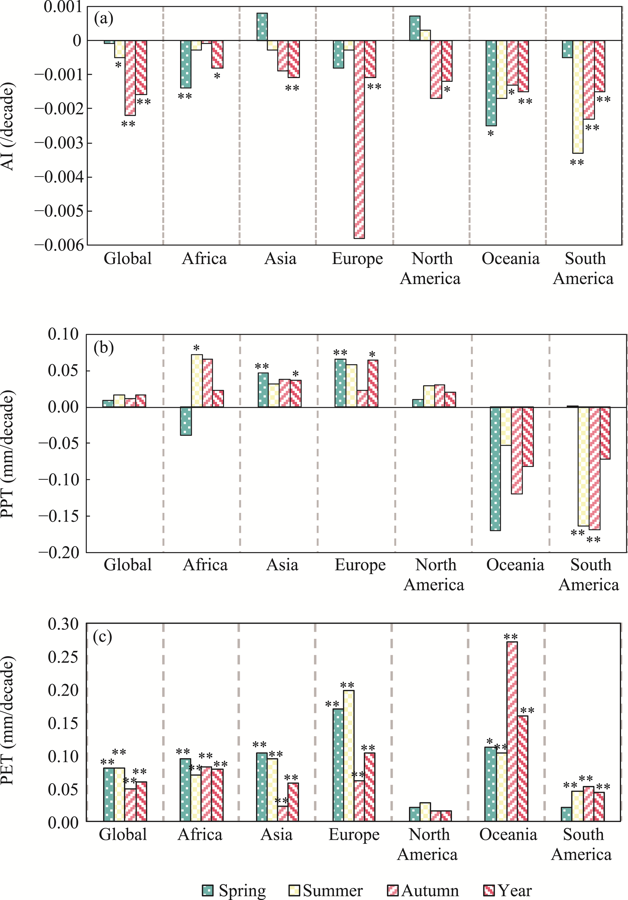
Figure 5 Trends in AI, PPT, and PET in different seasons (Spring: March to May; Summer: June to August; Autumn: September to November). Far northern areas are covered with ice in the winter, so this season is ignored. * and ** represent the significance at the 95% and 99% confidence level, respectively. |
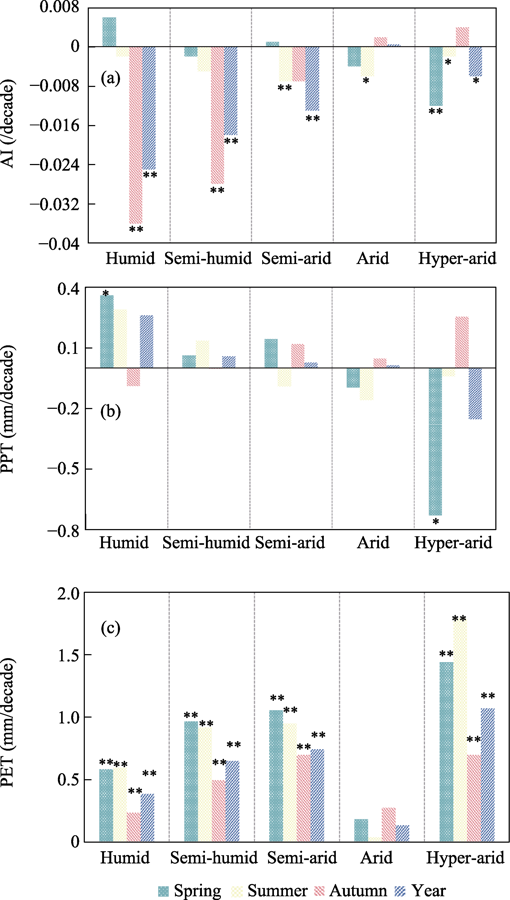
Figure 6 Seasonal trends in AI, PPT and PET across different climate regions, demonstrating the same pattern as those illustrated in Figure 5 |
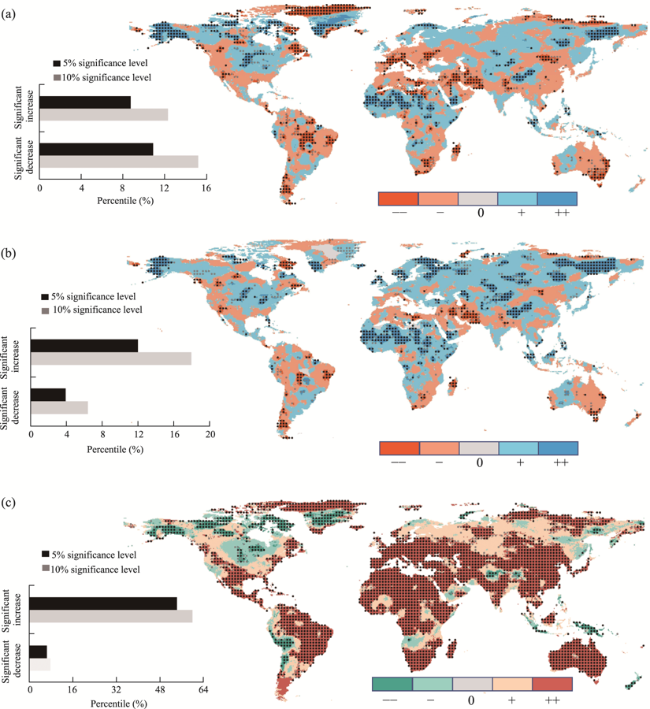
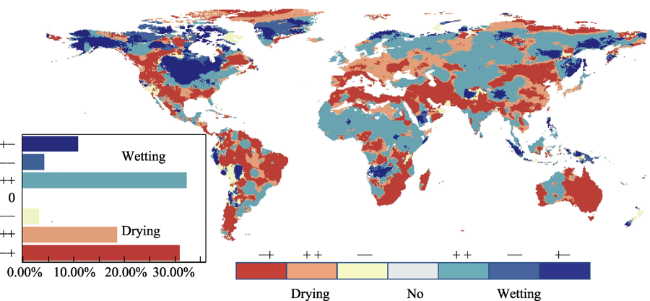
Figure 7 Spatial distribution of dry and wet conditions at the global scale. In areas experiencing increased aridity, -+ denotes that dryness results from the combined effects of PPT and PET, ++ and -- denote that the dryness is derived from increased PET or decreased PPT, respectively. “No” denotes no significant drying or wetting trend. In areas experiencing wetting, +- denotes that wetting results from the combined effects of PPT and PET, ++ and -- denote that wetness results from increased PPT or decreased PET, respectively. The histogram on the left shows the proportions of drying and wetting. |
| [1] |
|
| [2] |
|
| [3] |
|
| [4] |
|
| [5] |
|
| [6] |
|
| [7] |
|
| [8] |
|
| [9] |
|
| [10] |
|
| [11] |
|
| [12] |
|
| [13] |
|
| [14] |
|
| [15] |
|
| [16] |
|
| [17] |
|
| [18] |
|
| [19] |
|
| [20] |
|
| [21] |
|
| [22] |
|
| [23] |
|
| [24] |
|
| [25] |
|
| [26] |
IPCC, 2021. Climate Change 2021: The Physical Science Basis. Cambridge: Cambridge University Press.
|
| [27] |
|
| [28] |
|
| [29] |
|
| [30] |
|
| [31] |
|
| [32] |
|
| [33] |
|
| [34] |
|
| [35] |
|
| [36] |
|
| [37] |
|
| [38] |
|
| [39] |
|
| [40] |
|
| [41] |
|
| [42] |
|
| [43] |
|
| [44] |
|
| [45] |
|
| [46] |
|
| [47] |
|
| [48] |
Van Der Schrier G,
|
| [49] |
|
| [50] |
|
| [51] |
|
| [52] |
|
| [53] |
|
| [54] |
|
| [55] |
|
| [56] |
|
/
| 〈 |
|
〉 |