Research Articles

Identification of regional pattern of climate change risk in China under different global warming targets

  • WU Shaohong , 1, 2 ,
  • CHAO Qingchen 3 ,
  • GAO Jiangbo 1 ,
  • LIU Lulu 1 ,
  • FENG Aiqing 3 ,
  • DENG Haoyu 1 ,
  • ZUO Liyuan 1, 2 ,
  • LIU Wanlu 1, 2
Expand
  • 1. Key Laboratory of Land Surface Pattern and Simulation, Institute of Geographic Sciences and Natural Resources Research, CAS, Beijing 100101, China
  • 2. College of Resources and Environment, University of Chinese Academy of Sciences, Beijing 100101, China
  • 3. National Climate Center, Beijing 100081, China

Wu Shaohong, Professor, specialized in physical geography. E-mail:

Received date: 2022-06-13

  Accepted date: 2022-11-01

  Online published: 2023-03-21

Supported by

The National Key R&D Program of China(2018YFC1509002)

The Strategic Priority Research Program of the Chinese Academy of Sciences(XDA19040304)

Abstract

Climate change will bring huge risks to human society and the economy. Regional climate change risk assessment is an important basic analysis for addressing climate change, which can be expressed as a regional system of comprehensive climate change risk. This study establishes regional systems of climate change risks under the proposed global warming targets. Results of this work are spatial patterns of climate change risks in China, indicated by the degree of climate change and the status of the risk receptors. Therefore, the risks show significant spatial differences. The high-risk regions are mainly distributed in East, South, and central China, while the medium-high risk regions are found in North and southwestern China. Under the 2°C warming target, more than 1/4 of China’s area would be at high and medium-high risk, which is more severe than under the 1.5°C warming target, and would extend to the western and northern regions. This work provides regional risk characteristics of climate change under different global warming targets as a foundation for dealing with climate change.

Cite this article

WU Shaohong , CHAO Qingchen , GAO Jiangbo , LIU Lulu , FENG Aiqing , DENG Haoyu , ZUO Liyuan , LIU Wanlu . Identification of regional pattern of climate change risk in China under different global warming targets[J]. Journal of Geographical Sciences, 2023 , 33(3) : 429 -448 . DOI: 10.1007/s11442-023-2090-1

1 Introduction

Since the Industrial Revolution of the 19th century, the development of human society and economy has contributed to climate change. Climate change has attracted increasing attention from global governments, academia, and the public (Edenhofer et al., 2007; IPCC, 2007, 2012, 2014a, 2014b; Giddens, 2009; Pindyck, 2013). The sixth assessment report (AR6) launched by the IPCC shows that global mean temperature has increased by 1.1℃ compared to the period 1850-1900, and global warming will continue for a long period (IPCC, 2021). The 21st Conference of the Parties to the United Nations Convention on Climate Change (COP 21 of UNFCCC) in Paris reached a broad consensus on the global response to climate change, emphasizing that the global average temperature rise should be controlled within 2℃ above the pre-industrial level, and efforts should be made to limit the temperature rise within 1.5℃ above the pre-Industrial Revolution level (UNFCCC, 2015). The IPCC special report, Global Warming of 1.5℃ points out that compared with global warming of 2.0℃, the impact and risk caused by global warming of 1.5℃ would be lower (IPCC, 2018). But there is considerable uncertainty in achieving a controlled warming of 2.0℃ in this century (Climate Action Tracker, 2017; Raftery et al., 2017). Therefore, assessing the key risks of climate change under different warming targets and finding ways to address climate change should become a key priority (Kahn et al., 2016). In the future, global and Chinese regional temperatures would continue to rise, and the warming rate would accelerate with higher emission scenarios. Multimodel ensemble average analyses of global and Chinese mean temperatures from 1851 to 2100 relative to the pre-Industrial Revolution (average from 1861 to 1900) under the representative concentration pathway (RCP) 8.5 scenario shows that the global average temperature rise would reach 1.5℃ in 2026 and 2℃ in 2040, while averages in China would exceed 1.8℃ and 2.5℃ respectively (Wu et al., 2019a, 2019b). Warming is the main characteristic of global climate change, resulting in increasing climatic driving forces on social and economic development; increasing extreme event frequencies and chain reactions of disasters, and compounded disasters; bringing high risks to populations, economies, agricultural production, and ecosystems in climate change sensitive regions (Roderick et al., 2012; Sheffield et al., 2012). Continual temperature and precipitation changes would increase the frequency of extreme weather and climate events and lead to greater disaster risk (Wu et al., 2019a). Adaptation is an important pathway to deal with climate change, and recognizing and avoiding climate change risks are the premise of that adaptation.
Natural regional system studies examine the natural complexity of the Earth’s surface from a systems perspective (Köppen et al., 1931; Huang, 1959; Holdridge, 1967; Bailey, 1996; Zheng et al., 2008). The goal of such studies is to systematize seemingly random natural phenomena in a geographic range. Regionalization is the process of establishing the natural regional system and delineating zonal differentiations. The natural regional system has played an important role during the social and economic development of the last 70 years in China, as a means to reveal the behavior of land surface regional differentiations (Lin, 1954; Luo, 1954; Ren et al., 1961; Hou et al., 1963; Zhao, 1983; Xi et al., 1984; Qiu, 1986; Huang, 1989; Wu et al., 2010). China’s regional eco-geographic system is one of the new cases of a natural regional system. The objectives of this work are to recognize the climate change situation in China; to merge grid-based risks into regional comprehensive risks; and then, based on these regional comprehensive risks, to establish a Regional System of Comprehensive Climate Change Risk using the natural regional system methodology. This system develops spatial patterns of regional climate change sensitivity, quantifies the dangerousness of extreme events, and identifies regional differences in possible population, GDP, ecosystem, or food production losses in China. It also identifies differences in the comprehensive risk spatial patterns under different warming targets; and characterizes regional risk patterns for coping with climate change.

2 Data and methods

2.1 Data and methods applied for risk assessment

The data used include risk projections for socioeconomic systems, food production, and ecosystems under future climate change scenarios (Wu et al., 2019a, 2019b). The scenarios were projected by using socioeconomic scenario data such as population and GDP values, which were derived from shared socioeconomic pathways (SSPs) (O’Neill et al., 2014). The downscaling scenario data sets were simulated by the National Institute for Environmental Studies, Japan with spatial resolution was 0.5° × 0.5°, based on the SSP database of the International Institute for Applied Systems Analysis (Murakami and Yamagata, 2016). Detailed data and methods applied for risk assessment are listed in Table 1.
Table 1 Data used and method applied for climate change risk assessment
Data. Description References
Climate scenario A monthly climate data set from 29 global circulation models (GCMs) under the Coupled Model Intercomparison Project Phase 5 driven by multiple RCP scenarios was used to calculate the global mean surface temperature (GMST) and mean surface temperature over China (CMST); RCP8.5 scenarios Edmonds, 2011;
Van Vuuren et al., 2011;
Taylor et al., 2012
A daily climate data set with a spatial resolution of 0.5° × 0.5° from 1950 to 2099 using five models under the framework of the Inter- Sectoral Impact Model Intercomparison Project; RCP8.5 scenarios Warszawski et al., 2014
Socioeconomic scenario Population and GDP values from shared socioeconomic pathways (SSPs) O’Neill et al., 2014
Downscaling scenario data sets by the National Institute for Environmental Studies, Japan, based on the SSP database of the International Institute for Applied Systems Analysis, interval every 10 years from 1980 to 2100; the spatial resolution was 0.5° × 0.5° Murakami and Yamagata, 2016
Methods Risk assessment of sudden onset events including heat wave, drought, and flood
R = P×E×V
Wu et al., 2011;
Li et al., 2012;
Wu et al., 2019a, 2019b
Risk assessment of slow onset event: ecosystem risk, using the
Lund-Potsdam-Jena Dynamic Global Vegetation Model
Sitch et al., 2003;
Shi et al., 2011;
Wu et al., 2019a, 2019b
Risk assessment of slow onset event: food production, using the Crop Environment REsource Synthesis model (CERES)
Q = Yt /Y0
Xiong et al., 2008;
Wu et al., 2011;
Wu et al., 2019a, 2019b
Identifying risk levels by multiple of the standard deviation method
$\alpha =\frac{{{x}_{i}}-\bar{x}}{\delta }\text{ }\!\!~\!\!\text{ }$ $\delta =\sqrt{\frac{\mathop{\sum }_{i=1}^{n}{{({{x}_{i}}-\bar{x})}^{2}}}{n-1}}$
Wu et al., 2011;
Gao et al., 2019

2.2 Methods

2.2.1 Principles of establishing the regional system

To have a unified and comparable system, four principles are employed to guide the process (regionalization) of establishing the system. They are:
(1) Principle of systematics: the system is formed by the interactions and connections among different risk events. (2) Principle of dominant factor(s): some factor(s) may play major roles in the system for which changes in the factor(s) may result in significant changes in the entire system. (3) Principle of spatial continuity: the whole region, no matter divided or merged, is required to ensure the spatial continuity as an individual, which cannot be repeated and has no omissions. (4) Principle of relative consistency: because no absolute homogeneity exists in any climate change risk area, the intraregional similarities should be high and interregional differences should be as large as possible.

2.2.2 Design of the regional system hierarchical structure

The Regional System of Comprehensive Climate Change Risk is designed as a three-grade hierarchical system. The first-grade unit is the sensitive region where climate change would be more active. The second-grade unit is the dangerous region for serious extreme events. The third-grade unit is the risk region to indicate what risk receptors would be affected. According to the process of climate change risk formation and receptor influence, climate change increases the risk driving forces, which are reflected in the first-grade units of the regional system. Extreme events are the main sources of risk occurrence, which are accounted for in the second-grade unit. The possible loss of the risk receptors and their degrees of impact are reflected in the third-grade unit of the system. By formulating the spatial similarity and risk difference identification principles, the spatial unit hierarchy is established.

2.2.3 Indicators for the regional system hierarchical units

Climate change risk is composed of risk factors, i.e., the intensity of climate change scenarios and extreme events, and the vulnerability and exposure of risk receptors. In this study, the first-grade unit was designed as a region sensitive to climate change, the driving force of risk occurrence; its spatial pattern reflected the climate change sensitivity. Air temperature and precipitation are taken as sensitive indicators. The least-squares fitting method is used to calculate the change rates of these sensitive indicators under 1.5℃ and 2.0℃ warming, respectively. Taking the average temperature change rate of all grid cells in China as the classification standard, a warming rate higher than the national average was designated a sensitive area of fast warming (FW), and a lower rate is a sensitive area of slow warming (SW). The precipitation variations are divided into increasing precipitation (IP) or decreasing precipitation (DP) sensitive regions.
The second-grade unit is the dangerous region for extreme events, the intensity of which reflects the severity of climate change. The frequency and intensity of drought, high temperature, heat wave, and flood or extreme precipitation are taken as indicators to divide the dangerous regions for extreme events. A comprehensive meteorological drought index (AQSIQ and SAC, 2006), high-temperature heat wave index (AQSIQ and SAC, 2012), and flood index are selected to calculate the frequency of mild, moderate, and severe occurrences of these events, and then the severity of these extreme events in different regions was calculated by superposition analysis using a weighting principle.
The third-grade unit is the risk region. Vulnerability and exposure of the risk receptors reflect the risk of possible loss, which are taken as indicators for the risk region. That is, possible economic, ecological, and population losses caused by drought, high temperature, heat wave, and flood.

2.2.4 Building the system with top-down and bottom-up methods

The top-down method delineates a region into several subregions according to some criteria (Figure 1a). In early regionalization attempts, most geographers took this approach (Lin, 1954; Luo, 1954; Huang, 1959; Ren et al., 1982; Hou et al., 1988). In the 1980s, the land types were combined into natural communities, step by step, forming a bottom-up zoning method (Zhao, 1983). The bottom-up method is sketched in Figure 1b. In this work, both methods are combined into a top-down and bottom-up method. The first-grade units were generated in three steps: (1) overlapping the relevant maps such as temperature and precipitation scenario maps; (2) checking the four scenario types, as follows: FW and IP, FW and DP, SW and IP, and SW and DP; and (3) modifying the boundaries between the spatial distributions of the types to form the spatial pattern. Within the first-grade units, top-down method is also applied to divide several second-grade units according to the possibility for, and intensity of, extreme drought, high temperature, heat wave, and flood. Bottom-up methods is applied while generating a third-grade unit to merge the grid-based risks within a second-grade unit into several third-grade units.
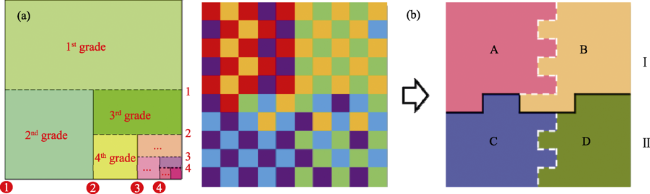
Figure 1 Schematic for methods of top-down dividing (a) and bottom-up merging (b)

2.2.5 Comprehensive risk composition and expression

The comprehensive climate change risk was composed from the possible losses of population, economy, food production, and ecology risk receptors. Grid-based risks have been projected in previous work (Wu et al., 2018; 2019a). To merge different risks of a grid into comprehensive risk, comprehensive risk levels are combined with the four risk receptors. The merging rule is that three or four risk receptors at the high-risk level indicate high comprehensive risk (H with red cells in Table 2). Two risk receptors at the high-risk level indicate medium-high comprehensive risk (H with orange cells in Table 2). One risk receptor at the high-risk level, or three or four at the medium-risk level, indicate medium comprehensive risk (H and M with dark-yellow cells in Table 2). Two risk receptors at the medium-risk level indicate medium-low comprehensive risk (M with yellow cells in Table 2). One risk receptor at the medium-risk level or below indicates low comprehensive risk (M with grey in Table 2). Blank cells represent lower risk levels than the noted cells. Regions are named in order of higher risk level, while equivalent risk levels were ranked in order of population, GDP, food production, and ecosystem.
Table 2 The different risk receptor compositions of the comprehensive risk levels
Comprehensive risk levels Population P/p GDP G/g Ecosystem E/e Food F/f
High risk H H H H
H H H
H H H
H H H
H H H
High-medium risk H H
H H
H H
H H
H H
H H
Medium risk H
H
H
H
M M M M
M M M
M M M
M M M
M M M
Medium-low risk M M
M M
M M
M M
M
M M
Low risk M
M
M
M

Note: H—high risk for a single risk receptor; M—medium risk for a single risk receptor

2.2.6 Region naming

Region naming is an important measure to express the system clearly and systematically. The sensitive regions are named with main toponym and the changing scenarios of temperature and precipitation and marked with Roman letters such as I, II and III etc. The tar- gets of 1.5℃ and 2.0℃ temperature rise for the regions are indicated by 15 and 20, respectively. Within a sensitive region, the dangerous regions are named with the main extreme events, in order of intensity level of the events. In the names of the regions, intensity of the comprehensive intensity of the events is noted, such as high, medium or low dangerous regions. Within a dangerous region, the comprehensive risk regions are named with the main risk receptors and their comprehensive risk levels. P stands for population, G for GDP, E for ecosystem, and F for food production. The absence of any of the risk receptors means that the missing one(s) is (are) not the main risk receptor(s) in the region. The receptors are listed by their importance in a region (Tables 3 and 4; Figures 2-7).
Table 3 Comprehensive risk regions under the 1.5℃ temperature warming target
First-grade unit:
climate sensitive region
Second-grade unit:
extreme event dangerous region
Third-grade unit:
comprehensive risk region
I15 Northeast fast warming and decreasing precipitation region I115 Flood-drought medium dangerous region I1fg15 FG medium-risk region
I1g15 G medium-low-risk region
I1eg15 EG medium-risk region
I1g15 G low-risk region
I1pg15 PG medium-risk region
I215 Heat-drought-flood medium dangerous region I2pg15 PG medium-low-risk region
I2pg15 PG medium-risk region
II15 East slow warming
and increasing precipitation
region
II115 Drought-flood medium dangerous
region
II1pg15 PG medium-risk region
II1pg15 PG medium-high-risk region
II215 Heat-drought-flood low dangerous region II2p15 P low-risk region
II2pgf15 PGF medium-high-risk region
II315 Heat-drought high dangerous region II3pg15 PG medium-low-risk region
II3ef15 EF medium-high-risk region
II3pgf15 PGF medium-high-risk region
II3pgf15 PGF high-risk region
II3pg15 PG medium-high-risk region
II415 Flood-heat high dangerous region II4pg15 PG medium-high-risk region
II4pgf15 PGF high-risk region
II4pgef15 PGEF high-risk region
II4pge15 PGE high-risk region
II515 Heat-flood medium dangerous region II5gf15 EF medium-high-risk region
II5pgef15 PGEF high-risk region
II5cd15 FE medium-risk region
III15 Zhejiang-Hunan-
Guizhou fast warming
and increasing precipitation
region
III115 Heat-drought high dangerous region III1pge15 PGE high-risk region
III1pgf15 PGF high-risk region
III215 Flood-heat-drought medium-high
dangerous region
III2fpg15 FPE medium-risk region
III2pgef15 PGEF high-risk region
IV15 Southeast slow
warming and increasing
precipitation region
IV115 Drought-heat-flood medium dangerous region IV1pg15 medium-high-risk region
IV1ef15 medium-high-risk region
IV215 Flood-heat-drought medium-high
dangerous region
IV2pe15 medium-high-risk region
IV2pgef15 PGEF high-risk region
V15 Yunnan-Guangxi- Guangdong-Hainan fast warming and decreasing precipitation region V115 Drought medium dangerous region V1pgef15 PGEF high-risk region
V215 Heat medium dangerous region V2epg15 EPG medium-risk region
V2gef15 GEF high-risk region
V315 Flood-heat high dangerous region V3pgef15 PEF high-risk region
V3da15 FP medium-low-risk region
VI15 North fast warming
and increasing precipitation region
VI15 Heat-drought medium-high dangerous
region
VI1pg15 PG medium-low-risk region
VI1f15 F medium-risk region
VI1p15 P low-risk region
VI215 Heat-drought-flood low dangerous region VI2ge15 GE low-risk region
VI315 Heat high dangerous region VI3pf15 PF medium-low-risk region
VI3pg15 PG low-risk region
VI3g15 G low-risk region
VI415 Heat-drought medium dangerous
region
VI4pg15 PG low-risk region
VI4pg15 PG medium-low-risk region
VI4e15 E low-risk region
First-grade unit:
climate sensitive region
Second-grade unit:
extreme event dangerous region
Third-grade unit:
comprehensive risk region
VII15 West Qinghai-Tibet fast warming and decreasing
precipitation region
VII115 Heat-drought medium-high dangerous region VII1fp15 FP medium-low-risk region
VII215 Drought medium dangerous region VII2pf15 PF low-risk region
VII315 Heat-drought low dangerous region VII3p15 P low-risk region
VIII15 East Qinghai-Tibet slow warming and increasing
precipitation region
VIII115 Heat-drought low dangerous region VIII1pf15 PF low-risk region
VIII215 Drought medium-high dangerous region VIII2epg15 EPG medium-risk region
VIII2pg15 PE low-risk region
VIII2p15 P medium-low-risk region
IX15 Southeast Tibet slow
warming and decreasing
precipitation region
IX115 Drought high dangerous region IX1pg15 PG medium-low-risk region
IX1pg15 PG medium-risk region
IX1epg15 EPG medium-risk region
IX1ef15 EF medium-high-risk region
IX215 Flood high dangerous region IX2pgf15 PGF high-risk region

Note: E/e—ecological; F/f—food; G/g—GDP; P/p—population

Table 4 Comprehensive risk regions under the 2.0℃ temperature warming target
First-grade unit:
climate sensitive region
Second-grade unit:
extreme event dangerous region
Third-grade unit:
comprehensive risk region
I20 Northeast fast warming
and increasing precipitation
region
I120 Flood-drought-heat low dangerous
region
I1g20 G low-risk region
I220 Flood-heat-drought medium
dangerous region
I2p20 P low-risk region
I2pf20 PF medium-risk region
I2pg20 PG medium-risk region
I2gp20 GP medium-low-risk region
II20 North fast warming and
decreasing precipitation
region
II120 Heat medium dangerous region II1eg20 EG medium-risk region
II1g20 G low-risk region
II1pg20 PG medium-low-risk region
II220 Flood-heat-drought high dangerous region II2p20 P low-risk region
II2pg20 PG medium-high-risk region
II2pgf20 PGF high-risk region
III20 Middle slow warming
and decreasing precipitation
region
III120 Flood-drought medium dangerous region III1pg20 PG medium-low-risk region
III1ef20 EF medium-high-risk region
III220 Drought-flood medium-high
dangerous region
III2pgf20 PGF medium-high-risk region
III2pef20 PEF high-risk region
III2fp20 FP low-risk region
III2pfe20 PFE high-risk region
IV20 South slow warming
and increasing precipitation
region
IV120 Flood-heat-drought medium
dangerous region
IV1pfg20 PFG high-risk region
IV1pfe20 PFE high-risk region
IV220 Flood-heat-drought high dangerous region IV2pgf20 PGF high-risk region
IV2peg20 PEG high-risk region
IV2pefg20 PEFG high-risk region
IV2pfg20 PFG medium-high-risk region
IV2pgef20 PGEF high-risk region
First-grade unit:
climate sensitive region
Second-grade unit:
extreme event dangerous region
Third-grade unit:
comprehensive risk region
IV20 South slow warming
and increasing precipitation
region
IV320 Heat-drought medium dangerous
region
IV3fpg20 FPG medium-risk region
IV3epg20 EPG medium-risk region
IV3ef20 EF medium-high-risk region
IV3pgef20 PGEF high-risk region
IV420 Drought high dangerous region IV4efp20 EFP medium-high-risk region
V20 North Xinjiang fast
warming and decreasing
precipitation region
V120 Heat-drought high dangerous region V1pge20 PGE low-risk region
V1fpge20 FPGE medium-risk region
V1pge20 PGE medium-risk region
V220 Heat high dangerous region V2fp20 FP medium-risk region
VI20 Middle North fast
warming and increase
precipitation region
VI120 Heat high dangerous region VI1f20 F medium-risk region
VI1pge20 PGE low-risk region
VI220 Drought medium dangerous region VI2pge20 PGE low-risk region
VI2g20 G medium-low-risk region
VII20 East and North Qinghai-Tibet slow warming and increasing precipitation region VII120 Drought medium dangerous region VII1pge20 PGE low-risk region
VII220 Drought high dangerous region VII2pg20 PG medium-risk region
VII2epg20 EPG medium-risk region
VII2fpg20 FPG medium-risk region
VIII20 Southwest Tibet fast warming and increasing
precipitation region
VIII120 Heat medium dangerous region VIII1pge20 PGE low-risk region
VIII1p20 P medium-low-risk region
VIII220 Drought-flood medium dangerous region VIII2ge20 GE low-risk region
IX20 Southeast Tibet fast
warming and decreasing
precipitation region
IX120 Drought high dangerous region IX1p20 P low-risk region
IX1p20 P medium-low-risk region
IX220 Flood high dangerous region IX2pge20 PGE high-risk region
IX2pe20 PE low-risk region

Note: E/e—ecological; F/f—food; G/g—GDP; P/p—population

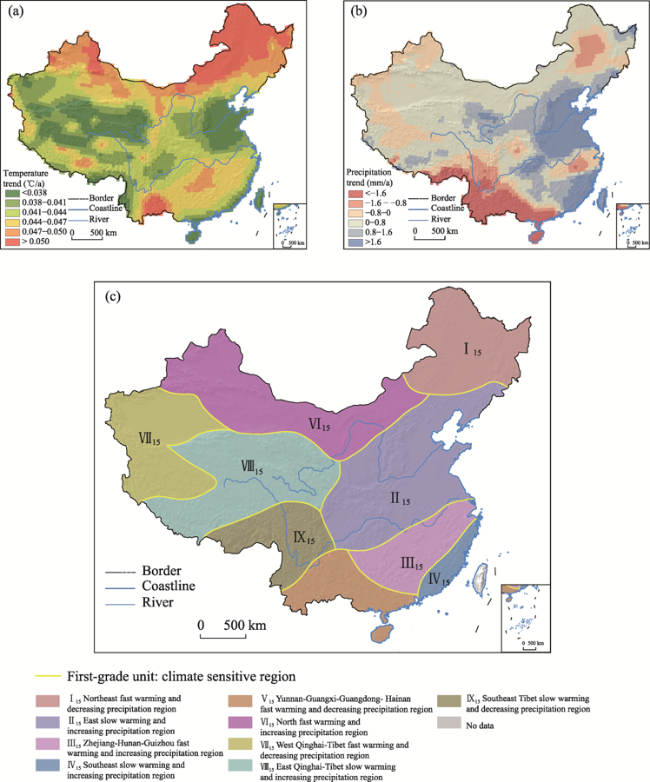
Figure 2 Climate change sensitive areas under the 1.5℃ warming target: (a) reddish, brownish, and yellowish areas show above-average warming rates, while greenish areas show below-average warming rates; (b) The bluish areas are areas of increasing precipitation, and the reddish and brownish areas are areas of decreasing precipitation; (c) Comprehensive sensitive areas
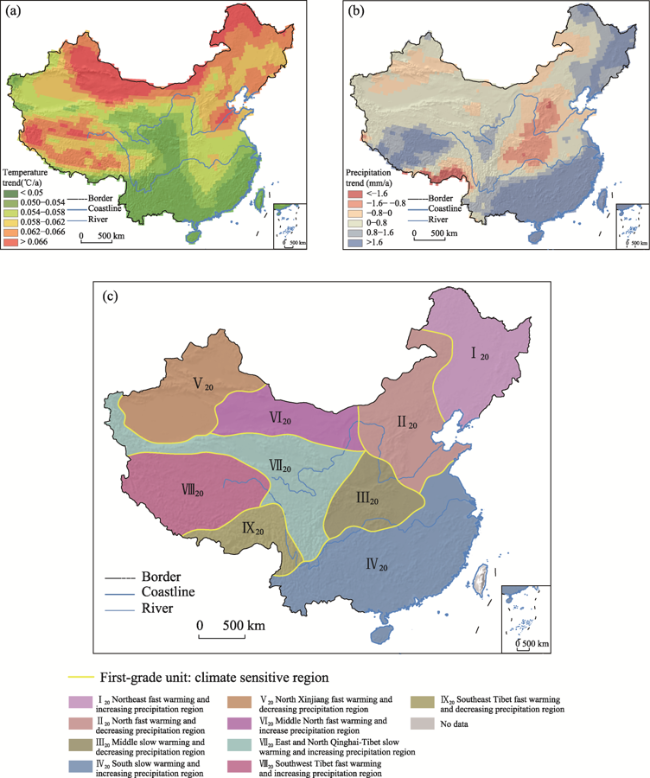
Figure 3 Climate change sensitive areas under the 2.0℃ warming target: (a) reddish, brownish, and yellowish areas show above-average warming rates, while greenish areas show below-average warming rates; (b) The bluish areas are areas of increasing precipitation, and the reddish and brownish areas are areas of decreasing precipitation; (c) Comprehensive sensitive areas
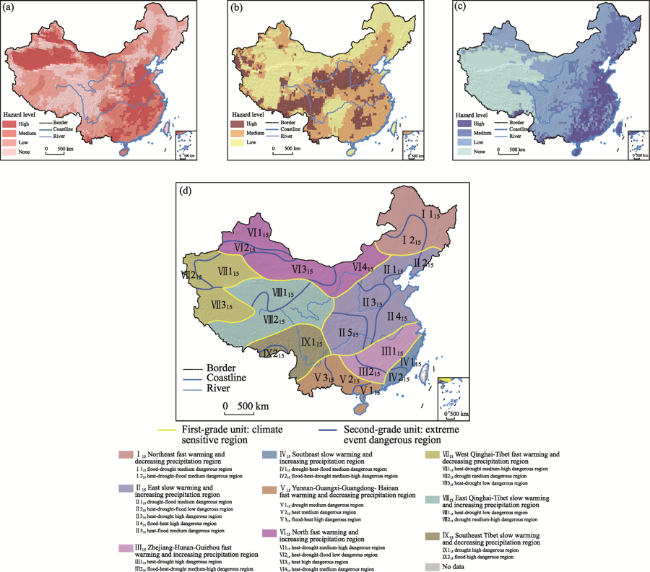
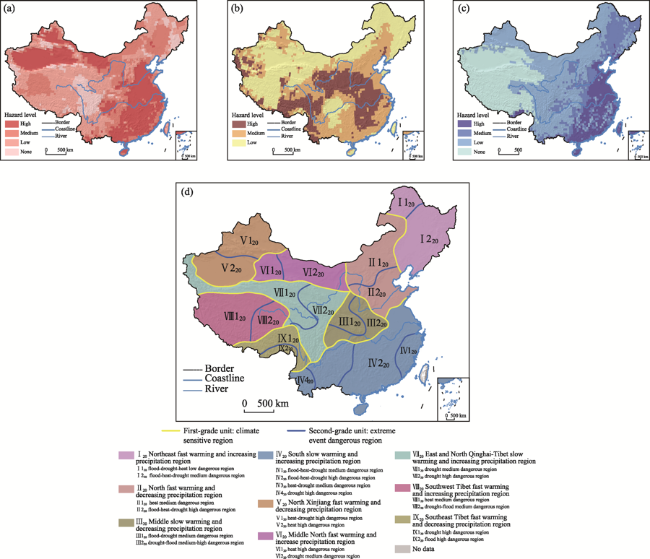
Figure 4 Spatial patterns of extreme event severity levels for heat wave (a), drought (b), and flood (c); and comprehensive severity regions under the 1.5℃ warming target (d)
Figure 5 Spatial patterns of extreme event severity levels for (a) heat wave, (b) drought, and (c) flood; and (d) comprehensive severity regions under the 2.0℃ warming target
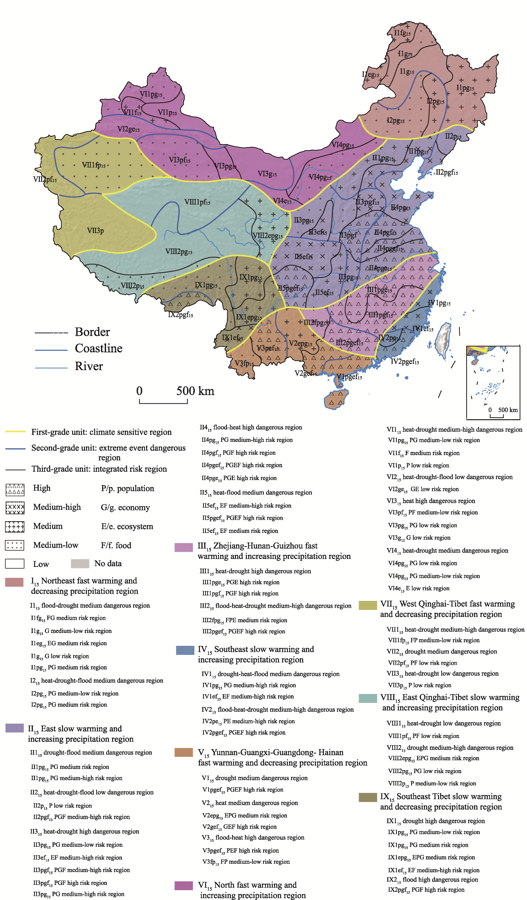
Figure 6 Comprehensive risk pattern of climate change in China under the 1.5℃ global warming target
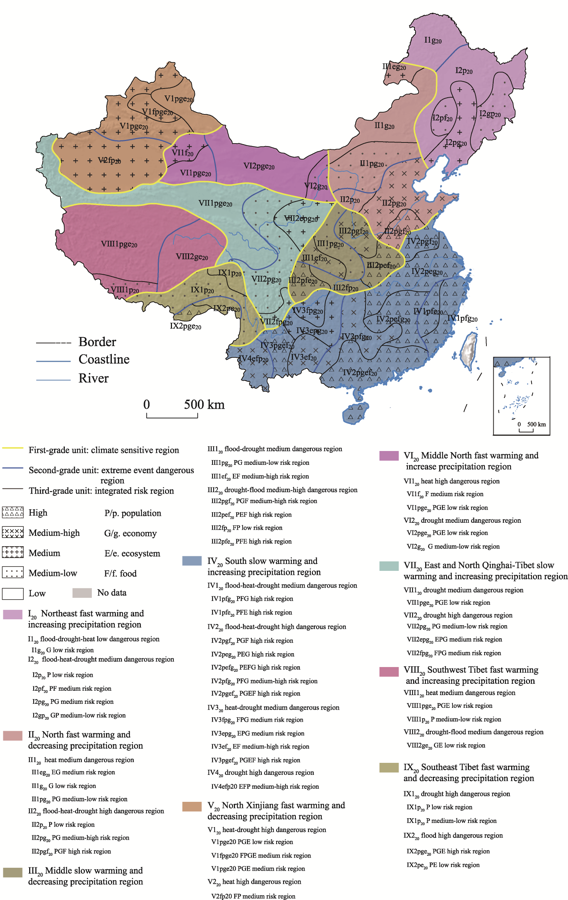
Figure 7 Comprehensive risk pattern of climate change in China under the 2.0℃ global warming target

3 Results

3.1 Spatial pattern of climate change sensitivity in China under the two warming targets

Both the regional systems reveal that there would be a general warming trend across China under the 1.5℃ and 2.0℃ targets. For the 1.5℃ target scenario, the warming would be most obvious in northeastern and northwestern China, with a corresponding significant precipitation decreases in southwestern, southern, and northeastern China, and significant precipitation increases in the Huang-Huai-Hai region and southeastern China. For the 2.0℃ target scenario warming would be also obvious in northwestern and northeastern China, but would extend to North China. Moreover, the warming would be also significant over most of the Qinghai-Tibet Plateau. Under the 2.0℃ target, the precipitation pattern changed significantly. Precipitation would increase significantly in northeastern and South China, while precipitation decreased significantly in the Huang-Huai-Hai Plain, central China, and southeastern Tibetan Plateau ( Figures2 and 3).
The FW area (faster than the average warming rate) increases by approximately 40% from 4 million km2 in the 1.5℃ scenario to 5.6 million km2 in the 2.0℃ scenario (Figures 2a and 3a). The fast-increasing temperature in the Qinghai-Tibet Plateau might be the main reason. The DP area would increase from 2.4 million km2 to 3.3 million km2, mainly because precipitation would decrease significantly in central and eastern China. Accordingly, the IP area would decrease from 7.2 million km2 to 6.3 million km2, and the center of the IP area would shift from the North China Plain to the southern Changjiang River region (Figures 2b and 3b).
Considering the scenarios of both temperature increase and precipitation increase/decrease, comprehensive sensitive areas are generated as Figures 2c and 3c.

3.2 Spatial patterns of extreme event severity under the two warming targets in China

Based on the possibility for and the intensity of extreme events of drought, high temperature, heat wave, and flood, the severity levels of extreme events are divided into three levels: severe, moderate and light. The spatial patterns of extreme event severity under the two warming targets are obtained by combining the different intensities of extreme events (Figures 4 and 5).
The composition of extreme events, such as heat, drought, and flood, was indicated in the naming of regions. The intensity of extreme events under different warming targets was superimposed, and the comprehensive risk areas were obtained (Figures 4 and 5; Tables 3 and 4). Results indicate that under the two warming targets, there is not much difference in the severity for northeastern China. Drought severity would increase in North and Central China, while the risk of flooding would increase significantly in South China. The temperature factor of the Qinghai-Tibet Plateau would increase obviously. Although precipitation would increase, the flood severity would not be significant, and only a small area in southeastern
Tibet would be at high flood severity. Other parts of western China would have little change, but overall heat waves and droughts would be increasing in intensity.

3.3 Spatial patterns of China’s comprehensive risks under the two warming targets

High temperature, heat wave, and flood events are the main risk sources for the population risk receptor. The spatial patterns of comprehensive risks reveal that high risk to the popula- tion would occur in eastern China. The population distribution of China is approximately divided by a line from Heihe in Heilongjiang Province to Tengchong in Yunnan Provence, with a large population on the southeastern side and a small population on the northwestern side. The population distribution would remain unchanged in the future.
Drought and flood events would be the main risk sources for GDP receptors. The spatial patterns of comprehensive risks also suggest that eastern and central China would face higher GDP risk in the future because of higher exposure, due to the differences in regional development and because China’s economy is mainly distributed in the eastern and central regions.
The spatial patterns of comprehensive risks indicate that for the 1.5℃ target, the distribution of higher ecological risk regions would not change much compared with the current situation, but the ecological risk would increase in Hulun Buir, the northeastern Qinghai-Tibet Plateau, Central China and Southern East China, and Southern China. For the 2℃ target, the ecological risk level in southern Central China, western and northeastern China, and the northeastern Tibetan Plateau would further increase, and the risk level of the middle and lower reaches of the Changjiang River Basin would decrease.
The spatial patterns of comprehensive risks reveal that for the 1.5℃ target, the areas with higher food production risk would increase, especially in the western part of northwestern China and the southern Changjiang River Basin, while the risk level decreased slightly in the northern part of Northeast China. For the 2.0℃, target, the distribution range of the areas with higher food production risk level increased further, mainly concentrated in the central part of the Northeast China Plain and south of the Yangtze River, while the risk level decreased slightly in the northern part of Northeast China and the Sichuan Basin.
The regional patterns of comprehensive climate change risk in China under the 1.5℃ and 2.0℃ warming targets were obtained by combining the comprehensive risk from all the grids (Figures 6 and 7; Tables 3 and 4).
Under the 1.5℃ target, the comprehensive high-risk area would be more than 1.6 million km2, mainly distributed in East China, South China, and central China in the regions of II3pgf15, II4pgf1, II4pgef15, II4pge15, II5pgef15, III1pge15, III1pgf15, III2pgef15, IV2pgef15, V1pgef15, V2gef15, and V3pgef15. Among them, the population, GDP, ecology, and food production of the Huaihe River Basin, eastern South China, and the Sichuan Basin would be at high risk. GDP, ecology, and food production would be at high risk in western South China. The population, GDP, and food production would be at high risk in the southern part of the North China Plain, the central part of the southern Changjiang River Basin, and southern Tibet. The high-risk area would cover approximately 900,000 km2, mainly distributed in the Bohai Rim, Qinling Mountains, and southeastern coastal areas. The risks in the central North China Plain and Liaodong Peninsula would be mainly from population, GDP, and food production. The risks in the Bohai Rim and Zhejiang Province would be mainly from population and GDP, and the risks in the Qinling Mountains and Guanzhong Plain are mainly from ecology and food production (Figure 6).
Under the 2℃ rising target, the high-risk regions would be almost the same size as those of the 1.5℃ target (1.62 million km2), mainly in the regions of II2pgf20, III1ef20, III1ef20, III2pfe20, IV1pfg20, IV1pfe20, IV2pgf20, IV2pge20, IV2pgef20, IV3ef20, IV3pgef20, and IX2pge20. Spatially, the southeastern regions would be upgraded to high risk, compared to the 1.5℃ target. Eastern South China, northern Central China, and eastern Yunnan Province would be at high risk for population, GDP, ecology, and food production. Population, GDP, and food production would be at high risk in the Huaihe River Basin and the southeastern coastal region. The population, GDP, and ecology would be at high risk in southern Tibet; and the population, ecology, and food production would be at high risk in the Sichuan Basin and northern Central China. The high risk area covers approximately 1.03 million km2, mainly due to the increased risk level in southwestern China. The risks in the central North China Plain and Liaodong Peninsula would be mainly from population, GDP, and food production. The risks in the Bohai Rim and Zhejiang Province would be mainly from population and GDP. In the Qinling Mountains the risks would be mainly from ecology and food production. The risks in the Guanzhong Plain would be mainly from population, GDP, and food production. The risks in the North China Plain would be mainly from population and GDP. The risks in western Yunnan Province would be mainly from population, ecology, and food production. The risks in the eastern part of Southwest China would be mainly from ecology and food production (Figures 6 and 7).

4 Discussion

The process of building a terrestrial system is known as regionalization (Zheng et al., 2008). This work considers the components of climate change risk: severity, vulnerability, and exposure, and then constructs a regionalization index and hierarchical system based on the classical methodology of comprehensive natural terrestrial system research. The possibility, spatial distribution, and intensity of extreme high temperature/heat wave, drought, or precipitation events, which were the most typical, widely distributed events that would be influenced by climate change, were selected to express the severity. In fact, there are many other meteorological and hydrological disasters, such as freezing, typhoon, hail, snow, storm surge, and so on, which might be related to climate change; but, due to their local distribution, they are not included in this study.
Extreme events are the main risk sources for social and economic losses caused by climate change, which are generally manifested as population migration, casualties, and GDP loss. GDP loss in this work not only includes the loss of agricultural production but also the possible loss of secondary and tertiary industries. In addition, the risk to food production in this work is based on the crop model to simulate output changes under the scenario of climate change, which is different from the loss of agricultural GDP caused by extreme events. It is viewed from another perspective on climate change risk. Based on research and data accumulation, drought mainly causes economic loss and high temperature results primarily in adverse impacts on people’s health. The comprehensive risk region of the risk receptors is the basic unit of the comprehensive climate change risk regional system. Population, economy, food, and ecology were chosen as the risk receptors based on the ultimate objectives connotation of the UNFCCC. Even so, future climate change risk regionalizations could be based on different objectives, which might not be limited to these four risk receptors. In the process of future regionalizations, the number of risk receptors should be appropriately increased according to regional characteristics and more targeted risk assessments should be carried out.
The regional pattern of comprehensive climate change risk has obvious timescale characteristics. Thirty years is generally considered the shortest period for climate change research. This study selects the period of 2021-2050 to carry out the research. The IPCC generally takes 1991-2020 as the near term, 2021-2050 as the medium term, and 2051-2080 as the long term (IPCC, 2007). In 2022, 2021-2050 should be taken as the near term, the time when all of humanity must start tackling climate change immediately. However, this does not mean that all climate change risk regionalization should be carried out on such timescales. There may be different climate change risk patterns in different periods, so different climate change risk regionalization schemes need to be presented. The timescale of climate change risk regionalization should be selected according to the needs of different regions and targets.
In addition, geographic information systems (GIS) and other technologies play an important supporting role in the regional demarcation during the generation of climate change risk patterns. Some artificial intelligence and fuzzy clustering methods were used to simulate the expert’s comprehensive analysis of multiple factors and boundary divisions in traditional land surface patterns, to reduce the uncertainty of the subjective regionalization. However, the computer-aided recognition function could not completely replace human experience and knowledge. The high comprehensiveness and generality of the delimitations made it necessary to combine spatial information technology with expert experience and knowledge to get satisfactory spatial patterns. The application of artificial intelligence and automation would be an important technical means to achieve breakthroughs in comprehensive risk spatial pattern development in the future.

5 Conclusions

Based on the RCP8.5 scenario from 2021 to 2050, and with reference to natural geomorphic units and topographic features, a regional comprehensive risk system has been constructed for the global warming targets of 1.5℃ and 2.0℃. The system has three grades, including the climate change sensitive regions for temperature and precipitation trends and rates; dangerous regions for drought, high temperature, heat wave, and flood; and comprehensive risk regions for population, GDP, food production, and ecosystem. The main conclusions include the following:
(1) Climate change risks come from the degree of change and the risk receptor status. Therefore, the risks show significant spatial differences.
(2) The high-risk regions are mainly distributed in East, South, and central China, while the medium-high-risk regions are mainly in North and southwestern China.
(3) The comprehensive climate change risks are related not only to the possibility for, and intensity of, climate change but also to social and economic conditions. Although extreme events, such as heat wave and drought, would occur in western China, the population risk is still not as serious as in eastern China.
(4) Risks would increase with the warming levels. Under the 2℃ warming target, more than 1/4 of China’s area would be at high or medium-high risk, which would be more severe and extensive than the risks under the 1.5℃ warming target.

Acknowledgment

Climate scenario data in this research were collected and available at the Earth System Grid Federation data node at the Lawrence Livermore National Laboratory (https://esgf-node.llnl.gov/search/esgf-llnl/). Socioeconomic scenario data were retrieved from the Center for Global Environmental Research, National Institute for Environmental Studies (http://www.cger.nies.go.jp/gcp/population-and-gdp.html). Global mean surface temperature data were obtained from the Met Office Hadley Centre and the Climatic Research Unit at the University of East Anglia (http://www.cru.uea.ac.uk/). Mean surface temperature of China data from Tang et al. (2009) were available and cited in the text. Land use data are available from the Resources and Environmental Sciences Data Center of the Chinese Academy of Sciences (http://www.resdc.cn/data.aspx?DATAID=184. All rights reserved. (http://www.resdc.cn/data.aspx?DATAID=184). The disaster statistics data were provided by China National Commission for Disaster Reduction (http://www.ndrcc.org.cn/zqtj/index.jhtml). The authors acknowledge all the groups for producing and sharing their datasets.
[1]
Bailey R G, 1996. Ecosystem Geography. New York: Springer-Verlag.

[2]
Climate Action Tracker, 2017. Improvement in warming outlook as India and China move ahead, but Paris Agreement gap still looms large.Retrieved from https://climateactiontracker.org/documents/61/CAT_2017-11-15_ImprovementInWarmingOutlook_BriefingPaper.pdf.

[3]
Edenhofer O, Seyboth K, 2013. Intergovernmental Panel on Climate Change (IPCC). Encyclopedia of Energy Natural Resource & Environmental Economics, 26(D14): 48-56.

[4]
Edmonds J, 2011. The representative concentration pathways: An overview. Climatic Change, 109(1/2): 5-31.

DOI

[5]
General Administration of Quality Supervision, Inspection and Quarantine of the People’s Republic of China AQSIQ, Standardization Administration of the People’s Republic of China SAC, 2006. Classification of Meteorological Drought (GB/T 20481-2006). Beijing: China Standards Press.

[6]
General Administration of Quality Supervision, Inspection and Quarantine of the People’s Republic of China AQSIQ, Standardization Administration of the People’s Republic of China SAC, 2012. Grade of the Heat Wave (GB/T 29457-2012). Beijing: China Standards Press.

[7]
Giddens A, 2009. The Politics of Climate Change. Routledge.

[8]
Holdridge L R, 1967. Life Zone Ecology. San Jose: Tropical Science Center.

[9]
Hou Xueyu, 1988. Physical Ecological Regionalization and Macro-agricultural Developing Strategy in China. Beijing: Science Press. (in Chinese)

[10]
Hou Xueyu, Jiang Shu, Chen Changdu. 1963. Suggestion on the developing direction of agriculture, forestry, animal husbandry, sideline production and fishery in different regions of China. Chinese Science Bulletin, (9): 8-26. (in Chinese)

[11]
Huang Bingwei, 1959. Draft of the integrated physical geographical regionalization of China. Chinese Science Bulletin, 18: 594-602. (in Chinese)

[12]
Huang Bingwei, 1989. Outline of the comprehensive physical geographical regionalization of China. Collected Works of Geography, 21: 10-20. (in Chinese)

[13]
IPCC, 2007. Climate Change 2007: Impacts, Adaptations and Vulnerability: Contribution of Working Group II to the Fourth Assessment Report of the IPCC, Cambridge, Britain: Cambridge University Press.

[14]
IPCC, 2012. Managing the Risks of Extreme Events and Disasters to Advance Climate Change Adaptation:A Special Report of Working Groups I and II of the Intergovernmental Panel on Climate Change. Cambridge and New York: Cambridge University Press.

[15]
IPCC, 2014a. Climate Change 2014:Impacts, Adaptation, and Vulnerability. Cambridge and New York, USA: Cambridge University Press.

[16]
IPCC, 2014b. Climate Change 2014:Mitigation of Climate Change. Cambridge and New York, USA: Cambridge University Press.

[17]
IPCC, 2018. Global Warming of 1.5℃: An IPCC Special Report on the Impacts of Global Warming of 1.5℃ above Pre-industrial Levels and Related Global Greenhouse Gas Emission Pathways, in the Context of Strengthening the Global Response to the Threat of Climate Change, Sustainable Development, and Efforts to Eradicate Poverty. Cambridge and New York, USA: Cambridge University Press.

[18]
IPCC, 2021. Climate Change 2021: The Physical Science Basis. In: Masson-Delmotte V, Zhai P, Pirani A et al. (eds.). Contribution of Working Group I to the Sixth Assessment Report of the Intergovernmental Panel on Climate Change. Cambridge: Cambridge University Press. https://www.ipcc.ch/report/ar6/wg1/downloads/report/IPCC_AR6_WGI_Full_Report.pdf.

[19]
Gao Jiangbo, Liu Lulu, Wu Shaohong, 2020. Hazards of extreme events in China under different global warming targets, Big Earth Data, https://doi.org/10.1080/20964471.2020.1769254.

[20]
Kahn M E, 2016. The climate change adaptation literature. Review of Environmental Economics and Policy, 10(1): rev023, doi: 10.1093/reep/rev023.

DOI

[21]
Köppen W, 1931. Grundrissder Klimakunde. Berlin: Walterde Gruyter.

[22]
Li K, Wu S, Dai E et al., 2012. Flood loss analysis and quantitative risk assessment in China. Natural Hazards, 63(2): 737-760.

DOI

[23]
Lin Chao, 1954. Outline of the physical geographical regionalization. Acta Geographica Sinica, 20(4): 395-418. (in Chinese)

[24]
Luo Kaifu, 1954. Draft of the physical geographical regionalization of China. Acta Geographica Sinica, 20(4): 379-394. (in Chinese)

[25]
Murakami D, Yamagata Y, 2019. Estimation of gridded population and GDP scenarios with spatially explicit statistical downscaling. Sustainability, 11(7): https://doi.org/10.3390/su11072106.

[26]
O’Neill B C, Kriegler E, Riahi K et al., 2014. A new scenario framework for climate change research: The concept of shared socioeconomic pathways. Climatic Change, 122(3): 387-400. https://doi.org/10.1007/s10584-013-0905-2.

DOI

[27]
Pindyck R, 2013. Climate change policy: What do the models tell US? Journal of Economic Literature, 51(3): 860-872: 813.

DOI

[28]
Qiu Baojian, 1986. A scheme of national agricultural comprehensive regionalization in China. Journal of Henan University (Natural Science), 16(1): 21-28. (in Chinese)

[29]
Raftery A E, Zimmer A, Frierson D M W et al., 2017. Less than 2℃ warming by 2100 unlikely. Nature Climate Change, 7(9): 637-641. https://doi.org/10.1038/nclimate3352.

DOI

[30]
Ren Mei’e, 1982. Outline of Chinese Physical Geography. rev ed.ed. Beijing: The Commercial Press. (in Chinese)

[31]
Ren Mei’e, Yang Renzhang, 1961. Physical geographical regionalization in China. Acta Geographica Sinica, 27: 66-74. (in Chinese)

[32]
Roderick M L, Sun F, Farquhar G D, 2012. Water cycle varies over land and sea. Science, 336(6086): 1230-1231.

DOI PMID

[33]
Sheffield J, Wood E F, Roderick M L, 2012. Little change in global drought over the past 60 years. Nature, 491(7424): 435-438.

DOI

[34]
Shi Xiaoli, Wu Shaohong, Dai Erfu et al., 2011. Risk assessment of carbon sequestration for terrestrial ecosystems from climate change in China. Geographical Research, 30(4): 601-611. (in Chinese)

DOI

[35]
United Nations, 2015. United Nations Framework Convention on Climate Change (UNFCCC), Paris Agreement.

[36]
Wu Shaohong et al., 2011. Comprehensive Risk Prevention:China’s Comprehensive Climate Change Risks. Beijing: Science Press, 2011.

[37]
Wu Shaohong, Gao Jiangbo, Deng Haoyu et al., 2018. Climate change risk and methodology for its quantitative assessment. Progress in Geography, 37(1): 28-35. DOI: 10.18306/dlkxjz.2018.01.004. (in Chinese)

DOI

[38]
Wu Shaohong, Liu Lulu, Gao Jiangbo et al., 2019a. Integrate risk from climate change in China under global warming of 1.5 and 2.0℃. Earth’s Future, https://doi.org/10.1029/2019EF001194. 7.

[39]
Wu Shaohong, Liu Lulu, Liu Yanhua, 2019b. The Belt and Road: Geographical pattern and regional risks. Journal of Geographical Sciences, 29(4): 483-495.

DOI

[40]
Wu Shaohong, Yang Qinye, Zheng Du, 2003. Delineation of eco-geographical regional system of China. Journal of Geographical Sciences, 13(3): 309-315.

DOI

[41]
Wu Shaohong, Yin Yunhe, Fan Jie et al., 2010. Retrospect and prospect of regionalization system of China. Geographical Research, 29(9): 1538-1545. (in Chinese)

DOI

[42]
Xi Chengfan, Zhang Junmin, Qiu Baojian et al., 1984. Outline of Physical Regionalization of China. Beijing: Science Press. (in Chinese)

[43]
Xiong W, Conway D, Holman I et al., 2008. Evaluation of CERES: Wheat simulation of wheat production in China. Agronomy Journal, 100(6): 1720. https://doi.org/10.2134/agronj2008.0081.

DOI

[44]
Yang Wenheng, Yang Qinye, 2014. History of Geography in China (Ancient Volume). Nanning: Guangxi Education Press. (in Chinese)

[45]
Zhao Songqiao, 1983. A new scheme for comprehensive physical regionalization in China. Acta Geographica Sinica, 38(1): 1-10. (in Chinese)

DOI

[46]
Zheng D, 1999. A Study on the Eco-geographic Regional System of China. FAOFRA 2000 Global Ecological Zoning Workshop. Cambridge.

[47]
Zheng Du, Yang Qinye, Wu Shaohong et al., 2008. China’s Eco-geographical Regionalization Research. Beijing: The Commercial Press. (in Chinese)

Outlines

/