Special Issue: Land for High-quality Development

Spatio-temporal variation prediction on Cd content in the rice grains from Northern Zhejiang Plain during 2014-2019 based on high-precision soil geochemical data

  • YIN Hanqin , 1, 2, 3 ,
  • LU Xinzhe , 2, 3, * ,
  • SUN Rui 2, 3 ,
  • HUANG Chunlei 1, 2, 3 ,
  • KANG Zhanjun 2, 3 ,
  • XU Mingxing 2, 3 ,
  • WEI Yingchun 2, 3 ,
  • CAI ZiHua 2, 3
Expand
  • 1. State Key Laboratory of Biogeology and Environmental Geology, China University of Geosciences, Wuhan 430074, China
  • 2. Technology Innovation Center of Ecological Evaluation and Remediation of Agricultural Land in Plain Area, MNR, Hangzhou 311200, China
  • 3. Zhejiang Institute of Geological Survey, Hangzhou 311200, China
*Lu Xinzhe (1988-), PhD and Postdoctoral Researcher, specialized in environmental geochemistry. E-mail:

Yin Hanqin (1978-), Senior Engineer, E-mail:

Received date: 2022-01-16

  Accepted date: 2022-09-14

  Online published: 2023-02-21

Supported by

Geological Prospecting Funds Program of Zhejiang Province, China(2018003)

Geological Prospecting Funds Program of Zhejiang Province, China(2020006)

Science and Technology Program of Department of Natural Resources of Zhejiang Province, China(2020-45)

Key R& D Program of Zhejiang Province, China(2021C04020)

Copyright

© 2023

Abstract

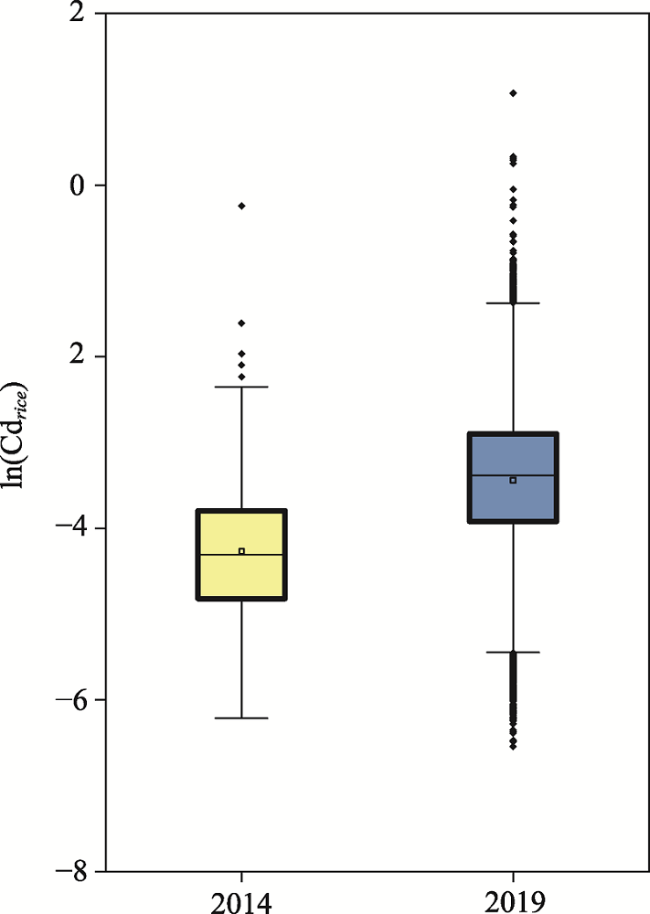
In recent years, Cadmium (Cd) pollution has been found in many soil geochemical surveys in Northern Zhejiang Plain, a crucial rice production area in East China, located in the lower Yangtze River. To more scientifically predict the effect of soil Cd on rice safety, data including 348 local rhizosphere soil-rice samples obtained in 2014 were used in this study. Meanwhile, we extracted 90% of random samples as variables based on soil Cd content (Cdsoil), soil organic matter (SOM), pH, and other indicators. In addition, a multivariate linear model for rice Cd content (Cdrice) prediction based on the indicators including the soil Cd content (Cdsoil), the soil organic matter (SOM), and the pH value. The remaining 10% of random samples were used for the significance test. Based on the 2014 soil Cd content (Cdsoil14) and the 2019 soil Cd content (Cdsoil19), this study predicted Cd content in 2019 rice grains (Cdp-rice19). The spatio-temporal variation of Cdrice was contrasted in the five years from 2014 to 2019, and the risk areas of rice safety production were analyzed using the Geographical Information System (GIS). The results indicated that compared with the actual Cd content in 2014 rice grains (Cdrice14), the proportion of Cdp-rice19, which exceeded the standard food level in China (GB2762-2017), increased dramatically. Moreover, the high-value areas of Cdrice distributed greatly coincidentally in these two years. By contrast, both Cdrice and Cdsoil show very different spatial scales. The dominant reason is the distribution of the local canal systems, indicating that economic activities and agricultural irrigation may aggravate the risk of soil Cd pollution, thus threatening safe rice production.

Cite this article

YIN Hanqin , LU Xinzhe , SUN Rui , HUANG Chunlei , KANG Zhanjun , XU Mingxing , WEI Yingchun , CAI ZiHua . Spatio-temporal variation prediction on Cd content in the rice grains from Northern Zhejiang Plain during 2014-2019 based on high-precision soil geochemical data[J]. Journal of Geographical Sciences, 2023 , 33(2) : 413 -426 . DOI: 10.1007/s11442-023-2089-7

1 Introduction

Rice safety caused by Cd pollution in the paddy field has increasingly aroused worldwide attention (Chunhabundit, 2016; Xiong et al., 2019; Zhu et al., 2019; Zou et al., 2021). Statistics show that China’s annual average of grains polluted by heavy metals has reached 12 million tons, and agricultural products with Cd exceeding the national standard may reach 1.5 million tons, among which the rice polluted by Cd is a severe problem (Hang et al., 2009; Lei et al., 2015; Wang et al., 2019; Guo et al., 2020). Rice has a more substantial tolerance and absorption capacity for Cd. Many studies have shown that the Cd-absorbing capacity of rice is significantly higher than other elements such as Cu, Pb, and As (Li et al., 2012; Wang et al., 2015; Ogunkunle et al., 2016; Lin et al., 2018; Xie et al., 2018). Hence, soil Cd pollution is prone to Cd enrichment in rice grains. It is an essential pathway for human exposure to Cd by eating Cd-polluted rice (Dudka et al., 1999; Zhang, 2018; Suwatvitayakorn et al., 2020). Chronic Cd ingestion negatively affects the respiratory tract, liver, kidney, kidney, and immune system (Satarug et al., 2019; Genchi et al., 2020; Halwani et al., 2020), and it has already become one of humanity's most threatening environmental pollutants (Stritsis et al., 2012; Williams et al., 2012).
In addition to Cdsoil, the absorption of Cd by rice is also affected by many other physical and chemical parameters, like soil pH, redox potential, SOM, cation exchange capacity (CEC), clay content, iron manganese oxide, and plant nutrients. All of these may remarkably influence the transfer and availability of Cd in the soil-plant system (Ding et al., 2013; Ke et al., 2015; Zhao et al., 2020). Numerous types of research have shown that the variation of Cd speciation in the soil is mainly subject to the soil pH (Tahervand et al., 2016; Shen et al., 2019; Ma et al., 2020; Hou et al., 2021). Besides, SOM mainly participates in the complexation or chelation process between soil Cd and various ionic groups, affecting its bioavailability. On the other hand, SOM also can influence the absorption and transport of Cd by rice roots by increasing the soil nutrient uptake, root exudates, and rhizosphere transpiration (Wang et al., 2015; Filipovic et al., 2018; Welikala et al., 2021).
Recently, soil pH and SOM have been selected as essential parameters to construct a multivariate linear model to predict rice's soil Cd absorption capacity in many kinds of research (McBride et al., 1997; Sauve et al., 2000; Xu et al., 2016; Xiong et al., 2019). Generally, the multivariate linear model's prediction accuracy based on finite parameters rests on factors such as field survey accuracy, sample representativeness, and spatial data variability (Brus et al., 2002; Li et al., 2004; Wen et al, 2015). It has been found (Caetano et al., 2014; Zhang et al., 2018) that the Monte Carlo simulation (McBride) simulation method can be used to determine the safety benchmark value for Cdsoil under different Cdrice compliance rates. The method is a process of simulating Cdsoil according to the random sampling theory by calculating the approximate solution through computer simulation based on the principle of probability theory. However, the spatio-temporal prediction of Cd in actual rice fields on the regional scale has been less studied (Zhao et al., 2009).
Northern Zhejiang Plain is a typical water network plain featuring low and flat terrain and a dense river network in the lower reaches of the Yangtze River, which is an important area in China for rice production. Previous studies of this area primarily focused on soil/sediment heavy metal pollution monitor and assessment in this area (Gao et al., 2002; Shi et al., 2007; Han et al., 2017), limited to earlier partial survey scope, there is rarely research assessed the risk of rice safety production in the vast land (Li et al., 2013; Xia et al., 2019). Besides the strict requirements of rice grains in sampling time, sample preparation, pretreatment, and maintenance, it is much more challenging to measure the rice Cd content than that of soil. As we all know, rice is planted diversely. Thus, it is challenging to realize high-density rice quality and safety surveys on a regional scale (Zhao et al., 2015; Xia et al., 2019). Meanwhile, due to regional differences in soil properties and planting patterns, the application of national soil environmental quality standards cannot effectively assess the risk to regional rice safety (Song et al., 2019; Zhu et al., 2019; Lu et al., 2021). Based on the local survey data, including Cdsoil, soil mineral components, and physical and chemical parameters, combined with existing Cdrice, modeling the rice Cd prediction with the Cdsoil as the variable has been incorporated into the regional environmental management for assessing the risk of Cd in rice (Li et al., 2011; Pelfrêne et al., 2013; Jya et al., 2020; Wang et al., 2020; Wu et al., 2021).
Hence, this paper used Northern Zhejiang Plain as a monitoring area and endeavored to (1) construct a model for predicting Cdrice by using the McBride simulation method (McBride, 2002) based on small sample size data; (2) predict the Cdrice on the regional scale from the soil samples with the large sample size which collected in 2019; (3) investigate the spatio-temporal variation of Cdsoil and Cdrice during 2014-2019.

2 Materials and methods

2.1 Study area and sample collection

The study area, Northern Zhejiang Plain, is located in the north of Hangzhou Bay, Zhejiang Province of East China. It is a typical water network plain featuring low and flat terrain and dense river network in the lower reaches of the Yangtze River, which is also an important area for rice production in China. The study area covers an area of 6424.9 km2, including 2770.9 km2 cultivated land and about 505 km2 water area, accounting for 43.10% and 7.90%, respectively.
As shown in Figure 1, in November 2014, 348 pairs of rice-root soil collaborative samples were collected systematically in some large rice fields during the rice maturity period. The rice variety is mostly local japonica rice, also called “Xiushui 134”, with the largest planting scale in Northern Zhejiang Plain.
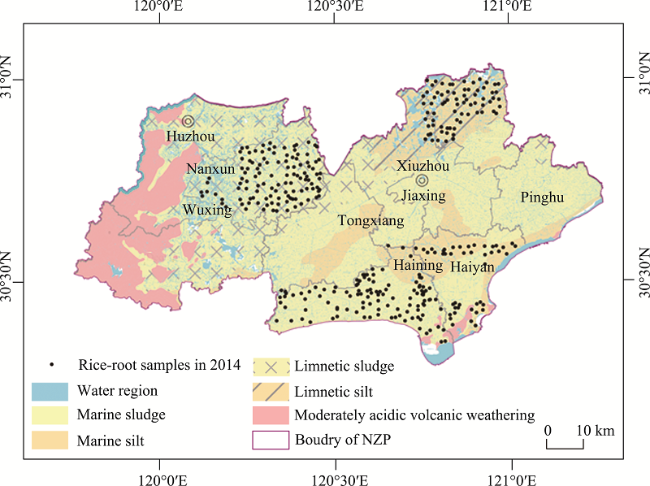
Figure 1 Collaborative sampling positions of rice and root soil in Northern Zhejiang Plain of Zhejiang Province, China (Note: Based on the consideration of sample typicality, the rice-root samples in 2014 are almost set in the concentrated continuous rice planting areas which soil parent materials types are limnetic sludge, limnetic silt, marine sludge and marine silt.)
As shown in Figure 2, from January to March 2019, a high-density soil geochemical survey in Northern Zhejiang Plain was conducted. The layout of sample positions adopted the method of “combination of grid and land use patch” (Specifications for Land Quality Geological Survey DB33T 2224-2019), and we used “grid method” to control the sample density as 10 positions km-2 on average. The “land use patch” of China’s second land use survey was used as the basic sampling unit. A total of 33,809 topsoil samples were collected in paddy field, each sample was composed of 5 sub-samples collected at the same sampling position, and the spacing of each sub-sample was 20-50 m. The Cdsoil19 for each sampling unit was valued as the average of Cdsoil within the 5 sub-samples.
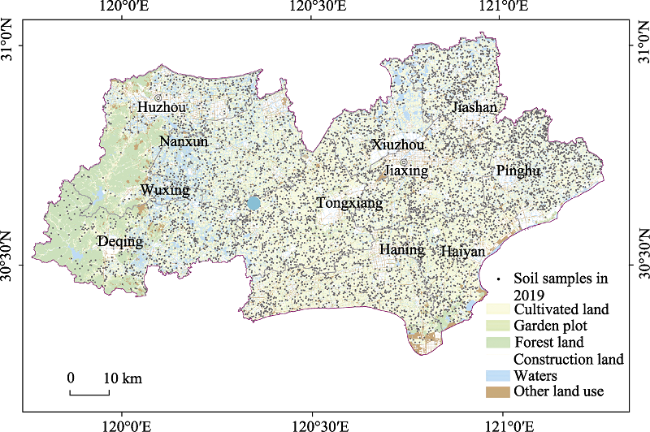
Figure 2 Location of the soil sampling sites in 2019 in Northern Zhejiang Plain of Zhejiang Province, China
As a necessary complement to the sampling positions, firstly,“Xiushui 134” as the rice variety which is the mostly planted in the study area during 2014 to 2019; secondly, all the sampling positions in 2014 are located in a large scale concentrated, contiguous main production area; thirdly, the soil parent materials of sampling positions in 2014 contains the largest distribution scale soil parent materials types in the study area. In a word, the sampling positions in 2014 we selected are greatly representativeness and typicality in the study area, Northern Zhejiang Plain.

2.2 Sample analysis

The soil samples were pre-treated and analyzed in the laboratory of Hangzhou Institute of Geology and Mineral Resources, as institute affiliated to Ministry of Natural Resources (MNR) in China. The specifications of Land Quality Geochemical Assessment of China (DZ/T 0295, 2016) and the internationally popular methods (FAO, 2006; Sun et al. 2010), were strictly implemented during the course of sample processing and testing.
Soil samples were dried at constant temperature (<60℃) for chemical analysis. After the plant samples were washed, chopped with a special shredder, and then crushed with a pollution-free crusher to 20-40 mesh (0.84-0.42 mm), screened, dried and digested for analysis, the specific procedures are as follows:
The soil pH was measured using a pH meter and the water ratio of 1:2.5 (g mL-1); soil CEC was determined by ammonium acetate centrifugation; soil organic matter (SOM) was measured by the acid dichromate oxidation method; the total Cd content in soil samples was determined by using inductively coupled plasma mass spectrometry (ICP-MS, Thermo X Series II, thermo electron, America) adopted the double internal standard method of Rh and Ir, and the soil samples were digested with mixed acids (HNO3-HClO4-HF) (Lu et al., 2021); soil Se and Zn was determined by Atomic Fluorescence Spectrometry. Meanwhile, soil reference materials were used to guarantee the quality of analysis. The difference between the measured values of heavy metals and their reference values of the standard sample was all less than 5%. Heavy metal contents in some soil samples randomly selected during analysis were repeatedly measured to achieve the maximum accuracy. Relative standard deviation (RSD%) for the duplicated measurements were controlled within range of 1.70%-9.95%.
The Cdrice was determined by graphite furnace atomic absorption spectrometry (SpetrAA 220Z, Australia) by following HNO3-H2O2 digestion procedures. A certified rice reference material (GBW 10010 from National Research Center for Standard Materials in China) with the Cd concentration of (0.087±0.005) mg kg-1 was applied to all rice sample digestion.

2.3 Model construction method

The data analysis engaged in this study is illustrated in Figure 3. Based on the collaborative data of rice grain-root soil in 2014, a linear model between soil parameters and Cdrice was constructed. We divided 348 pairs of rice grain-root soil collaborative samples into two parts by using Rand random function, 90% samples (317 pairs) were applied for modeling, and the remaining 10% (31 pairs) samples used for model verification and error analysis.
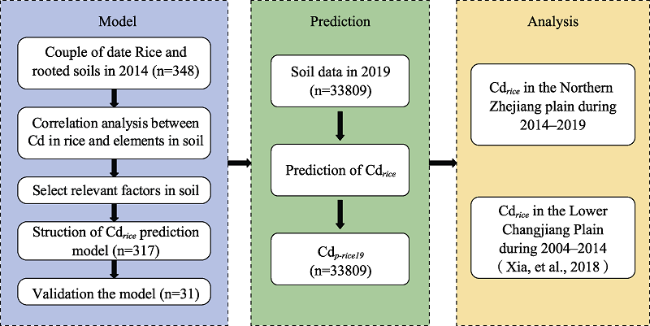
Figure 3 The workflow diagram for data processing
Cdp-rice19 was calculated by using the prediction model on the basis of Cdsoil19. The spatio-temporal variation of Cdrice was analyzed by comparing the Cdp-rice19, Cdrice14 and Cdrice in the Lower Changjiang plain as reported in the literature (Xia et al., 2019).
This study was based on McBride semi-empirical model and established the functional relationship between soil parameters and crops heavy metal content. The model is shown in Eq. (1):
$lnC{{d}_{p-rice}}=\beta +{{\beta }_{1}}\text{ln}(C{{d}_{soil}})+{{\beta }_{2}}\text{pH}+{{\beta }_{3}}\text{ln}(\text{SOM})+{{\beta }_{4}}\text{ln}(\text{CEC})+\ldots +{{\beta }_{i}}\text{ln}({{E}_{soil}})$
where Cdp-rice means predicted Cdrice; both β and β1-βi are coefficients; pH, SOM and CEC are the pH value, organic matter content and cation exchange capacity of soil, respectively; Esoil refers to the concentration of some metal or metal-like elements, like Zn, Pb and Se, etc. of soil.
In order to evaluate the prediction error, the paired sample T test was employed, and the 1/10 of the root soil-rice grain collaborative sample data were used to verify the difference between the predicted value and the actual value. The residual was defined as d, the specific equation is shown in Eq. (2):
$d=Prediction\ln (C{{d}_{rice}})-Actual\ measurement\ln (C{{d}_{rice}})$

2.4 Data analysis method

Microsoft Excel 2017, SPSS 24.0 and Origin 2019b data analysis were applied for data processing in this study. ArcGIS 10.2 was used for mapping.

3 Results and analysis

3.1 Cdsoil19 and related geochemical parameters

The descriptive statistics on Cdsoil19, pH, and SOM in the high-density soil geochemical survey data in 2019 are summarized in Table 1. It is observed that the soil is weakly acidic or acidic, and the mean value of Cdsoil19 is 0.19 mg kg-1 with a range from 0.01 mg kg-1 to 26.00 mg kg-1. Some 2.5% of sample data exceeded the maximum permissible concentration of Cd set by national soil environmental risk.
Table 1 Statistics of content characteristics of Cd, pH and SOM in soil in 2019
Parameter n Ave. Std. CV. 10% 25% 50% 75% 90% Over-limit ratio Background value
Cdp-soil19 (mg kg-1) 33809 0.192 0.889 462.0% 0.110 0.130 0.170 0.210 0.264 2.04% 0.152
pH 33809 / 0.842 / 5.200 5.650 6.150 6.710 7.410 /
SOM (%) 33809 2.500 0.975 39.0% 1.380 1.776 2.362 3.120 3.707 / 2.310

Note: C.V. means coefficient of variation

3.2 Correlation between Cdrice14 and soil-related indicators

The natural logarithmic conversion of the Cdrice and the soil parameters was conducted, and the calculation is summarized in Table 2. The results obviously showed a significant correlation between ln(Cdsoil), pH, ln(SOM), and ln(Cdrice) (p<0.01), which complied with many previous research conclusions (Li et al., 2012). Some studies suggested that the soil clay content, Zn, and Se are the disincentives of Cd absorption by plants (Chaney et al., 2006; Lin et al., 2012). However, there is no significant correlation between ln(Znsoil), ln(Sesoil), and ln(Cdrice), indicating that the inhibition of Zn and Se on Cd absorption by rice is negligible in the Northern Zhejiang Plain.
Table 2 Partial correlation coefficients between the ln(Cdrice) and the soil parameters in 2014 (n=348)
ln(Cdsoil14) pH ln(SOM) ln(Clay) ln(Sesoil14) ln(Znsoil14)
ln(Cdrice14) 0.146 -0.591 -0.138 -0.018 -0.067 0.067
p <0.01 <0.01 <0.01 0.763 0.384 0.215

3.3 Model for rice absorbing Cd and test

According to the correlation between ln(Cdrice) and soil parameters, ln(Cdsoil), pH and ln(SOM) were chosen as modeling parameters in this study. SPSS was used for stepwise linear regression to obtain the regression equation, as shown in Eq. (3):
$ln(C{{d}_{p-rice19}})=4.440-0.915pH+0.748\ ln\ (C{{d}_{soil14}})-1.031\ ln(SOM)$
F test was conducted for the regression equation: F = 94.85, p < 0.01, and R = 0.67. In order to evaluate the prediction error, 31 verification samples were used to calculate the predicted value and the actual value. The scatter plot of these two is given in Figure 4a.
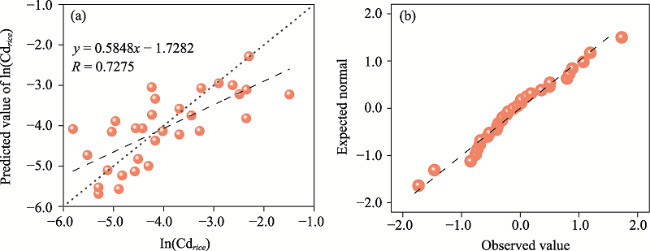
Figure 4 Scatter plot of measured value and predicted value of ln(Cdrice) (a); Q-Q chart of normal distribution of d (b)
The paired sample t-test was used to verify the difference between the actual and predicted values. The results showed a strong correlation between these two, owing to the coefficient of 0.59 (p<0.01). Nevertheless, the Wilcoxon test (p>0.05) suggested a non-significant correlation between the predicted and actual values.
The K-S method conducted the regular distribution test of the d value, and the result showed that p>0.05, which obeyed the normal distribution. Figure 4b revealed that the scattered points are almost near the straight line, as an approximately normal distribution.
In conclusion, the model constructed in this study can significantly predict the Cdrice from the Northern Zhejiang Plain by using such parameters as Cdsoil, pH, and SOM.

3.4 Spatio-temporal variation prediction on Cdrice from 2014 to 2019

The independent-sample t-test for Cdp-rice19 showed a significant difference from Cdrice14 (sig.<0.001). As shown in Figure 5, a box diagram was used to illustrate the difference between the two variables. Cdp-rice19 increased significantly and provided more outliers.
Figure 5 Box diagram of ln transformed Cdrice14 and Cdp-rice19
Table 3 lists the descriptive statistics including the percentiles and medians for Cdrice in the five years of 2014 and 2019. In comparison with Cdrice14, all percentile values of Cdp-rice19 increased by 1.9-2.5 times, indicating a significant rise trend of Cdrice in the five years. Recent research (Xia et al., 2019) also investigated a 1.2-1.3-fold increase of Cdrice in the Lower Yangtze Plain from 2004 to 2014. By contrast, the increase of Cdrice in the Northern Zhejiang Plain is more remarkable. Meanwhile, by comparing Cdrice14 which sampled at the same time, it can be found that the mean value and 90% later samples of Cdrice14 in the North Zhejiang Plain is much lower than those in the Lower Yangtze Plain geographically, whereas there are more high-value positions distribute in the North Zhejiang Plain.
Table 3 Cdrice in the Northern Zhejiang Plain and the Lower Changjiang Plain in 2014 and 2019
Parameter N Ave. Std. 10% 25% 50% 75% 90% Exceeding
standard rate
NZP Cdrice14 (mg kg-1) 348 0.0213 0.0458 0.0056 0.0080 0.0135 0.0225 0.0377 1.45%
Cdp-rice19 (mg kg-1) 33809 0.0442 0.0477 0.0107 0.0198 0.0340 0.0549 0.0860 5.08%
LCPa Cdrice14 (mg kg-1) 150 0.02811 0.01519 0.01483 0.01857 0.02411 0.03224 0.04639 /
Cdrice04 (mg kg-1) 12320 0.02299 0.01592 0.01214 0.01466 0.01906 0.02457 0.03699 /

a: Cite from Xia et al. (2019)

To verify the spatial correspondence of the Cdrice in the five years from 2014 to 2019, the same value was used as the mid-range value of each color scale and displayed in different colors. The perspective of spatial distribution is given in Figure 6. The results revealed a spatial match relationship between the positions in which Cdrice14 and Cdp-rice19 both exceeded the expected value. However, there are significant differences in the spatial distribution of high-range value positions. For Cdrice14, the high-value positions are mainly concentrated in the Northeast of the study area. In contrast, for Cdp-rice19, besides the Northeast of the study area, the high-value positions are also concentrated in the south of the study area, i.e., the north side of Hangzhou Bay, involving Haiyan, Nanhu, and Tongxiang District. The results indicated that the risk and the scope of Cd pollution in rice are continuously increasing during the 5 years, which is probably attributed to the following reasons: Firstly, the rapid economic development results in more frequent water network transportation, increase the risk of heavy metal deposition in water circulation (Wang et al., 2016); Secondly, relevant reports (Kang et al., 2018) indicated that some cities, i.e., Haiyan County, are at the risk of heavy metal pollution from the river’s sediments, while these rivers are the primary irrigation water sources for cultivation, simultaneously, the cultivation tradition of returning river sediments resource return on cropland field will doubtlessly further aggravate the risk of heavy metal in the cropland.
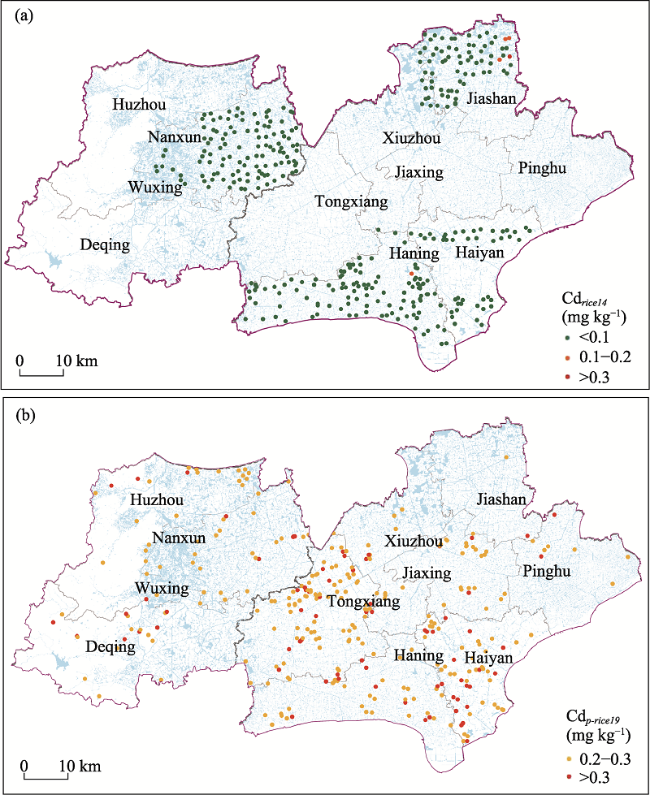
Figure 6 The GIS cartography for spatio-temporal variation of Cdrice14 (a) and Cdp-rice19 (b) in Northern Zhejiang Plain

3.5 Comparison between the Cdp-rice19 and the evaluation results of soil Cd pollution in 2019

Based on the high-density soil geochemical data in 2019 (GB15618-2018), the soil Cd pollution in the Northern Zhejiang Plain has been assessed (Figure 7).
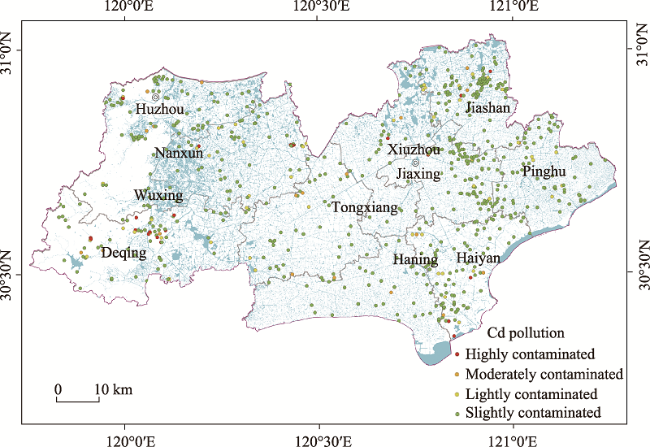
Figure 7 Evaluation of Cd pollution in soil of Northern Zhejiang Plain in 2019
By comparison with Cdp-rice19, it can be found that the proportion of soil Cd pollution is significantly lower than Cdp-rice19 which exceeds the standard, and there are also some differences in the distribution of Cdsoil19 and Cdp-rice19 in the high-value areas. Besides, some assessment results revealed these two are partly no spatial coincidence: for some clean soil positions, those of Cdp-rice19 were detected exceed the standard; for some polluted zone, Cdp-rice19 is still within the food standard limitation conversely. Actually, these positions are exactly coincided with the spatial distribution of canal water system in these areas. Therefore, the main reasons are probably as follows: (1) the increase of Cd emission caused by rapid urban development; (2) Cd polluted water network is regarded as the irrigation source; (3) the well-developed shipping of canal water network aggravated Cd transfer; (4) the polluted river sediments perturbance and the returning pattern, etc. all possibly cause this phenomenon. Moreover, it also suggests that the current environmental quality standard (i.e., GB15618-2018) is not effective in the spatio-temporal variation prediction on Cdrice.

4 Conclusion

With the worsening soil Cd pollution, it is urgent to prevent human health risks by accurately modeling the spatio-temporal variation prediction on Cdrice. This study found that ln(Cdrice) is significantly correlated to soil pH, ln(Cdsoil), and ln(SOM). Accordingly, the multivariate linear model containing Cdrice and soil pH, Cdsoil, and SOM was constructed by adopting McBride’s semi-empirical model. The prediction of Cdrice is accomplished very well with p < 0.01.
During the five years from 2014 to 2019, Cdrice increased significantly, and the exceeding standard rate of Cdrice also increased sharply from 1.45% to 5.08%. These positions are mainly distributed north of Hangzhou Bay, such as Hanyan, Nanhu, and Tongxiang Districts. In addition, the exceeding standard rate of Cdp-rice19 was significantly higher than that of soil in 2019, and numerous positions in the exceeding standard circumstance between Cdsoil19 and Cdp-rice19 are mismatching resulting in there is partially spatial noncoincidence between Cdsoil19 and Cdp-rice19. The dominant spatial factor of these positions is the local canal systems. Hence, rapid urban development and well-developed shipping aggravated the Cd pollution grade and scope of the canal systems, which are regarded as the primary irrigation source. Besides, it cannot be ignored that the polluted river sediment's perturbance and the returning pattern also threaten rice safety.
In this study, there are some limitations in the prediction of Cdrice. They lie in the indeterminateness of prediction model error and parameter. For example, the rice absorption prediction model relies on a handful of field data which cannot accurately reflect the comprehensive data. Besides, sample collection and analysis error causes parameter (like soil pH) indeterminacy. However, due to the strict requirements of sampling time, sample maintenance, and pretreatment of rice samples analysis, Cdrice is very difficult to get accurately and readily. In addition, the prediction model is based on the accurate data of representative samples, which also avoids the differences in varieties and regions in some ways. Hence, there is no doubt that it is scientific, economical, and meaningful to build a model to predict comprehensive risk through representative data in a small region. This work provides a specific application case of rice heavy metal risk prediction. Moreover, it will further strengthen the study in predicting regional rice risk of heavy metals, contributing to the appropriate land use management and ecological risk control in the future.
[1]
Brus D J, Gruijter J J, Walvoort D J, 2002. Mapping the probability of exceeding critical thresholds for cadmium concentrations in soils in the Netherlands. Journal of Environmental Quality, 31(6): 1875-1884.

PMID

[2]
Caetano A L, Marques C R, Gavina A et al., 2014. Contribution for the derivation of a soil screening value (SSV) for Uranium, using a natural reference soil. Journal of Soils & Sediments, 9(1): 1-16.

[3]
Chaney R L, Filcheva E, Green C E et al., 2006. Zn deficiency promotes Cd accumulation by lettuce from biosolids amended soils with high Cd: Zn ratio. Journal of Residuals Science and Technology, 3(2): 79-85.

[4]
China MNR, 2016. Determination of Land Quality Geochemical Evaluation: DZ/T0295-2016. Beijing: China Standards Press, 42-43. (in Chinese)

[5]
China MoEaEotPsRo, 2018. Soil Environmental Quality: Risk Control Standard for Soil Contamination of Agricultural Land Environmental Quality Standard for Soils, 2018. (in Chinese)

[6]
Chunhabundit R, 2016. Cadmium exposure and potential health risk from foods in contaminated area, Thailand. Toxicological Research, 32(1): 65-72.

DOI PMID

[7]
Ding C F, Zhang T, Wang X et al., 2013. Prediction model for cadmium transfer from soil to carrot (Daucus carota L.) and its application to derive soil thresholds for food safety. Journal of Agricultural & Food Chemistry, 61(43): 10273-10282.

[8]
Dudka S, Miller W P, 1999. Accumulation of potentially toxic elements in plants and their transfer to human food chain. Journal of Environmental Science & Health (Part B): Pesticides Food Contaminants & Agricultural Wastes, 34(4): 681-708.

[9]
Filipovic L, Romic M, Romic D et al., 2018. Organic matter and salinity modify cadmium soil (phyto)availability. Ecotoxicology and Environmental Safety, 147(1): 824-831.

DOI

[10]
Food and Agricultural Organization of the United Nations (FAO), 2006. Guidelines for Soil Description, fourth edition. Food and Agriculture Organization of the United Nations. Rome IT EU: 97p.

[11]
Gao X J, Chen Z L, Zhang N L et al., 2002. Heavy metals and phosphorus in tidal flat sediments of the Yangtze estuary. Journal of Geographical Sciences, 12(4): 472-478.

[12]
Genchi G, Sinicropi M S, Lauria G et al., 2020. The effects of cadmium toxicity. International Journal of Environmental Research and Public Health, 17(11): 3782.

DOI

[13]
Guo B, Hong C L, Tong W B et al., 2020. Health risk assessment of heavy metal pollution in a soil-rice system: A case study in the Jin-Qu basin of China. Scientific Reports, 10(1): 11490.

DOI PMID

[14]
Halwani D A, Jurdi M, Salem F et al., 2020. Cadmium health risk assessment and anthropogenic sources of pollution in Mount-Lebanon Springs. Exposure and Health, 12(2): 163-178.

DOI

[15]
Han X Y, Zhuang X M, Kang Z J, 2017. Research on land quality condition and pollution prevention of Jiaxing. Land and Resources Development and Management, 517-524. (in Chinese)

[16]
Hang X S, Zhou J M, Wang H Y, 2009. Heavy metal pollution characteristics and assessment of rice grain from a typical high risk area of Changshu City, Jiangsu Province. China Environmental Science, 29(2): 130-135.

[17]
Hou Q Y, Yang Z F, Ji J et al., 2021. Effects of soil pH and mineral nutrients on cadmium uptake by rice grain in the Pearl River Delta, China. Bulletin of Environmental Contamination and Toxicology, 106(5): 1-10.

DOI

[18]
Jya B, Chen Z, Yang J X et al., 2022. Discriminative algorithm approach to forecast Cd threshold exceedance probability for rice grain based on soil characteristics. Environmental Pollution, 261: 114211.

DOI

[19]
Kang Z J, Lu X Z, Lin N et al., 2018. Ecological risk assessment of heavy metals in surface sediments in Haiyan County, Zhejiang Province. Journal of Ecology and Rural Environment, 34(12): 1096-1104. (in Chinese)

[20]
Ke L, Lv J, He W et al., 2015. Major factors influencing cadmium uptake from the soil into wheat plants. Ecotoxicology and Environmental Safety, 113(5): 207-213.

DOI

[21]
Lei M, Tie B Q, Song Z G et al., 2015. Heavy metal pollution and potential health risk assessment of white rice around mine areas in Hunan Province, China. Food Security, 7: 45-54.

DOI

[22]
Li F Y, Fu B R, Wang X J, 2004. Cadmium and zinc transfer from soil to plant: Potential use of two mathematical models. Journal of Liaoning University Natural Sciences Edition, 31(3): 193-198. (in Chinese)

[23]
Li L, Zhou W, Dai H et al., 2012. Selenium reduces cadmium uptake and mitigates cadmium toxicity in rice. Journal of Hazardous Materials, 235/236: 343-351.

DOI

[24]
Li Q, Hao C M, Zhao L H et al., 2012. Optimization of monitoring network point about total N in soil in Hangjiahu Plain. Advanced Materials Research, 403: 1652-1655.

[25]
Li Q S, Yan C, Fu H B et al., 2012. Health risk of heavy metals in food crops grown on reclaimed tidal flat soil in the Pearl River Estuary, China. Journal of Hazardous Materials, 227/228(Aug. 15): 148-154.

[26]
Li T, Jiang H, Yang X et al., 2013. Competitive sorption and desorption of cadmium and lead in paddy soils of eastern China. Environmental Earth Sciences, 68(6): 1599-1607.

DOI

[27]
Lin X B, Zhou L J, Wang H M et al., 2018. Accumulation of heavy metals in different rice varieties. Environmental Science, 39(11): 5198-5206.

[28]
Lin Z, Schneider A, Sterckeman T et al., 2016. Ranking of mechanisms governing the phytoavailability of cadmium in agricultural soils using a mechanistic model. Plant & Soil, 399: 89-107.

[29]
Lu X Z, Huang C L et al., 2021. Assessments of heavy metal pollution of a farmland in an urban area based on the environmental geochemical baselines. Journal of Soil & Sediments, 21: 2659-2671.

[30]
Ma H, Li X, Wei M et al., 2020. Elucidation of the mechanisms into effects of organic acids on soil fertility, cadmium speciation and ecotoxicity in contaminated soil. Chemosphere, 239: 124706.

DOI

[31]
Mcbride M B, 2002. Cadmium uptake by crops estimated from soil total Cd and pH. Soil Science, 167(1): 62-67.

DOI

[32]
Mcbride, M B, Sauve S, Hendershot W et al., 1997. Solubility control of Cu, Zn, Cd and Pb in contaminated soils. European Journal of Soil Science, 48(2): 337-346.

DOI

[33]
Ogunkunle C, Varun M, Jimoh M et al., 2016. Evaluating the trace metal pollution of an urban paddy soil and bioaccumulation in rice (Oryza sativ a L.) with the associated dietary risks to local population: A case study of Ilorin, north-central Nigeria. Environmental Earth Sciences, 75(20): 1383-1395.

DOI

[34]
Pelfrêne A, Douay F, Richard A et al., 2013. Assessment of potential health risk for inhabitants living near a former lead smelter (Part 2): Site-specific human health risk assessment of Cd and Pb contamination in kitchen gardens. Environmental Monitoring and Assessment: 1-14.

[35]
Satarug S, Vesey D A, Nishijo M et al., 2019. The inverse association of glomerular function and urinary β2-MG excretion and its implications for cadmium health risk assessment. Environmental Research, 173(Jun.):40-47.

DOI PMID

[36]
Sauve S, Hendcrshot W, Allen H E, 2000. Sold-solution partitioning of metals in contaminated soft: Dependence on pH, total metal burden, and organic matter. Environmental Science & Technology, 34(7): 1125-1131.

DOI

[37]
Shen B B, Wang X M, Zhang Y et al., 2019. The optimum pH and Eh for simultaneously minimizing bioavailable cadmium and arsenic contents in soils under the organic fertilizer application. Science of the Total Environment, 711: 135229.

DOI

[38]
Shi Z, Li Y, Cheng J L, 2007. Stochastic simulation of spatial distribution and uncertainty assessment of heavy metal in paddy soil. Environmental Sciences, 28(1): 209-214. (in Chinese)

[39]
Song B, Wang F P, Zhou L et al., 2019. Cd content characteristics and ecological risk assessment of paddy soil in high cadmium anomaly area of Guangxi. Environmental Sciences, 40(5): 2443-2452.

[40]
Standardization Administration China/Ministry of Health, China (SAC/MOHC) 2019. Maximum Levels of Contaminants in Foods. GB2762-2017. Beijing: SAC/MOHC.

[41]
Stritsis C, Steingrobe B, Claassen N, 2012. Shoot cadmium concentration of soil-grown plants as related to their root properties. Journal of Plant Nutrition and Soil Science, 175(3): 456-465.

DOI

[42]
Suwatvitayakorn P, Ko M S, Kim K W et al., 2020. Human health risk assessment of cadmium exposure through rice consumption in cadmium-contaminated areas of the Mae Tao sub-district, Tak, Thailand. Environmental Geochemistry and Health, 42(8): 2331-2344.

DOI PMID

[43]
Tahervand S, Jalali M, 2016. Sorption, desorption, and speciation of Cd, Ni, and Fe by four calcareous soils as affected by pH. Environmental Monitoring and Assessment, 188(6): 1-12.

DOI

[44]
Wang C Y, 2016. Ecological system health assessment and ecological red line zoning based on remote sensing: A case study of Zhejiang province coastal zone. Shanghai Ocean University, 43-53. (in Chinese)

[45]
Wang P, Chen H P, Kopittke P M et al., 2019. Cadmium contamination in agricultural soils of China and the impact on food safety. Environmental Pollution, 249: 1038-1048.

DOI PMID

[46]
Wang S, You D, Huang Q H et al., 2015. Speciation and phytoavailability of cadmium in soil treated with cadmium-contaminated rice straw. Environmental Science & Pollution Research, 22(4): 2679-2686.

[47]
Wang Y, Wu S, Yan D et al., 2020. Determining and mapping the spatial mismatch between soil and rice cadmium (Cd) pollution based on a decision tree model. Environmental Pollution, 265(Pt B): 115029.

[48]
Wang Z, Zeng X, Geng M et al., 2015. Health risks of heavy metals uptake by crops grown in a sewage irrigation area in China. Polish Journal of Environmental Studies, 24(3): 1379-1386.

DOI

[49]
Welikala D, Robinson B H, Moltchanova E et al., 2021. Soil cadmium mobilisation by dissolved organic matter from soil amendments. Chemosphere, 271: 129536.

DOI

[50]
Wen N N, Wang J A, Liu Z Q, 2015. Analysis of genotypic and environmental effects on cadmium content in rice by AMMI model. Journal of Agro-Environment Science, 34(5): 817-823. (in Chinese)

[51]
Williams P N, Zhang H, Davison W et al., 2012. Evaluation of in situ DGT measurements for predicting the concentration of Cd in Chinese field-cultivated rice: Impact of soil Cd:Zn ratios. Environmental Science & Technology, 46(15): 8009-8016.

DOI

[52]
Wu J H, Song Q, Zhou J et al., 2021. Cadmium threshold for acidic and multi-metal contaminated soil according to Oryza sativa L. Cadmium accumulation: Influential factors and prediction model. Ecotoxicology and Environmental Safety, 208(15): 111420.

DOI

[53]
Xia X Q, Yang Z F, Yu T et al., 2019. Predicting spatial and temporal variation of Cd concentration in rice grains in the Lower Changjiang Plain during 2004-2014 based on soil geochemical survey data with GIS Journal of Geochemical Exploration, 200: 276-283.

DOI

[54]
Xie L, Hao P, Cheng Y et al., 2018. Effect of combined application of lead, cadmium, chromium and copper on grain, leaf and stem heavy metal contents at different growth stages in rice. Ecotoxicology and Environmental Safety, 162(Oct.):71-76.

DOI PMID

[55]
Xiong J, Zhu Q H, Huang D Y et al., 2019. Prediction model for the accumulation of cadmium in rice in typical paddy fields of south China. Journal of Agro-Environment Science, 38(1): 22-28. (in Chinese)

[56]
Xu J J, Wu B, Zhang L Y et al., 2016. Risk assessment of cadmium in rice in Xiangtan, Hunan, China based on Bayesian method. Chinese Journal of Applied Ecology, 27(10): 3221-3227. (in Chinese)

[57]
Zhang S, Song J, Cheng Y W et al., 2018. Derivation of regional risk screening values and intervention values for cadmium-contaminated agricultural land in the Guizhou Plateau. Land Degradation & Development, 29(8): 2366-2377.

DOI

[58]
Zhao K L, Fu W, Ye Z et al., 2015. Contamination and spatial variation of heavy metals in the soil-rice system in Nanxun county, southeastern China. International Journal of Environmental Research and Public Health, 12(2): 1577-1594.

DOI PMID

[59]
Zhao K L, Zhang W W, Zhou L et al., 2009. Modeling transfer of heavy metals in soil-rice system and their risk assessment in paddy fields. Environmental Earth Sciences, 59: 519-527.

DOI

[60]
Zhao M, Qian E, Zhang F et al., 2020. Spatiotemporal dynamics of labile Cd in soil during rice growth. Science of The Total Environment, 738: 139832.

DOI

[61]
Zhu Z J, Yang S S, Yang Z Z et al., 2019. Risk assessment of soil acidification and cadmium pollution in paddy field of Guiping, Guangxi. Journal of Southern Agriculture, 50(7): 1466-1471.

[62]
Zou M M, Zhou S L, Zhou Y J et al., 2021. Cadmium pollution of soil-rice ecosystems in rice cultivation dominated regions in China: A review. Environmental Pollution, 280(3): 116965.

DOI

Outlines

/