
Journal of Geographical Sciences >
Spatio-temporal analysis of human wellbeing and its coupling relationship with ecosystem services in Shandong province, China
|
Wang Chao (1994-), PhD Candidate, specialized in land use/cover change and ecosystem services. E-mail: wangchao@mail.bnu.edu.cn |
Received date: 2021-06-02
Accepted date: 2022-03-28
Online published: 2023-02-21
Supported by
The Key Program of National Natural Science Foundation of China(72033005)
Copyright
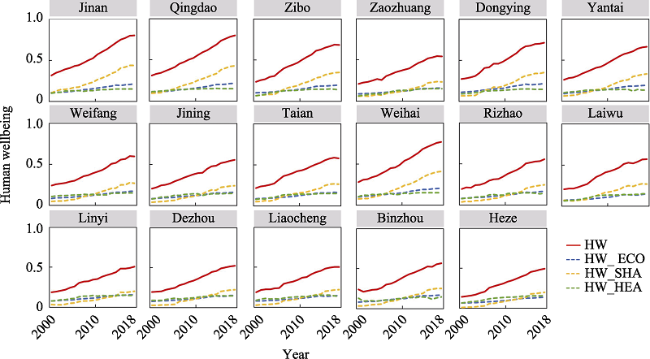
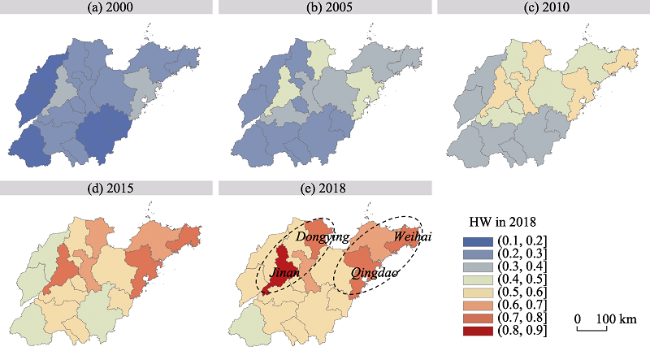
Rapid economic and social change promotes to improve human wellbeing (HW), but poses threats to ecosystems and the environment. Studying the coupling relationship between HW and ecosystem services (ES) is crucial for informing high-quality development. Firstly, we built a comprehensive index system for HW assessment, and evaluated HW for 17 prefecture-level cities in Shandong province, China, from 2000 to 2018. Then, we quantified ES based on land use data. Finally, we assessed the coupling coordination degree and analyzed the relationships between HW and each type of ES value. The results were as follows: (1) HW values increased overall in Shandong, with the highest value in Jinan (0.8034) and the lowest value in Heze (0.4965) in 2018. (2) The total ES values for the 17 cities increased slightly. The ranking of 17 cities according to the ES value per unit area was different from the ranking according to the total ES value. (3) All 17 cities in Shandong were in the coordinated development phase after 2015, with increasing coupling coordination degrees. There were clear positive relationships between HW and ES. General and specific policy recommendations were proposed, providing scientific evidence and a reference for Shandong’s urban management and policy formulation.
Key words: land use; coupling; human wellbeing; ecosystem services; Shandong
WANG Chao , WANG Xuan , WANG Yifan , ZHAN Jinyan , CHU Xi , TENG Yanmin , LIU Wei , WANG Huihui . Spatio-temporal analysis of human wellbeing and its coupling relationship with ecosystem services in Shandong province, China[J]. Journal of Geographical Sciences, 2023 , 33(2) : 392 -412 . DOI: 10.1007/s11442-023-2088-8
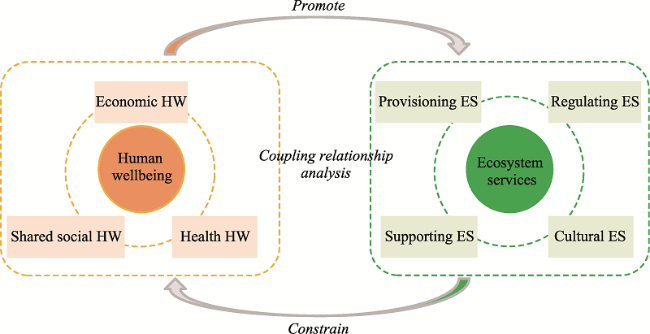
Figure 1 Coupling and coordination analysis between human wellbeing and ecosystem services |
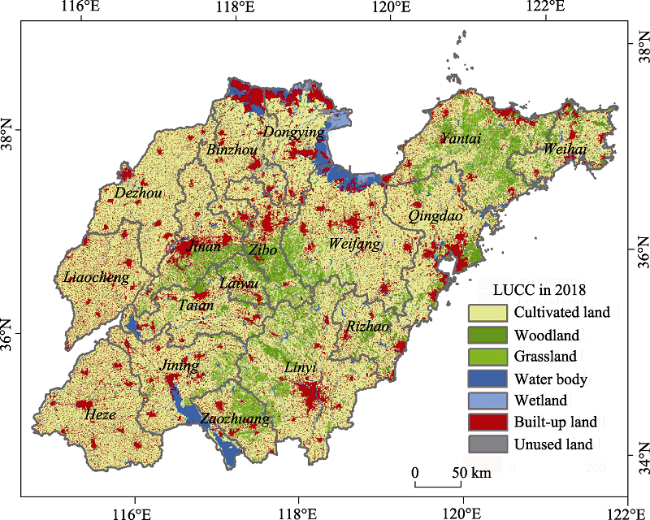
Figure 2 Location and land use and cover change of Shandong province, China |
Table 1 The index system for comprehensive human wellbeing |
| Categories | Topic | Specific indexes (Unit) | Weight | Orientation | Label |
|---|---|---|---|---|---|
| Economic human wellbeing | GDP | GDP per capita (yuan) | 0.025450 | + | ECO1 |
| GDP | Proportion of GDP in the secondary industry (%) | 0.020861 | + | ECO2 | |
| GDP | Proportion of GDP in the tertiary industry (%) | 0.023252 | + | ECO3 | |
| Employment | Proportion of employees at the end of the year (%) | 0.032266 | + | ECO4 | |
| Employment | Proportion of employees in the secondary industry (%) | 0.027415 | + | ECO5 | |
| Employment | Proportion of employees in the tertiary industry (%) | 0.026771 | + | ECO6 | |
| Employment | Proportion of urban registered unemployed persons (%) | 0.028193 | - | ECO7 | |
| Income | Average employee salary (yuan/person) | 0.032531 | + | ECO8 | |
| Income | Disposable income of rural residents per capita (yuan/person) | 0.033097 | + | ECO9 | |
| Income | Disposable income of urban residents per capita (yuan/person) | 0.033208 | + | ECO10 | |
| Shared social human wellbeing | Living standard | Consumption level of rural residents (yuan/person) | 0.024914 | + | SHA1 |
| Living standard | Consumption level of urban residents (yuan/person) | 0.030837 | + | SHA2 | |
| Public service | Expressway density (km/100 km2) | 0.025960 | + | SHA3 | |
| Public service | Highway density (km/100 km2) | 0.039185 | + | SHA4 | |
| Public service | Retirement insurance benefits per capita (yuan/person) | 0.027546 | + | SHA5 | |
| Public service | Proportion of urban employees participating in basic endowment insurance (%) | 0.024556 | + | SHA6 | |
| Public service | Proportion of people participating in medical insurance (%) | 0.043708 | + | SHA7 | |
| Health human wellbeing | Public service | Proportion of people participating in unemployment insurance (%) | 0.028819 | + | HEA1 |
| Public service | Proportion of people participating in work-related injury insurance (%) | 0.033610 | + | HEA2 | |
| Public service | Proportion of people participating in maternity insurance (%) | 0.030953 | + | HEA3 | |
| Education | Teacher-student ratio in ordinary colleges and universities | 0.023461 | + | HEA4 | |
| Education | Number of ordinary colleges and universities (units/person) | 0.026943 | + | HEA5 | |
| Education | Books in public libraries per 100 people (books) | 0.027847 | + | HEA6 | |
| Education | Cultural relics and cultural business expenditure per capita (yuan/person) | 0.021438 | + | HEA7 | |
| Education | Education expenditure per capita (yuan/person) | 0.031722 | + | HEA8 | |
| Medical treatment | Number of doctors per 10,000 people (persons) | 0.022421 | + | HEA9 | |
| Medical treatment | Number of hospital beds per 10,000 people (beds) | 0.026832 | + | HEA10 | |
| Medical treatment | Number of registered nurses per 10,000 people (persons) | 0.025121 | + | HEA11 | |
| Medical treatment | Medical and health expenditure per capita (yuan/person) | 0.035228 | + | HEA12 | |
| Health system | Industrial wastewater discharge per unit of GDP (tons/10 thousand yuan) | 0.024265 | - | HEA13 | |
| Health system | Industrial SO2 emissions per unit of GDP (tons/10 thousand yuan) | 0.021925 | - | HEA14 | |
| Health system | Industrial smoke (dust) emissions per unit of GDP (tons/10 thousand yuan) | 0.017622 | - | HEA15 | |
| Health system | Green coverage rate in built-up area (municipal district) (%) | 0.017193 | + | HEA16 | |
| Health system | Comprehensive utilization rate of general industrial solid waste (%) | 0.025838 | + | HEA17 | |
| Health system | Centralized treatment rate of sewage treatment plants (%) | 0.036245 | + | HEA18 | |
| Health system | Harmless treatment rate of domestic garbage (%) | 0.022767 | + | HEA19 |
Table 2 Equivalent weight factor of ES per unit area |
| Top level ecosystem services | Second level ecosystem services | Cultivated land | Woodland | Grassland | Water body | Wetland | Barren land |
|---|---|---|---|---|---|---|---|
| Provisioning services | Food production | 1 | 0.33 | 0.43 | 0.53 | 0.36 | 0.02 |
| Raw production | 0.39 | 2.98 | 0.36 | 0.35 | 0.24 | 0.04 | |
| Regulating services | Gas regulation | 0.72 | 4.32 | 1.5 | 0.51 | 2.41 | 0.06 |
| Climate regulation | 0.97 | 4.07 | 1.56 | 2.06 | 13.55 | 0.13 | |
| Hydrological regulation | 0.77 | 4.09 | 1.52 | 18.77 | 13.44 | 0.07 | |
| Waste disposal | 1.39 | 1.72 | 1.32 | 14.85 | 14.4 | 0.26 | |
| Supporting services | Soil retention | 1.47 | 4.02 | 2.24 | 0.41 | 1.99 | 0.17 |
| Biodiversity protection | 1.02 | 4.51 | 1.87 | 3.43 | 3.69 | 0.4 | |
| Cultural services | Landscape aesthetics | 0.17 | 2.08 | 0.87 | 4.44 | 4.69 | 0.24 |
| Total | 7.9 | 28.12 | 11.67 | 45.35 | 54.77 | 1.39 | |
Table 3 Ecosystem service value of grain production in cultivated land per unit area in Shandong |
| Year | 2000 | 2005 | 2010 | 2015 | 2018 | |
|---|---|---|---|---|---|---|
| Grain yield (×105 kg/km2) | Wheat | 4.70 | 5.49 | 5.78 | 6.18 | 6.09 |
| Corn | 5.61 | 6.35 | 6.54 | 6.46 | 6.63 | |
| Soybean | 2.28 | 2.73 | 2.46 | 2.54 | 2.82 | |
| Annual solar emergy (×107 J/kg) | Wheat | 1.33 | 1.33 | 1.33 | 1.33 | 1.33 |
| Corn | 1.45 | 1.45 | 1.45 | 1.45 | 1.45 | |
| Soybean | 2.07 | 2.07 | 2.07 | 2.07 | 2.07 | |
| Emergy transformity (×104 seJ/J) | Wheat | 6.80 | 6.80 | 6.80 | 6.80 | 6.80 |
| Corn | 8.52 | 8.52 | 8.52 | 8.52 | 8.52 | |
| Soybean | 8.30 | 8.30 | 8.30 | 8.30 | 8.30 | |
| Proportion of grain acreage (%) | Wheat | 56.30 | 52.47 | 53.37 | 53.44 | 49.82 |
| Corn | 37.19 | 43.71 | 44.28 | 44.63 | 48.30 | |
| Soybean | 6.51 | 3.82 | 2.35 | 1.93 | 1.88 | |
| Total emergy of grain production per area (×1017 seJ/km2) | 5.22 | 6.22 | 6.47 | 6.63 | 6.79 | |
Table 4 Classification of coupling coordination degree between HW and ES |
| Class | Sub-class | D-value |
|---|---|---|
| Coordination development (acceptable interval) | Superior balanced development | [0.7, 1] |
| Transitional development (transitional interval) | Slightly balanced development | [0.5, 0.7) |
| Unbalanced development (unacceptable interval) | Slightly unbalanced development | [0.3, 0.5) |
| Severely unbalanced development | [0, 0.3) |
Figure 3 Changes in HW for the 17 cities of Shandong from 2000 to 2018. HW_ECO, HW_SHA, and HW_HEA represent economic, shared social, and health HW, respectively. |
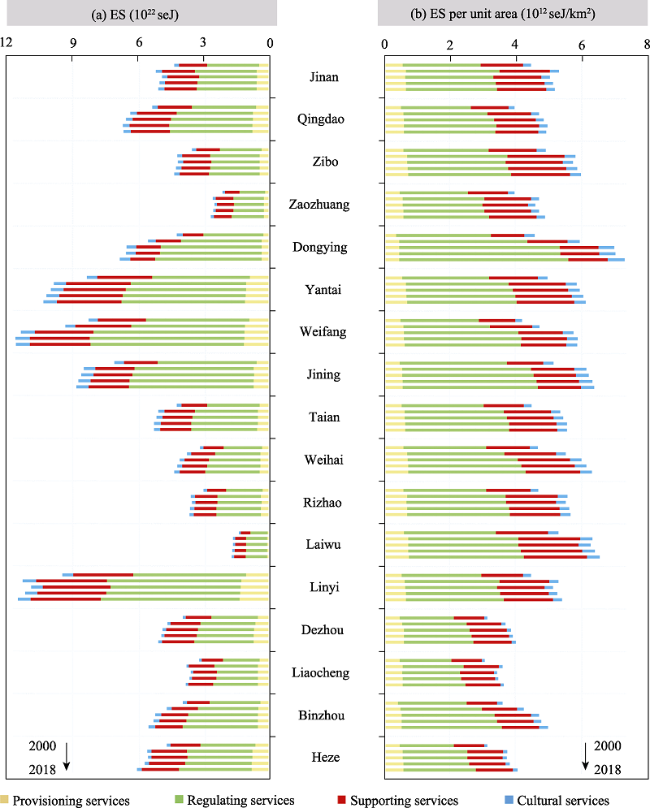
Figure 4 Spatio-temproal changes in ES value in the 17 cities of Shandong from 2000 to 2018 |
Table 5 The area and ES values for each land use type in Shandong from 2000 to 2018 |
| Year | 2000 | 2005 | 2010 | 2015 | 2018 | |
|---|---|---|---|---|---|---|
| ES value per unit area (seJ/900m2) | Built-up land | 0 | 0 | 0 | 0 | 0 |
| Cultivated land (×1015) | 3.7145 | 4.4195 | 4.5968 | 4.7153 | 4.8269 | |
| Woodland (×1016) | 1.3222 | 1.5731 | 1.6362 | 1.6784 | 1.7181 | |
| Grassland (×1015) | 5.4871 | 6.5285 | 6.7905 | 6.9655 | 7.1303 | |
| Water body (×1016) | 2.1323 | 2.5370 | 2.6388 | 2.7068 | 2.7709 | |
| Wetland (×1016) | 2.5752 | 3.0640 | 3.1869 | 3.2691 | 3.3464 | |
| Barren land (×1014) | 6.5356 | 7.7760 | 8.0881 | 8.2965 | 8.4928 | |
| Area (× 900 m2) | Built-up land (×107) | 2.2412 | 2.4441 | 3.0018 | 3.1277 | 3.3123 |
| Cultivated land (×108) | 1.1530 | 1.1427 | 1.1429 | 1.1297 | 1.1097 | |
| Woodland (×107) | 1.1024 | 1.1028 | 1.0023 | 1.0023 | 1.0036 | |
| Grassland (×107) | 1.5408 | 1.4655 | 0.94489 | 0.9449 | 0.9549 | |
| Water body (×106) | 4.5255 | 5.2840 | 7.1694 | 7.2842 | 7.9869 | |
| Wetland (×106) | 2.2470 | 1.8295 | 1.8326 | 1.7310 | 1.3175 | |
| Barren land (×106) | 2.5479 | 1.9594 | 7.5377 | 7.4714 | 6.7977 | |
| Total (×108) | 1.7347 | 1.7347 | 1.7354 | 1.7348 | 1.7366 | |
| ES value (seJ) | Built-up land | 0 | 0 | 0 | 0 | 0 |
| Cultivated land (×1023) | 4.2828 | 5.0503 | 5.2537 | 5.3267 | 5.3562 | |
| Woodland (×1023) | 1.4576 | 1.7349 | 1.6400 | 1.6823 | 1.7242 | |
| Grassland (×1022) | 8.4546 | 9.5674 | 6.4163 | 6.5815 | 6.8084 | |
| Water body (×1023) | 0.9650 | 1.3405 | 1.8919 | 1.9717 | 2.2131 | |
| Wetland (×1022) | 5.7866 | 5.6056 | 5.8404 | 5.6586 | 4.4088 | |
| Barren land (×1021) | 1.6652 | 1.5237 | 0.6097 | 0.6199 | 0.5773 | |
| Total (×1024) | 0.8146 | 0.9658 | 1.0017 | 1.0211 | 1.0421 | |
Figure 5 ES and ES per area values for the 17 cities in Shandong from 2000 to 2018 |
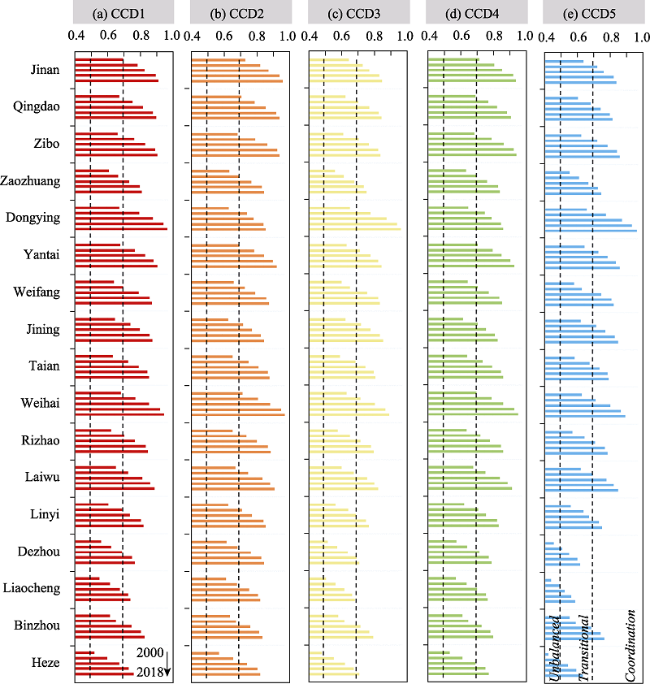
Figure 6 Coupling degree between HW and ES from 2000 to 2018 in Shandong. CCD1, CCD2, CCD3, CCD4, and CCD5 present the CCD between HW and total ES, provisioning services, regulating services, supporting services and cultural services, respectively. |
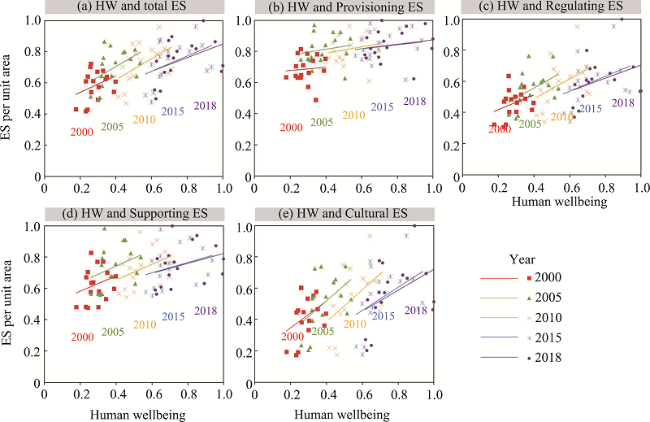
Figure 7 The relationships between HW and ES per unit area |
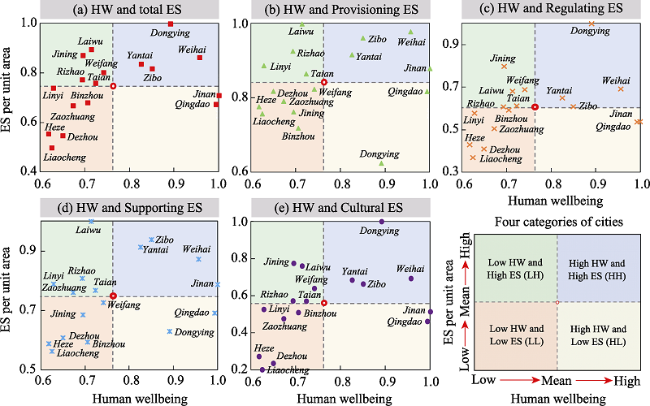
Figure 8 The categories of the 17 cities of Shandong province according to HW and ES in 2018 |
| [1] |
|
| [2] |
|
| [3] |
|
| [4] |
|
| [5] |
|
| [6] |
|
| [7] |
|
| [8] |
|
| [9] |
|
| [10] |
|
| [11] |
|
| [12] |
|
| [13] |
|
| [14] |
|
| [15] |
|
| [16] |
|
| [17] |
|
| [18] |
|
| [19] |
|
| [20] |
|
| [21] |
|
| [22] |
|
| [23] |
|
| [24] |
|
| [25] |
|
| [26] |
|
| [27] |
|
| [28] |
|
| [29] |
|
| [30] |
|
| [31] |
|
| [32] |
|
| [33] |
|
| [34] |
|
| [35] |
|
| [36] |
|
| [37] |
|
| [38] |
|
| [39] |
|
| [40] |
|
| [41] |
|
| [42] |
|
| [43] |
|
| [44] |
|
| [45] |
|
| [46] |
|
| [47] |
The Millennium Ecosystem Assessment(MA) 2005. Ecosystems and Human Well-being. Island Press United States of America.
|
| [48] |
|
| [49] |
|
| [50] |
|
| [51] |
|
| [52] |
|
| [53] |
|
| [54] |
|
| [55] |
|
| [56] |
|
| [57] |
|
| [58] |
|
| [59] |
|
| [60] |
|
| [61] |
|
| [62] |
|
| [63] |
|
| [64] |
|
| [65] |
|
| [66] |
|
/
| 〈 |
|
〉 |