
Journal of Geographical Sciences >
Simulation and prediction of multi-scenario evolution of ecological space based on FLUS model:A case study of the Yangtze River Economic Belt, China
|
Liu Xiaoqiong (1992-), specialized in environmental planning and design. E-mail: dancy_cug@163.com |
Received date: 2021-09-03
Accepted date: 2021-12-07
Online published: 2023-02-21
Supported by
The Fundamental Research Funds for the Central Universities, China University of Geosciences(Wuhan)(CUG2018123)
Copyright
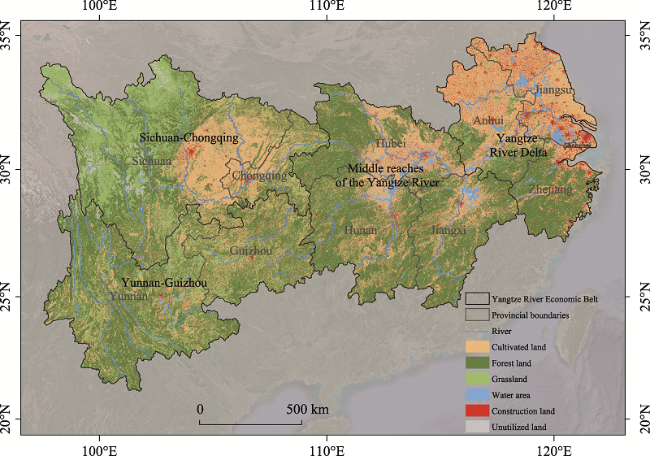
Building the Yangtze River Economic Belt (YREB) is one of China’s three national development policies in the new era. The ecological environment of the Yangtze River Economic Belt must be protected not only for regional economic development but also for regional ecological security and ecological progress in this region. This paper takes the ecological space of the Yangtze River Economic Belt as the research object, based on land use data in 2010 and 2015, and uses the FLUS model to simulate and predict the ecological space of the research area in 2035. The variation of the research area’s ecological space area and its four sub-zones has remarkable stability under diverse situations. Both the production space priority scenarios (S1) and living space priority scenarios (S2) saw a fall in ecological space area, with the former experiencing the highest reduction (a total reduction of 25,212 km2). Under the ecological space priority scenarios (S3) and comprehensive space optimization scenario (S4), the ecological space area increased, and the ecological space area expanded even more under the former scenario (a total growth of 23,648 km2). In Yunnan-Guizhou, the ecological space is relatively stable, with minimal signs of change. In Sichuan-Chongqing, the Sichuan Basin, Zoige Grassland, and Longmen Mountains were significant regions of area changes in ecological space. In the middle reaches of the Yangtze River, the ecological space changes mainly occur in the Wuyi Mountains, Mufu Mountains, and Dabie Mountains, as well as the surrounding waters of Dongting Lake. The Yangtze River Delta’s changes were mainly observed in the eastern Dabie Mountains and Jianghuai Hills.
LIU Xiaoqiong , WANG Xu , CHEN Kunlun , LI Dan . Simulation and prediction of multi-scenario evolution of ecological space based on FLUS model:A case study of the Yangtze River Economic Belt, China[J]. Journal of Geographical Sciences, 2023 , 33(2) : 373 -391 . DOI: 10.1007/s11442-023-2087-9
Figure 1 Location and land use of the Yangtze River Economic Belt |
Table 1 Data source information |
| Data type | Data name | |
|---|---|---|
| Basic data | LUCC | Land use data (2010, 2015) |
| Administrative boundaries | Administrative boundaries of the Yangtze River Economic Belt, and provinces in the zone | |
| Driving factors | Natural factors | Digital elevation model, slope, slope direction, farmland potential productivity, root oxygen availability, nutrient availability, annual precipitation, annual evaporation, average annual air temperature, vegetation cover, plant primary productivity |
| Socio-economic factors | Population, GDP, nighttime lights, city location, road network |
Table 2 Neighborhood factor parameters (Wk) |
| Land use type | Farmland | Forest land | Grassland | Waters | Construction land | Unused land |
|---|---|---|---|---|---|---|
| YREB (Wk) | 0.2 | 0.15 | 0.2 | 0.4 | 0.95 | 0.5 |
| Sichuan-Chongqing (Wk) | 0.2.5 | 0.15 | 0.3 | 0.3 | 0.90 | 0.50 |
| Middle reaches of the Yangtze River (Wk) | 0.3 | 0.2 | 0.2 | 0.4 | 0.95 | 0.55 |
| Yangtze River Delta (Wk) | 0.3 | 0.15 | 0.2 | 0.4 | 1 | 0.45 |
| Yunnan-Guizhou (Wk) | 0.2 | 0.15 | 0.25 | 0.3 | 0.90 | 0.50 |
Table 3 Conversion cost matrix |
| a | b | c | d | e | f | a | b | c | d | e | f | a | b | c | d | e | f | a | b | c | d | e | f | |
|---|---|---|---|---|---|---|---|---|---|---|---|---|---|---|---|---|---|---|---|---|---|---|---|---|
| A | 1 | 0 | 0 | 0 | 0 | 0 | 1 | 0 | 0 | 0 | 1 | 0 | 1 | 1 | 1 | 0 | 0 | 0 | 1 | 1 | 1 | 1 | 0 | 0 |
| B | 1 | 1 | 1 | 0 | 1 | 0 | 1 | 1 | 0 | 0 | 1 | 0 | 0 | 1 | 0 | 0 | 0 | 0 | 0 | 1 | 0 | 0 | 0 | 0 |
| C | 1 | 1 | 1 | 1 | 1 | 1 | 1 | 1 | 1 | 0 | 1 | 0 | 0 | 1 | 1 | 1 | 0 | 0 | 1 | 1 | 1 | 1 | 1 | 0 |
| D | 1 | 0 | 1 | 1 | 1 | 1 | 1 | 1 | 1 | 1 | 1 | 0 | 0 | 1 | 0 | 1 | 0 | 0 | 1 | 0 | 1 | 1 | 1 | 0 |
| E | 1 | 0 | 0 | 0 | 1 | 0 | 0 | 0 | 0 | 0 | 1 | 0 | 0 | 0 | 0 | 0 | 1 | 0 | 0 | 0 | 0 | 0 | 1 | 0 |
| F | 1 | 0 | 0 | 0 | 1 | 1 | 1 | 1 | 1 | 1 | 1 | 1 | 1 | 1 | 1 | 1 | 1 | 1 | 1 | 0 | 1 | 1 | 1 | 1 |
| S1 | S2 | S3 | S4 | |||||||||||||||||||||
Note: a, b, c, d, e, and f represent “farmland”, “forest land”, “grassland”, “water”, “construction land”, and “unused land”, respectively. (0 means not being able to convert, 1 means conversion permitted) |
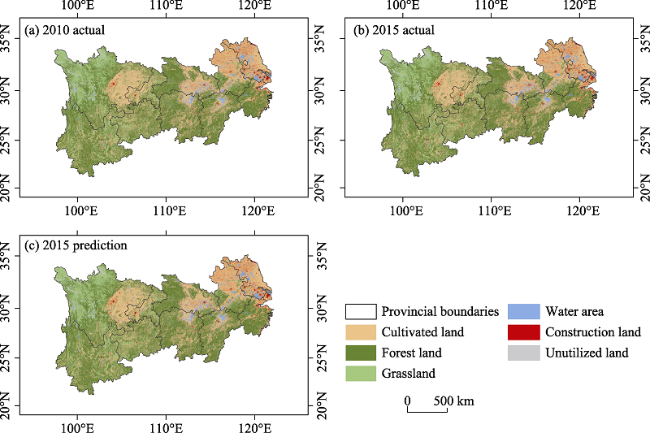
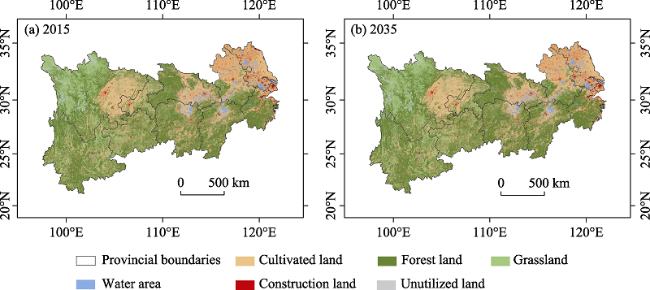
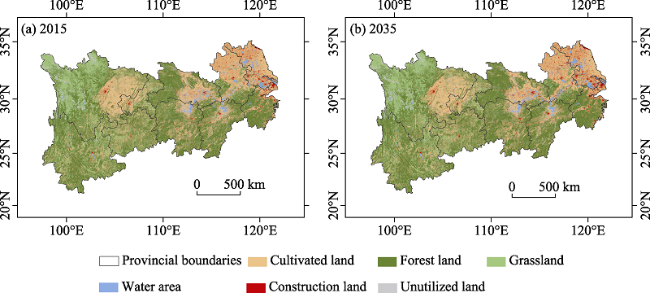
Figure 2 Comparisons of actual and simulated land use in the Yangtze River Economic Belt from 2010 to 2015 |
Table 4 Accuracy of simulation scenario Kappa in 2015 |
| Kappa accuracy | Overall accuracy | |||||||
|---|---|---|---|---|---|---|---|---|
| Yangtze River Delta | Middle reaches of the Yangtze River | Sichuan- Chongqing | Yunnan- Guizhou | Yangtze River Delta | Middle reaches of the Yangtze River | Sichuan- Chongqing | Yunnan- Guizhou | |
| S1 | 0.955443 | 0.96713 | 0.986221 | 0.98676 | 0.97132 | 0.981493 | 0.990421 | 0.992112 |
| S2 | 0.959168 | 0.966249 | 0.982045 | 0.98473 | 0.973503 | 0.980979 | 0.987488 | 0.990876 |
| S3 | 0.970615 | 0.973749 | 0.9863 | 0.986184 | 0.980924 | 0.985184 | 0.990475 | 0.991736 |
| S4 | 0.93099 | 0.964735 | 0.957676 | 0.981285 | 0.955018 | 0.98018 | 0.970522 | 0.988868 |
Table 5 The current situation and simulation of “production-living-ecology” space area in the Yangtze River Economic Belt (km2) |
| Sichuan-Chongqing | Middle reaches of the Yangtze River | Yangtze River Delta | Yunnan-Guizhou | ||
|---|---|---|---|---|---|
| 2015 Area Status | Ecology space | 403308 (71.3%) | 376045 (66.7%) | 135565 (38.8%) | 436858 (78.3%) |
| Production space | 156153 (27.6%) | 171658 (30.5%) | 173588 (49.7%) | 116465 (20.9%) | |
| Living space | 6396 (1.1%) | 15880 (2.8%) | 40323 (11.5%) | 4519 (0.8%) | |
| S1 | Ecology space | 396450 (70.1%) | 366677 (65%) | 131248 (37.6%) | 432460 (77.5%) |
| Production space | 162588 (28.7%) | 178527 (31.7%) | 190116 (54.4%) | 120645 (21.6%) | |
| Living space | 6819 (1.2%) | 18379 (3.3%) | 28112 (8%) | 4737 (0.9%) | |
| S2 | Ecology space | 396897 (70.1%) | 366125 (65%) | 131244 (37.6%) | 432298 (77.5%) |
| Production space | 160903 (28.5) | 167893 (29.8%) | 164949 (47.2%) | 114805 (20.6%) | |
| Living space | 8057 (1.4%) | 29565 (5.2%) | 53283 (15.2%) | 10739 (1.9%) | |
| S3 | Ecology space | 408751 (72.2%) | 385295 (68.4%) | 140563 (40.2%) | 440815 (79%) |
| Production space | 150710 (26.7%) | 162391 (28.8%) | 168588 (48.2%) | 112506 (20.2%) | |
| Living space | 6396 (1.1%) | 15897 (2.8%) | 40325 (11.6%) | 4521 (0.8%) | |
| S4 | Ecology space | 404601 (71.5%) | 382413 (67.9%) | 139649 (40%) | 440134 (78.9%) |
| Production space | 154583 (27.3%) | 163351 (29%) | 162550 (46.5%) | 112587 (20.2%) | |
| Living space | 6672 (1.2%) | 17819 (3.1%) | 47277 (13.5%) | 5121 (0.9%) |
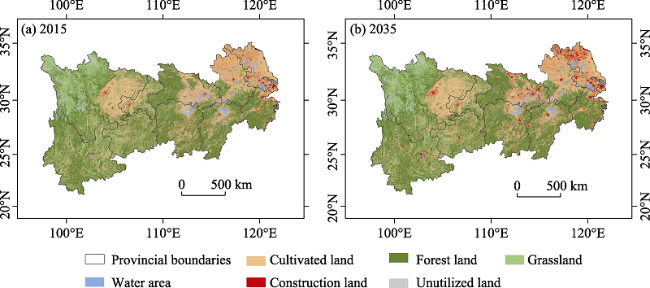
Figure 3 Spatial simulation results of production priority scenario in the Yangtze River Economic Belt |
Figure 4 Spatial simulation results of living priority scenario in the Yangtze River Economic Belt |
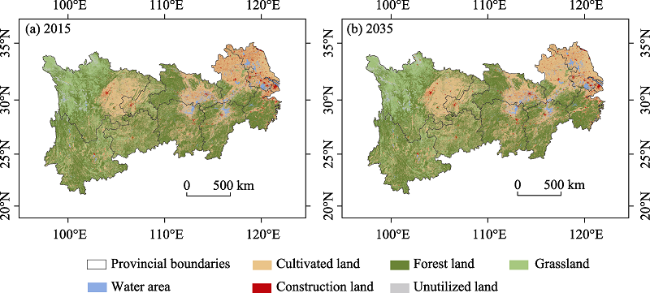
Figure 5 Spatial simulation results of ecology priority scenario in the Yangtze River Economic Belt |
Figure 6 Spatial simulation results of comprehensive optimization scenario in the Yangtze River Economic Belt |
| [1] |
|
| [2] |
|
| [3] |
|
| [4] |
|
| [5] |
|
| [6] |
|
| [7] |
|
| [8] |
|
| [9] |
|
| [10] |
|
| [11] |
|
| [12] |
|
| [13] |
|
| [14] |
|
| [15] |
|
| [16] |
|
| [17] |
|
| [18] |
|
| [19] |
|
| [20] |
|
| [21] |
|
| [22] |
|
| [23] |
|
| [24] |
|
| [25] |
|
| [26] |
|
| [27] |
|
| [28] |
|
| [29] |
|
| [30] |
|
| [31] |
|
/
| 〈 |
|
〉 |