
Journal of Geographical Sciences >
Spatio-temporal characteristics and typical patterns of eco-efficiency of cultivated land use in the Yangtze River Economic Belt, China
|
Ke Xinli (1977-), PhD and Professor, specialized in land use optimization. E-mail: kexl@mail.hzau.edu.cn |
Received date: 2021-12-31
Accepted date: 2022-08-25
Online published: 2023-02-21
Supported by
Post-finance Project for National Social Science(19FGLB071)
Post-finance Project for Philosophy and Social Sciences of the Ministry of Education(18JHQ081)
Outsourcing Project of China Land Surveying and Planning Institute(20211811113)
Youth Foundation of Ministry of Education Humanities and Social Sciences Research(21YJC630182)
Copyright
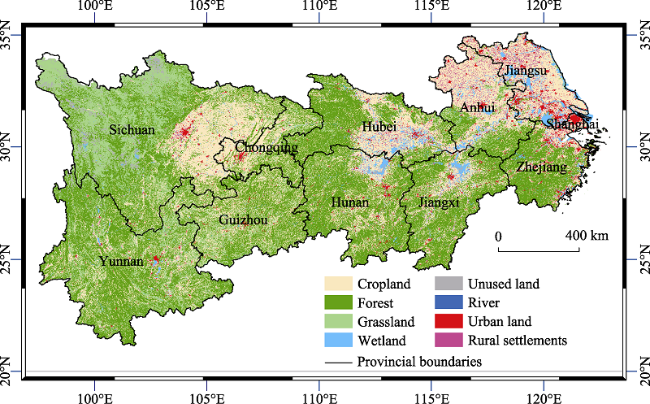
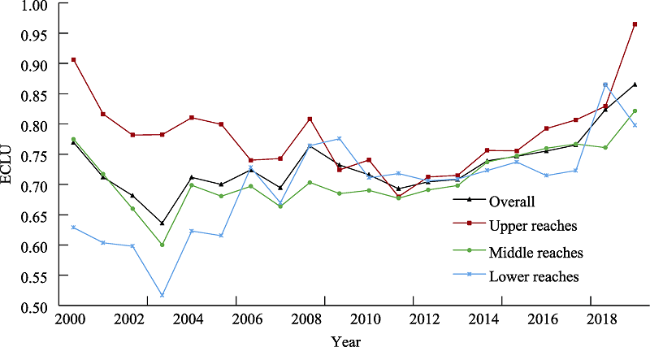
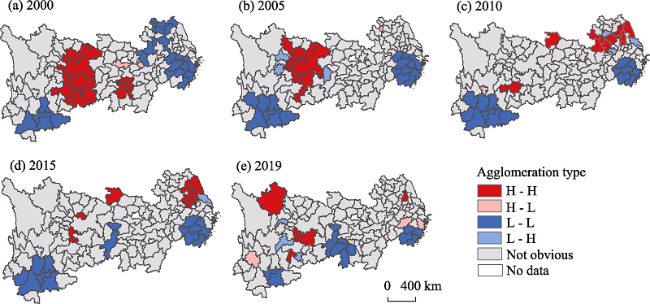
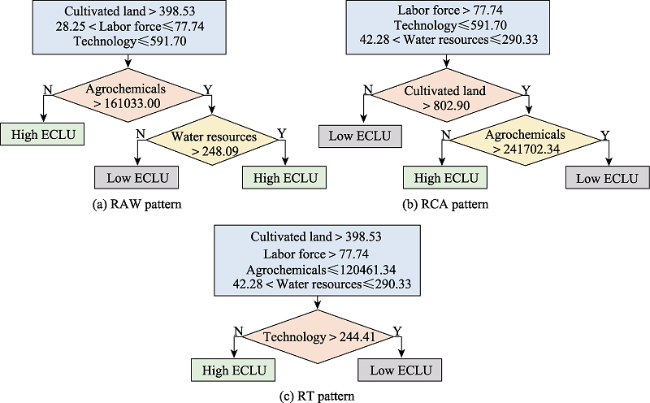
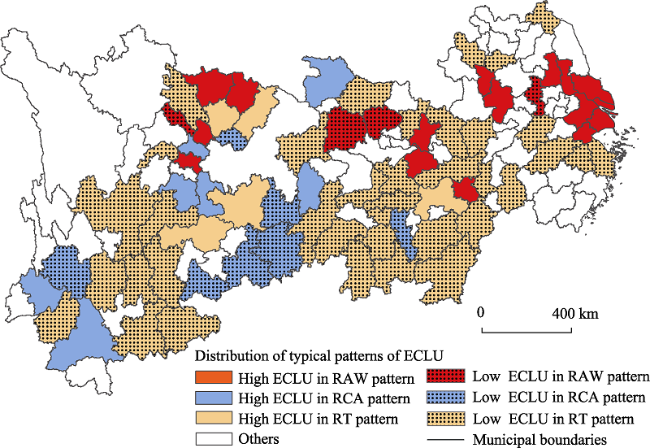
Identifying the dynamics of the eco-efficiency of cultivated land use (ECLU) is important to balance food security and environmental protection. The Yangtze River Economic Belt (YREB) is a vital region of national strategic development in China. However, the spatio-temporal characteristics and typical patterns of the ECLU in the YREB remain unclear. This study aims to reveal the spatio-temporal characteristics of the ECLU by using the super-efficiency slack-based measure (SBM) and a spatial autocorrelation model. The typical patterns of the ECLU were classified based on a decision tree algorithm. The results indicate that the overall ECLU increased from 0.78 to 0.87 from 2000 to 2019, dropping sharply in 2003 before rising again. Different reaches had similar trends. The local indicators of spatial association (LISA) cluster reflect that the spatial distributions of high-high and low-low agglomeration varied dramatically among these years. The ECLU was divided into three typical patterns considering the restriction of agrochemicals and water resources (RAW), cultivated land and agrochemicals (RCA), as well as technology (RT). Most cities belonged to the low ECLU category in RT pattern. Fully understanding the spatio-temporal characteristics and classification of the ECLU will provide a reference for decision-makers to improve the ECLU in different regions.
KE Xinli , ZHANG Ying , ZHOU Ting . Spatio-temporal characteristics and typical patterns of eco-efficiency of cultivated land use in the Yangtze River Economic Belt, China[J]. Journal of Geographical Sciences, 2023 , 33(2) : 357 -372 . DOI: 10.1007/s11442-023-2086-x
Figure 1 Administrative divisions and land uses in the Yangtze River Economic Belt (YREB) (2015) |
Table 1 Regional divisions in the Yangtze River Economic Belt (YREB) |
| Reaches | Provinces / Municipalities |
|---|---|
| Upper | Provinces of Sichuan, Guizhou, Yunnan, and the municipality of Chongqing |
| Middle | Provinces of Hubei, Hunan, Jiangxi |
| Lower | Provinces of Jiangsu, Zhejiang, Anhui, and the municipality of Shanghai |
Table 2 The index system of the eco-efficiency of cultivated land use |
| Types | First-level indicators | Secondary indicators | Unit |
|---|---|---|---|
| Input | Resource | Farm crop sown areas | 103 ha |
| Effective irrigation areas | 103 ha | ||
| Labor force | Workers in the primary industry | 104 persons | |
| Agrochemicals | Fertilizers | ton | |
| Pesticides | ton | ||
| Agricultural films | ton | ||
| Technology | Total power of agricultural machinery | 104 kW | |
| Expected output | Economic | Gross output value of agriculture | 108 yuan |
| Social | Grain yield | 104 ton | |
| Unexpected output | Environmental | Carbon emissions | 104 ton |
Table 3 Carbon source and coefficients of carbon emissions from cultivated land use |
| Carbon source | Coefficient | Unit | Source |
|---|---|---|---|
| Fertilizer | 0.8956 | kg/kg | West and Marland, 2002 |
| Machinery | 0.18 | kg/kW | West and Marland, 2002 |
| Pesticide | 4.9341 | kg/kg | Post and Kwon, 2000 |
| Agricultural film | 5.18 | kg/kg | Li et al., 2011 |
| Farm crop sown area | 3.126 | kg/ha | Li et al., 2011 |
| Effective irrigation area | 20.476 | kg/ha | Li et al., 2011 |
Figure 2 The value of eco-efficiency of cultivated land use in the Yangtze River Economic Belt |
Table 4 The number of cities with effective values of eco-efficiency of cultivated land use |
| Year | Region | |||
|---|---|---|---|---|
| Overall | Upper reaches | Middle reaches | Lower reaches | |
| 2000 | 27 | 16 | 8 | 3 |
| 2005 | 8 | 5 | 1 | 2 |
| 2010 | 14 | 4 | 3 | 7 |
| 2015 | 18 | 4 | 4 | 10 |
| 2019 | 55 | 26 | 13 | 16 |
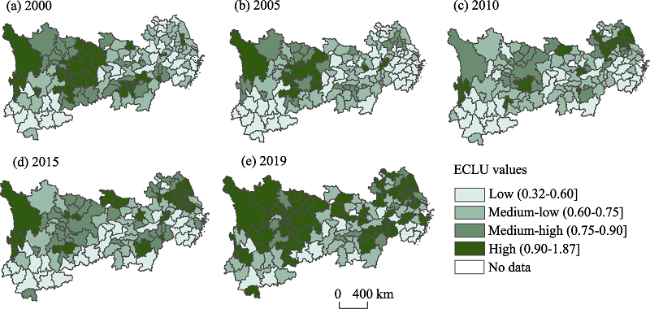
Figure 3 Spatial characteristics of the eco-efficiency of cultivated land use in the Yangtze River Economic Belt |
Table 5 Global Moran’s I of the eco-efficiency of cultivated land use |
| Year | Moran’s I | SD | Z-Value |
|---|---|---|---|
| 2000 | 0.408*** | 0.057 | 7.386 |
| 2005 | 0.397*** | 0.055 | 7.394 |
| 2010 | 0.395*** | 0.056 | 7.294 |
| 2015 | 0.389*** | 0.058 | 6.936 |
| 2019 | 0.200*** | 0.057 | 3.771 |
Note: ***, **, * significant at 1%, 5% and 10% level |
Figure 4 LISA cluster of the eco-efficiency of cultivated land use in the Yangtze River Economic Belt |
Figure 5 Typical patterns of the eco-efficiency of cultivated land use in the Yangtze River Economic Belt |
Figure 6 Distribution of typical patterns of eco-efficiency of cultivated land use in the Yangtze River Economic Belt |
| [1] |
|
| [2] |
|
| [3] |
|
| [4] |
|
| [5] |
|
| [6] |
|
| [7] |
|
| [8] |
|
| [9] |
|
| [10] |
|
| [11] |
|
| [12] |
|
| [13] |
|
| [14] |
|
| [15] |
|
| [16] |
|
| [17] |
|
| [18] |
|
| [19] |
|
| [20] |
|
| [21] |
|
| [22] |
|
| [23] |
|
| [24] |
|
| [25] |
|
| [26] |
|
| [27] |
|
| [28] |
|
| [29] |
|
| [30] |
|
| [31] |
|
| [32] |
|
| [33] |
|
| [34] |
|
| [35] |
|
| [36] |
|
| [37] |
Ministry of Ecology and Environment of the People’s Republic of China et al., 2020. The Second National Pollution Source Census Bulletin. Beijing.
|
| [38] |
Ministry of Environmental Protection and Ministry of Land and Resources, 2014. National Soil Pollution Survey Bulletin. Beijing.
|
| [39] |
|
| [40] |
National Bureau of Statistics of China, 2022. Announcement of the National Bureau of Statistics on 2021 grain output data. http://www.stats.gov.cn/tjsj/zxfb/202112/t20211206_1825058.html.
|
| [41] |
|
| [42] |
OECD, 1998. Eco-efficiency. https://www.oecd-ilibrary.org/environment/eco-efficiency_9789264040304-en.
|
| [43] |
|
| [44] |
|
| [45] |
Political Bureau of the Central Committee of the Communist Party of China, 2016. Yangtze River Economic Belt Development Plan Outline. Beijing.
|
| [46] |
|
| [47] |
|
| [48] |
|
| [49] |
|
| [50] |
|
| [51] |
|
| [52] |
|
| [53] |
|
| [54] |
|
| [55] |
|
| [56] |
WBCSD, 1996. Eco-efficient leadership for improved economic and environmental performance. World Business Council for Sustainable Development.
|
| [57] |
|
| [58] |
|
| [59] |
|
| [60] |
|
| [61] |
|
| [62] |
|
| [63] |
|
| [64] |
|
| [65] |
|
| [66] |
|
| [67] |
|
| [68] |
|
| [69] |
|
| [70] |
|
/
| 〈 |
|
〉 |