
Journal of Geographical Sciences >
Understanding the change of land space utilization efficiency with different functions and its coupling coordination: A case study of Urban Agglomeration in the Middle Reaches of the Yangtze River, China
|
Yang Bin (1992-), PhD, specialized in land space utilization and management. E-mail: binyang2021@cumt.edu.cn |
Received date: 2021-09-03
Accepted date: 2021-12-24
Online published: 2023-02-21
Supported by
National Natural Science Foundation of China(42171249)
National Natural Science Foundation of China(42201270)
National Social Science Foundation of China(20BJY119)
Jiangsu Social Science Foundation(18GLC016)
Copyright
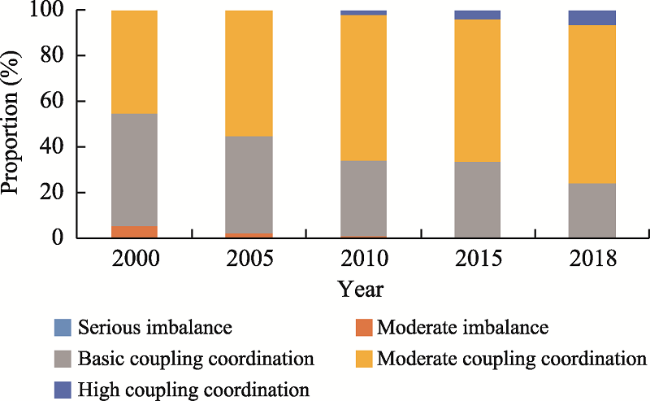
Land spaces function in capacities of urban development, agricultural production, and ecological conservation, among many others. Research of land space utilization efficiency (LSUE) and coupling coordination relationships among its subsystems are significant for sustainable land space development. In this study, taking the Urban Agglomeration in the Middle Reaches of the Yangtze River (UAMRYR) as the study area, we establish a measurement index system to evaluate the LSUE (2000-2018) and analyze its coupling coordination degree by utilizing an improved coupling coordination model. The main results include the following. (1) The average efficiency levels of urban space and agricultural space in the UAMRYR increased 2000-2018, while the average efficiency of ecological space declined. (2) The spatial pattern of the LSUE values varied greatly, with the distributions of high-efficiency and low-efficiency levels significantly different. (3) The coupling degree of LSUE includes three types, i.e., high-level coupling, break-in, and antagonism. Each coupling degree type was characterized by change over time. (4) The proportion of areas with high coupling coordination and moderate coupling coordination increased from 2000 to 2018, while the proportion of areas with basic coupling coordination, moderate imbalance, and serious imbalance declined during this period. Given that the spatial differentiation of the LSUE and its coupling coordination, it is necessary to implement a differential land space development strategy in the UAMRYR. This study is helpful to promote the efficient utilization and coordinated development of land space utilization systems.
YANG Bin , YANG Jun , TAN Li , XIAO Jianying . Understanding the change of land space utilization efficiency with different functions and its coupling coordination: A case study of Urban Agglomeration in the Middle Reaches of the Yangtze River, China[J]. Journal of Geographical Sciences, 2023 , 33(2) : 289 -310 . DOI: 10.1007/s11442-023-2083-0
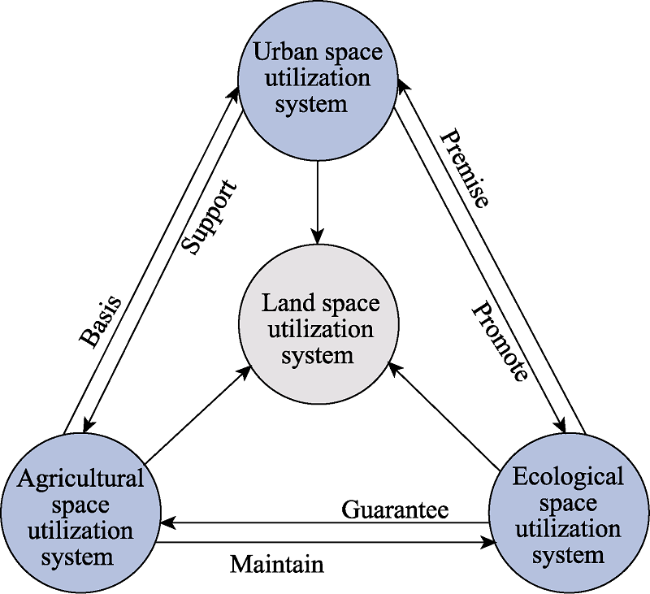
Figure 1 The interaction of land space utilization subsystems |
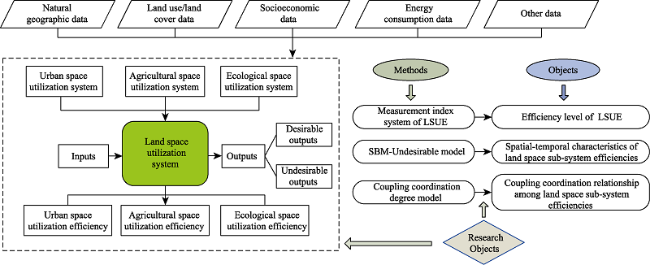
Figure 2 The workflow of this study |
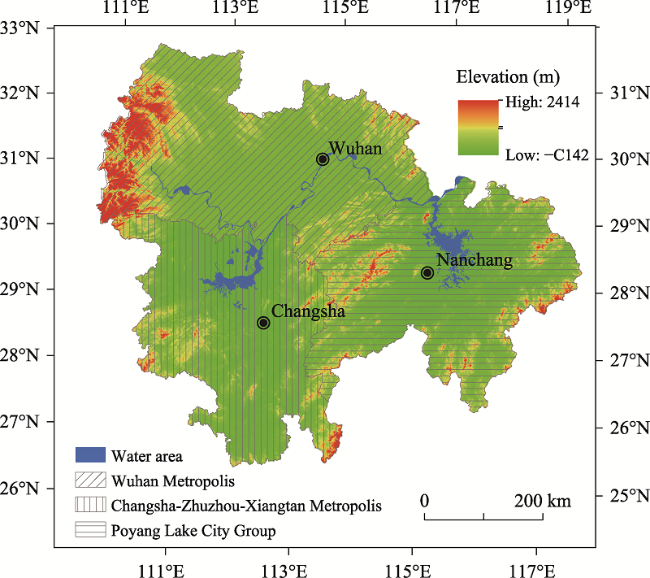
Figure 3 Location and elevation of the Middle Reaches of the Yangtze River (UAMRYR) |
Table 1 Composition and measurement of agricultural non-point source pollutions |
| Pollution source | Measurement | Reference |
|---|---|---|
| Chemical fertilizers | Nitrogen fertilizer, phosphorus fertilizer, compound fertilizer × TN/TP pollution coefficient × loss rate | Li et al. (2011) |
| Organic fertilizers | Rural population and the number of pigs, cattle, sheep, and poultry × (1- the rate of utilization) × Fecal and urine excretion coefficient × pollution coefficients of COD, TN, and TP | Chen et al. (2006); Pan and Ying (2013) |
| Farmland wastes | Crop straw, fruit, and vegetable outputs × pollution coefficients of COD, TN, and TP | Li et al. (2011) |
Table 2 Agricultural carbon emission coefficients |
| Carbon source | Coefficients | Units | References |
|---|---|---|---|
| Chemical fertilizers | 0.896 | kg·kg−1 | West and Marland (2002) |
| Plastic film | 5.170 | kg·kg−1 | Li et al. (2011) |
| Agricultural machinery | 0.190 | kg·kw−1 | Tian et al. (2012) |
| Agricultural plowing | 312.580 | kg·km−2 | Tian and Zhang (2013) |
| Agricultural irrigation | 20.476 | kg·hm−2 | Li et al. (2011) |
Table 3 The measurement index system of the land space utilization efficiency |
| Criteria | Level indicators | Units | Attributes | |
|---|---|---|---|---|
| Urban space utilization efficiency (A) | Inputs | Urban construction land area (AI-1) | ha | + |
| Total investment in fixed assets (AI-2) | 100 million yuan | + | ||
| People employed in secondary and tertiary industries (AI-3) | persons | + | ||
| Outputs | GDP of secondary and tertiary industries (AO-1) | 100 million yuan | desirable output | |
| Average wages of urban workers (AO-2) | yuan | desirable output | ||
| Discharge of industrial wastewater (AO-3) | tons | undesirable output | ||
| Emissions of industrial SO2 (AO-4) | tons | undesirable output | ||
| Emissions of solid waste discharge (AO-5) | tons | undesirable output | ||
| Agricultural space utilization efficiency (B) | Inputs | The sown area of crops (BI-1) | ha | + |
| People employed in primary industry (BI-2) | person | + | ||
| Total power of agricultural machinery (BI-3) | 10,000 kilowatts | + | ||
| Amount of agricultural film (BI-4) | tons | - | ||
| Amount of chemical fertilizer (BI-5) | tons | - | ||
| Outputs | The annual output value of agriculture (BO-1) | 100 million yuan | desirable output | |
| Per capita annual income of farmers (BO-2) | yuan | desirable output | ||
| Agricultural non-point source pollution (BO-3) | ton | undesirable output | ||
| Carbon emissions (BO-4) | ton | undesirable output | ||
| Ecological space utilization efficiency (C) | Inputs | The proportion of ecological land area (CI-1) | % | + |
| Energy consumption per unit of GDP (CI-2) | tons | - | ||
| Outputs | Ecosystem service value (CO-1) | yuan | desirable output | |
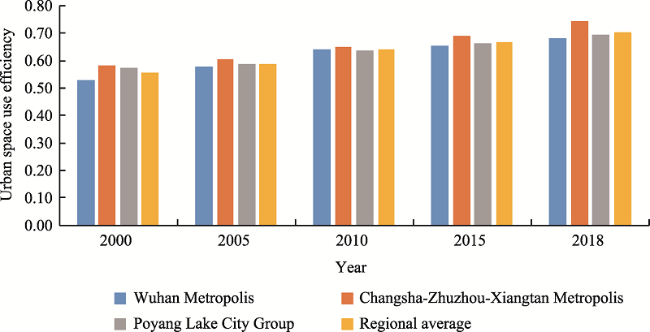
Figure 4 The results of urban space use efficiency in the UAMRYR from 2000 to 2018 |
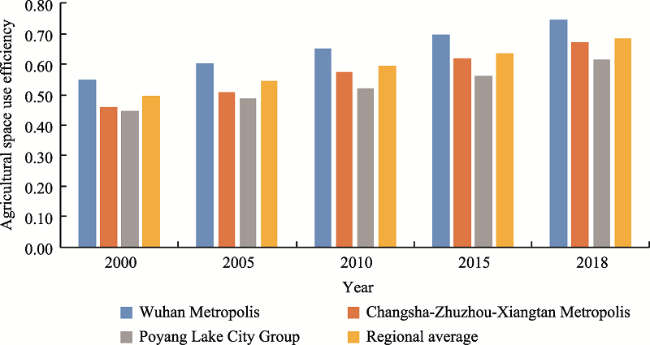
Figure 5 The results of agricultural space use efficiency in the UAMRYR from 2000 to 2018 |
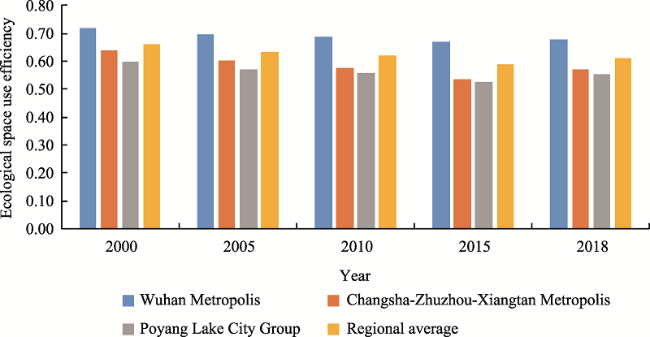
Figure 6 The results of ecological space use efficiency in the UAMRYR from 2000 to 2018 |
Figure 7 Spatio-temporal variations of urban space use efficiency in the UAMRYR from 2000 to 2018 |
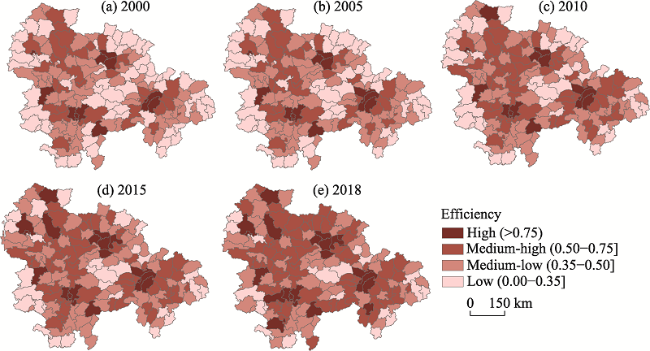
Figure 8 Spatio-temporal variations of agricultural space use efficiency in the UAMRYR from 2000 to 2018 |
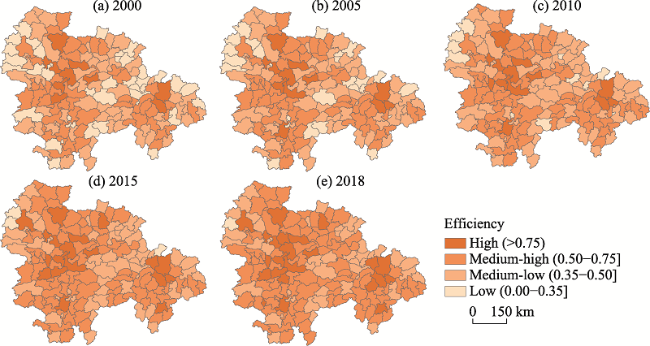
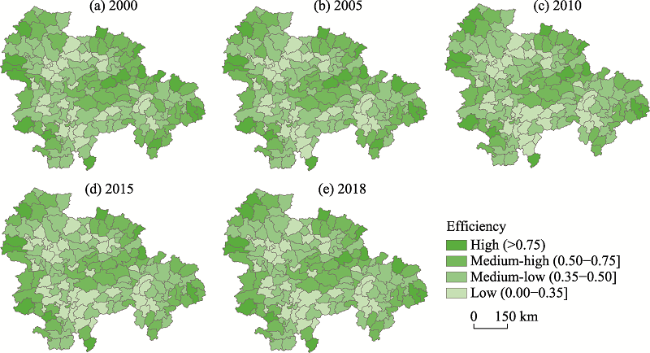
Figure 9 Spatio-temporal variations of ecological space use efficiency in the UAMRYR from 2000 to 2018 |
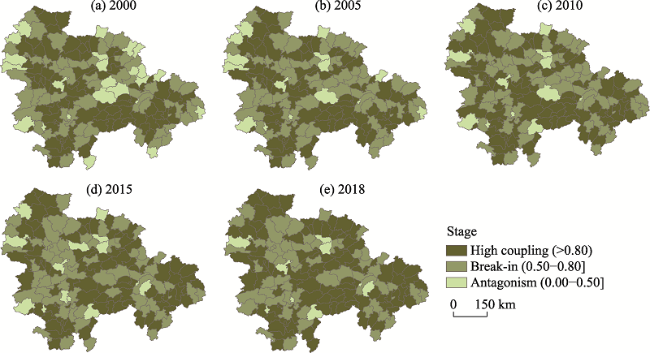
Figure 10 Spatio-temporal variations of coupling degree in the UAMRYR from 2000 to 2018 |
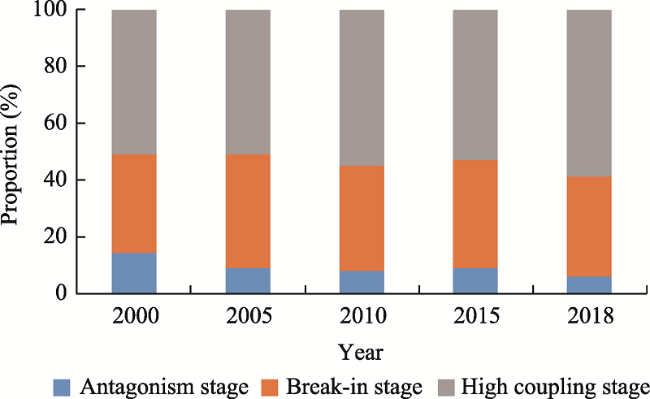
Figure 11 The proportion of areas at different coupling stages 2000-2018 in the UAMRYR |
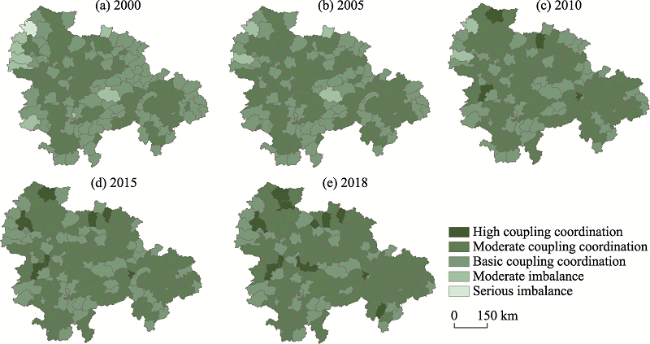
Figure 12 Spatio-temporal variations of coupling coordination degree in the UAMRYR from 2000 to 2018 |
Figure 13 The proportion of areas at different coupling coordination stages 2000-2018 in the UAMRYR |
| [1] |
|
| [2] |
|
| [3] |
|
| [4] |
|
| [5] |
|
| [6] |
|
| [7] |
|
| [8] |
|
| [9] |
|
| [10] |
|
| [11] |
|
| [12] |
|
| [13] |
|
| [14] |
|
| [15] |
|
| [16] |
|
| [17] |
|
| [18] |
|
| [19] |
|
| [20] |
|
| [21] |
|
| [22] |
|
| [23] |
|
| [24] |
|
| [25] |
|
| [26] |
|
| [27] |
|
| [28] |
|
| [29] |
|
| [30] |
|
| [31] |
|
| [32] |
|
| [33] |
|
| [34] |
|
| [35] |
|
| [36] |
|
| [37] |
|
| [38] |
|
| [39] |
|
| [40] |
|
| [41] |
|
| [42] |
|
| [43] |
|
| [44] |
|
| [45] |
|
| [46] |
|
| [47] |
|
| [48] |
|
| [49] |
|
| [50] |
|
| [51] |
|
| [52] |
|
| [53] |
|
| [54] |
|
| [55] |
|
| [56] |
|
| [57] |
|
| [58] |
|
| [59] |
|
| [60] |
|
| [61] |
|
| [62] |
|
| [63] |
|
| [64] |
|
| [65] |
|
| [66] |
|
| [67] |
|
| [68] |
|
| [69] |
|
| [70] |
|
| [71] |
|
| [72] |
|
| [73] |
|
| [74] |
|
| [75] |
|
| [76] |
|
| [77] |
|
| [78] |
|
| [79] |
|
| [80] |
|
| [81] |
|
| [82] |
|
| [83] |
|
| [84] |
|
| [85] |
|
| [86] |
|
| [87] |
|
| [88] |
|
/
| 〈 |
|
〉 |