
Journal of Geographical Sciences >
Evaluation, simulation, and optimization of land use spatial patterns for high-quality de-velopment: A case study of Zhengzhou city, China
|
Zhu Wenchao (1982-), PhD Candidate, specialized in natural resource management. E-mail: hehe317@163.com |
Received date: 2021-12-29
Accepted date: 2022-09-21
Online published: 2023-02-21
Supported by
National Natural Science Foundation of China(42071358)
National Natural Science Foundation of China(41671406)
Fundamental Research Funds for the Central Universities(CCNU22QN018)
The Self-Determined Research Funds of CCNU from the Colleges’ Basic Research and Operation of MOE(CCNU20TS035)
Copyright
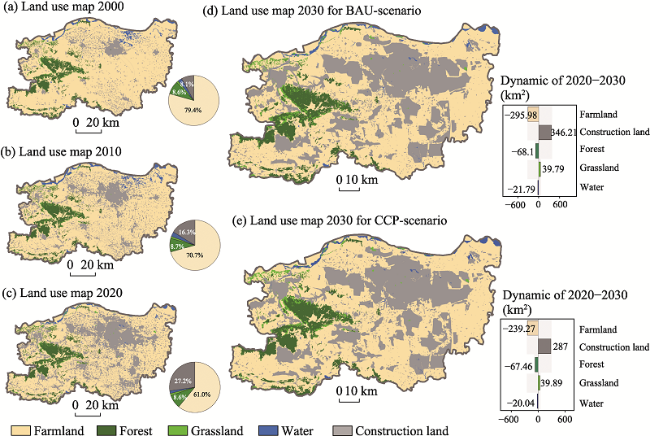
High-intensity land use and resource overloaded-induced regional land use spatial pattern (LUSP) are essential and challenging for high-quality development. The empirical studies have shown that a scientific land uses spatial layout, and the supporting system should be based on a historical perspective and require better considering the double influence between the current characteristics and future dynamics. This study proposes a comprehensive framework that integrates the resource environment carrying capacity (RECC) and land use change (LUC) to investigate strategies for optimizing the spatial pattern of land use for high-quality development. China’s Zhengzhou city was the subject of a case study whose datasets include remote sensing, spatial monitoring, statistics, and open sources. Three significant results emerged from the analysis: (1) The RECC has significant spatial differentiation but does not follow a specific spatial law, and regions with relatively perfect ecosystems may not necessarily have better RECC. (2) From 2020 to 2030, the construction land and farmland will fluctuate wildly, with the former increasing by 346.21 km2 and the latter decreasing by 295.98 km2. (3) The study area is divided into five zones, including resource conservation, ecological carrying, living core, suitable construction, and grain supply zones, and each one has its LUSP optimization orientation. This uneven distribution of RECC reflects functional defects in the development and utilization of LUSP. In addition, the increase in construction land and the sharp decline of farmland pose potential threats to the sustainable development of the study area. Hence, these two elements cannot be ignored in the future high-quality development process. The findings indicate that the LUSP optimization based on dual dimensions of RECC and LUC is more realistic than a single-dimension solution, exhibiting the LUSP optimization’s effectiveness and applicability.
ZHU Wenchao , JIANG Zhimeng , CEN Luyu , WU Hao . Evaluation, simulation, and optimization of land use spatial patterns for high-quality de-velopment: A case study of Zhengzhou city, China[J]. Journal of Geographical Sciences, 2023 , 33(2) : 266 -288 . DOI: 10.1007/s11442-023-2082-1
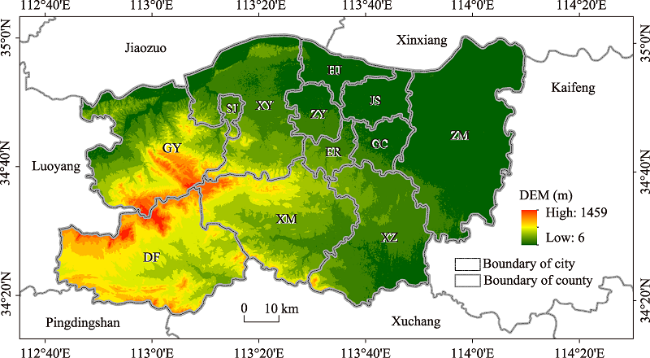
Figure 1 Location of Zhengzhou, Henan province, central China |
Table 1 Data used in this research |
| Data type | Data name | Data source |
|---|---|---|
| Remote sensing | DEM | ASTER GDEM (asterweb.jpl.nasa.gov/gdem.asp) |
| Land use | Globeland30 (http://globeland30.org/) | |
| VFC | Landsat TM (https://glovis.usgs.gov/) | |
| NPP | Landsat TM (https://glovis.usgs.gov/) | |
| NDVI | Landsat TM (https://glovis.usgs.gov/) | |
| Monitoring | Climate | National Meteorological Science Data Center (http://data.cma.cn/) |
| Atmosphere | Atmospheric Composition Analysis Group (https://sites.wustl.edu/acag/) | |
| Geological condition | National Earth System Science Data Center (http://www.geodata.cn/) | |
| Open-source | Point of interest | Amap API (https://lbs.amap.com/) |
| Traffic network | OpenStreetMap (https://www.openstreetmap.org/) | |
| Statistics | Population | Henan Provincial Statistics Bureau (http://tjj.henan.gov.cn/) |
| GDP | Henan Provincial Statistics Bureau (http://tjj.henan.gov.cn/) | |
| Citizen income | Henan Provincial Statistics Bureau (http://tjj.henan.gov.cn/) | |
| Water resource | Water Resources Bureau (http://zzsl.zhengzhou.gov.cn/) |
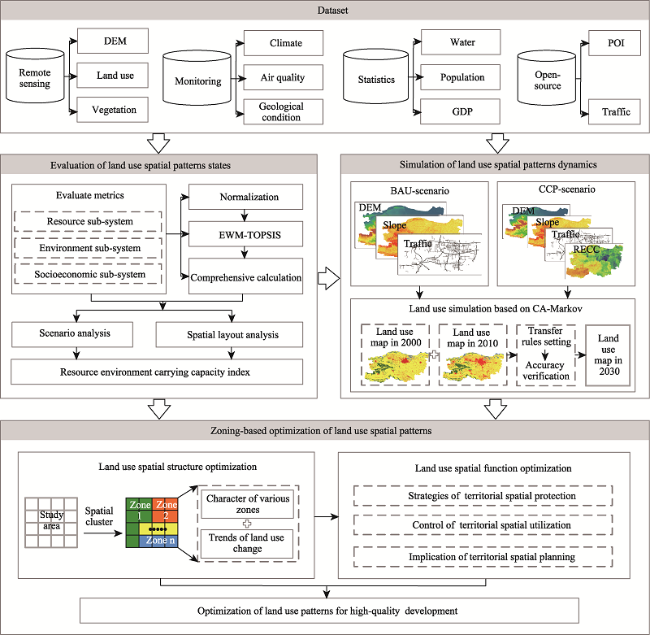
Figure 2 Flowchart of research methodology |
Table 2 Indicators of RECC |
| Objective | Category | Index | Impact | |
|---|---|---|---|---|
| First-level index | Second-level index | |||
| Resource environment carrying capacity | Resource carrying capacity | Land resources | Relief of land surface, R1 | Negative |
| Degree of land use mix, R2 | Positive | |||
| Area of farmland per capita, R3 | Positive | |||
| Water resources | Water resources per capita, R4 | Positive | ||
| Water consumption per unit of GDP, R5 | Negative | |||
| Public resources | Density of the road network, R6 | Positive | ||
| Density of POI, R7 | Positive | |||
| Environment carrying capacity | Atmosphere environment | Level of air quality, E1 | Negative | |
| Ecological environment | Vegetation fractional coverage, E2 | Positive | ||
| Vegetation net primary productivity, E3 | Positive | |||
| Normalized difference vegetation Index, E4 | Positive | |||
| Disaster risk to the environment | Flooding risk, E5 | Negative | ||
| Ecological sensitivity, E6 | Negative | |||
| Socioeconomic carrying capacity | Social factor | Level of urbanization, S1 | Positive | |
| Population density, S2 | Negative | |||
| Economic factor | GDP per capita, S3 | Positive | ||
| Per capita net income, S4 | Positive | |||
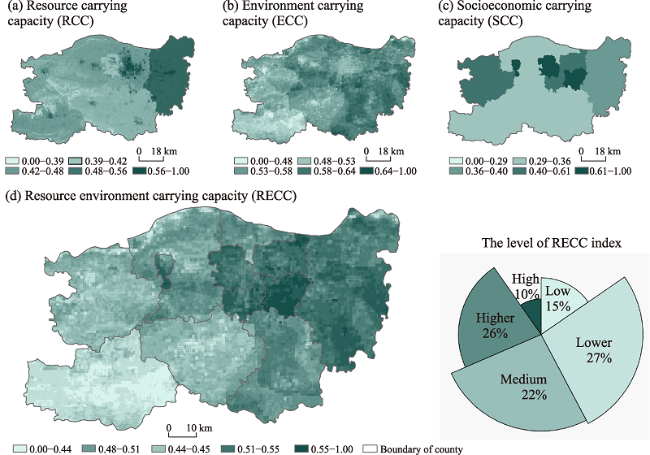
Figure 3 Resource environment carrying capacity index of Zhengzhou city |
Table 3 Results of Kappa statistics of the CA-Markov model |
| Scenario | Kappa for no | Kappa for location | Kappa for standard | Kappa for location Strada |
|---|---|---|---|---|
| BAU | 0.7858 | 0.7661 | 0.7429 | 0.7661 |
| CCP | 0.7873 | 0.7679 | 0.7447 | 0.7679 |
Figure 4 The historic and simulated land use of Zhengzhou city |
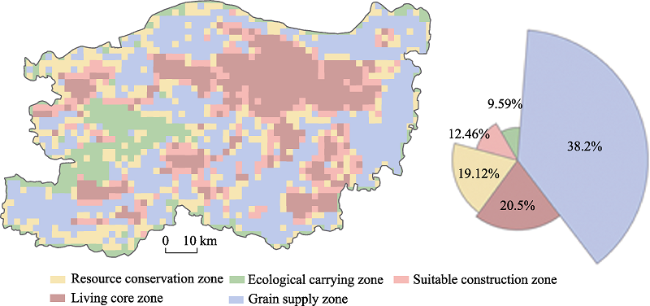
Figure 5 Distribution of land use spatial pattern zones in Zhengzhou city |
Table 4 Land use change in 2020-2030 of land use spatial pattern zones in Zhengzhou city |
| Land use | Scenario | ECZ (km2) | GSZ (km2) | LCZ (km2) | RCZ (km2) | SCZ (km2) | 2020-2030 (km2) | 2020-2030 (%) |
|---|---|---|---|---|---|---|---|---|
| Farmland | BAU | -146.48 | 1120.38 | -1663.74 | 81.71 | -707.35 | -1315.48 | -17.35% |
| CCP | -141.28 | 1195.65 | -1644.54 | 168.72 | -641.99 | -1063.44 | -14.03% | |
| Forest | BAU | -78.97 | -65.18 | 4.40 | -134.51 | -28.40 | -302.68 | -3.99% |
| CCP | 48.33 | -118.96 | -36.94 | -147.00 | -45.24 | -299.80 | -3.95% | |
| Grassland | BAU | 123.63 | -2.13 | -1.25 | 57.66 | -1.07 | 176.84 | 2.33% |
| CCP | 17.24 | 74.58 | 40.08 | 20.82 | 24.58 | 177.29 | 2.34% | |
| Water | BAU | -16.97 | -18.46 | -21.32 | -25.64 | -14.44 | -96.84 | -1.28% |
| CCP | -17.50 | -18.42 | -19.25 | -20.68 | -13.30 | -89.14 | -1.18% | |
| Construction land | BAU | 13.83 | -988.87 | 1720.33 | 25.99 | 766.88 | 1538.16 | 20.29% |
| CCP | 14.60 | -1057.67 | 1697.75 | -67.64 | 688.06 | 1275.09 | 16.82% | |
| 2020-2030 (km2) | -183.58 | 120.92 | 75.51 | -40.58 | 27.73 | |||
| 2020-2030 (%) | -2.42% | 1.60% | 1.00% | -0.54% | 0.37% | |||
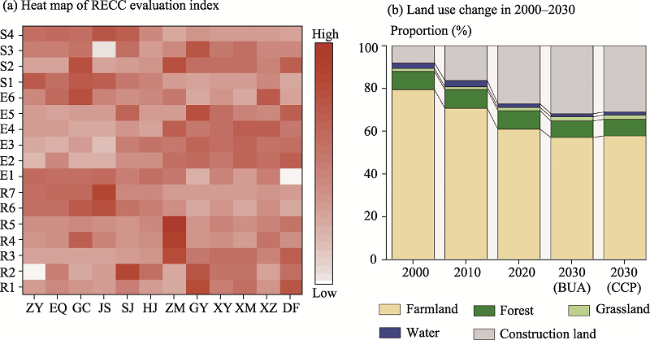
Figure 6 Heat map of RECC evaluation index (a), and land use change (b) in 2000-2030 |
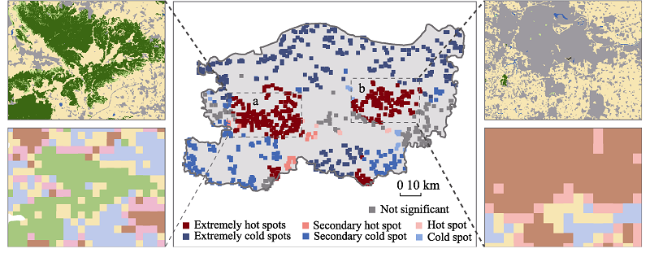
Figure 7 Differences in land use simulation between BAU and CCP scenarios |
Table 5 The suitable modes of future land development in Zhengzhou city |
| Zone | Average RECC level | Primary land use type | Suitable development orientation |
|---|---|---|---|
| RCZ | Lower | Farmland | Ecosystem services, resource supply |
| ECZ | Low | Forest, Grassland | Environmental protection, carbon neutrality |
| LCZ | High | Construction land | Administrative functions, urban agriculture |
| SCZ | Higher | Construction land | Undertaking industrial transfer |
| GSZ | Medium | Farmland | Food production, rural tourism |
| [1] |
|
| [2] |
|
| [3] |
|
| [4] |
|
| [5] |
|
| [6] |
|
| [7] |
|
| [8] |
|
| [9] |
|
| [10] |
|
| [11] |
|
| [12] |
|
| [13] |
|
| [14] |
|
| [15] |
|
| [16] |
|
| [17] |
|
| [18] |
|
| [19] |
|
| [20] |
|
| [21] |
|
| [22] |
|
| [23] |
|
| [24] |
|
| [25] |
|
| [26] |
|
| [27] |
|
| [28] |
|
| [29] |
|
| [30] |
|
| [31] |
|
| [32] |
|
| [33] |
|
| [34] |
|
| [35] |
|
| [36] |
|
| [37] |
|
| [38] |
|
| [39] |
|
| [40] |
|
| [41] |
|
| [42] |
|
| [43] |
|
| [44] |
|
| [45] |
|
| [46] |
|
| [47] |
|
| [48] |
|
| [49] |
|
| [50] |
|
| [51] |
|
| [52] |
|
| [53] |
|
| [54] |
|
| [55] |
|
| [56] |
|
| [57] |
|
| [58] |
|
| [59] |
|
| [60] |
|
| [61] |
|
| [62] |
|
| [63] |
|
| [64] |
|
| [65] |
|
| [66] |
|
| [67] |
|
| [68] |
|
| [69] |
|
/
| 〈 |
|
〉 |