Special Issue: Land for High-quality Development

Dynamics of the eco-environmental quality in response to land use changes in rapidly urbanizing areas:A case study of Wuhan, China from 2000 to 2018

  • HU Can , 1, 2 ,
  • SONG Min , 3, * ,
  • ZHANG Anlu 1
Expand
  • 1. College of Land Management, Huazhong Agricultural University, Wuhan 430070, China
  • 2. Sanford School of Public Policy, Duke University, Durham, NC 27708, USA
  • 3. School of Business Administration, Zhongnan University of Economics and Law, Wuhan 430073, China
*Song Min (1982-), Professor, specialized in utilization and management of land resources. E-mail:

Hu Can (1994-), PhD Candidate, specialized in utilization and management of land resources. E-mail:

Received date: 2021-08-04

  Accepted date: 2022-03-14

  Online published: 2023-02-21

Supported by

National Natural Science Foundation of China(71774174)

National Social Science Foundation of China(18ZDA054)

Humanities and Social Sciences Youth Foundation of China(21YJA790072)

China Scholarship Council(202106760072)

Copyright

© 2023

Abstract

The dramatic land use changes that occur in rapidly urbanized areas are important inducement to changes in the eco-environmental quality. Investigating urban land use changes and their eco-environmental quality responses can provide theoretical support and a decision-making basis for sustainable and high-quality development in rapidly urbanizing areas. Taking Wuhan, China, as the study area, this paper extracts land use information using Landsat satellite remote sensing images and a support vector machine classification. Based on this, a remote sensing-based ecological index evaluation model including humidity, greenness, dryness and heat is constructed to explore the changes in land use and their eco-environmental quality responses from 2000 to 2018. The results show that (1) the structure, extent and spatial layout of land use in Wuhan from 2000 to 2018 have undergone tremendous changes under rapid urbanization, and the change of construction land is the greatest among all land use types; (2) the overall quality of eco-environment in Wuhan continues to improve as the scale of the improved eco-environment areas is greater than that of the deteriorated areas. The direction and magnitude of the impact of each indicator on the eco-environmental quality are different; (3) the improvement or deterioration of eco-environmental quality is closely related to the changes of different land use types within the study area. The eco-environmental quality shows significant spatial heterogeneity, especially between the main urban areas and the suburban areas. This paper argues that reasonably adjusting the land use structure can serve to maintain or even improve the quality of the regional eco-environment. Finally, this study puts forward suggestions for the coordinated development of land use and the eco-environment in rapidly urbanizing areas.

Cite this article

HU Can , SONG Min , ZHANG Anlu . Dynamics of the eco-environmental quality in response to land use changes in rapidly urbanizing areas:A case study of Wuhan, China from 2000 to 2018[J]. Journal of Geographical Sciences, 2023 , 33(2) : 245 -265 . DOI: 10.1007/s11442-023-2081-2

1 Introduction

The feedback of the eco-environment to land use changes is a hot topic in global environmental change research. Land use links socioeconomic activities with ecological processes and impacts ecosystem services (Lang and Song, 2019). With the in-depth development of global change research projects such as the NASA Land-Cover and Land-Use Change (LCLUC) Program and the Global Land Project (GLP), land use changes are acknowledged as one of the important causes of global environmental changes and are essential breakthroughs in investigating the relationships between human activities and the eco-environment (Daunt and Silva, 2019). Previous studies have suggested that land use changes among in different periods show obvious spatial heterogeneity (Bryan et al., 2018). These diverse changes have differentiated impacts on the supply of ecosystem services and affect the well-being of humans (Narducci et al., 2019). In areas of rapid urbanization, the competition among different land use types, especially between construction land and its adjacent land (such as farmland, forestland, grassland, and water), is extremely prominent, leading to fierce conflicts between the supply and demand of ecosystem functions (Gałecka-Drozda et al., 2019). Due to these conflicts, a series of ecological issues, such as air pollution, soil degradation, heat island effects, and biodiversity declines, are triggered, posing serious threats to human survival and development (Venter et al., 2016; Salhi et al., 2021; Xiong and Zhang, 2021). Therefore, in rapidly urbanizing areas, assessing the status and trends of land use changes and their eco-environmental impacts are of great significance for formulating land use planning strategies and implementing eco-environmental protection measures; these goals are conducive to the sustainable use of land and to the stability of ecosystems.
High-quality development was proposed by the 19th National Congress of the Communist Party of China and became the pursued goal during the 14th Five-year Plan period (2021-2025). High-quality development is a kind of economic development mode that is different from those followed in the past. It aims to establish a green, low-carbon and circular economy pattern; to do this, it must be based on the concept of green development and ecological priority. However, due to the acceleration of land-based urbanization in China since the 1980s, the intensity of land use has dramatically increased, and land use patterns have transformed enormously. Land use activities, such as deforestation, the reclamation of farmland from lakes, and the expansion of construction land, have caused increased carbon emissions, climate warming, soil erosion, biodiversity declines and water pollution (Zhao et al., 2019; Kuang, 2020). Previous studies on Chinese cities have reflected that urban expansion leads to declines in the supply of ecosystem services (Ye et al., 2018). In China, the ecological overload caused by a 1% increase in urbanization in 2006-2030 is 2.42 times greater than that in 1980-2005 (Fang et al., 2016). Thus, China, the country with the third-largest land area and the largest population in the world, is facing a trade-off between land development and eco-environmental conservation (Jin et al., 2019). Determining how to change the land use pattern and solve the environmental problems caused by land use changes are urgent issues in the context of high-quality development.
In the last few decades, the body of literature about the impacts of land use changes on the eco-environment has grown (Pickett et al., 2011; Hauser et al., 2017; Liu et al., 2018b). Land use changes affect the eco-environment in many ways, such as influencing the atmosphere, water, and soil (Grimm et al., 2008; Jin et al., 2020). The changes of land use patterns and land use structure, as well as the resulting migration of economic development space have a sufficient impact on eco-environment (Lichtenberg and Ding, 2008). Therefore, it is necessary to use a comprehensive multi-indicator eco-environmental impact assessment system to analyze the response of the eco-environmental quality to land use changes. However, due to the complexity of the eco-environment’s response to land use changes, evaluations of eco-environmental consequences caused by land use changes are still developing. From the middle of the last century, scholars have begun to study the theory, method and application of eco-environment assessment. In the early research, the impact of land use on eco-environment was evaluated by calculating the changes in ecosystem service values. The concept of ecosystem services value assessment proposed by Westman (1977), and the Environmental Monitoring and Assessment Project (EMAP) carried out by the US Environmental Protection Agency provide the basis for conducting eco-environment assessment. Subsequently, more researchers began to pay attention to the eco-environmental quality and its changes on different scales, using multi-temporal remote sensing images and landscape pattern analysis methods to build diversified eco-environment assessment models (Zhao et al., 2016; Peng et al., 2017). In terms of research methods, indicators (systems) and comprehensive evaluation methods are commonly selected to analyze the changes in and laws of eco-environmental quality in different regions, and empirical research is carried out based on multisource remote sensing data and GIS spatial analysis technology (Guo et al., 2020). Remote sensing and GIS have become key tools in various environmental evaluation fields (Locke et al., 2014; Ariken et al., 2020). Xu (2013) constructed a remote sensing-based ecological index (RSEI) composed of greenness, humidity, heat and dryness to monitor changes in the eco-environmental quality. The four components of this index are vital ecological factors with which people can directly perceive whether the ecological conditions are good, and this index provides an effective quantitative reference for research on regional ecological quality, especially in studies monitoring urban ecosystems. Some studies used comprehensive indicator as well as remote sensing analysis method to analyze the eco-environmental changes caused by land use changes (Cui et al., 2015; Song et al., 2020). Sun et al. (2020) discussed the effect of land-use changes on eco-environmental quality in Hainan Island by an Eco-environmental Quality Index (EQI) model which included habitat quality index, NDVI, NDMI and NDSI. In recent years, the research scope of the effect of land-use changes on eco-environmental quality has expanded from single-factor fields such as river and lake basins to comprehensive fields such as cities, rural areas, and regions (Fang et al., 2016; Zhang et al., 2020). However, considering that the complexity and spatial heterogeneity of land use changes in rapidly urbanizing areas, the dynamics response of the eco-environmental quality to land use changes is worthy of further discussion.
As the only megacity in the six provinces of central China, Wuhan has experienced rapid urbanization, frequent land use conversions and drastic eco-environment changes, and the city is facing a contradiction between land use and eco-environmental protection. Against this backdrop, taking Wuhan, China, as the study area, based on an investigation of the spatial and temporal land use evolution that have occurred in this city, this paper evaluates the eco-environmental quality using RSEI by integrating the four indicators representing humidity, greenness, dryness and heat to uncover the dynamic impacts of land use changes on the eco-environmental quality in Wuhan from 2000 to 2018. Grounded in remote sensing data, this study attempts to figure out the evolution characteristics of land use and eco-environmental quality in rapidly urbanizing areas, identify the potential eco-environmental issues that occur within these areas and provide a decision-making reference for achieving high-quality urban development.

2 Theoretical framework

With population growth and economic development, the intensity of human activities is deepening and the scope of influence is expanding, which has profoundly changed the surrounding environment. The most important manifestation of human activities is the impact on land use and land cover (Turner et al., 1993; Zhang et al., 2011). China’s land use changes showed the characteristics of continuous expansion of construction land and reduction of farmland and forestland, especially in rapidly urbanized areas (Liu et al., 2018a). In this process, the natural landscape pattern dominated by vegetation and soil gradually replaces the urban landscape pattern dominated by reinforced concrete and cement ground. This will result in the change of the nature of the underlying surface of the land (such as surface reflectance and vegetation coverage), then lead to the change of regional temperature, humidity and precipitation, and finally, impact on regional climate (Li and Wang, 2008). In addition, the increase of man-made landscapes such as artificial structures and buildings will result in the fragmentation of natural landscapes and biological habitats, which will greatly disturb and destroy the maintenance of natural communities and resulting in a serious threat to biodiversity (Venter et al., 2016).
In terms of different land use types, forestland, as an important part of ecosystem, can absorb carbon dioxide, regulate climate and protect biodiversity. Forestland plays an important role in maintaining ecological security and its size is closely related to the quality of regional eco-environment (Manuschevich et al., 2019). However, if it is occupied by construction land, its original ecological service function will be greatly weakened (Li and Wang, 2008; Wu et al., 2019). With the development of urbanization, plenty of farmland has been converted to construction land (Liu et al., 2010), which not only disturbed the functions of the original farmland ecosystem, but also resulted in the increase of pollution emission and the emergence of heat island effect (Narducci et al., 2019). In addition, the water body can regulate and store water, regulate climate and purify the environment, which has great environmental regulation function and ecological benefits. In light of this, land use change will inevitably affect the regional eco-environmental quality. The increase of greenhouse gas emissions, the intensification of urban heat island and the decline of water quality are the most direct manifestations of this impact, which eventually leads to the degradation of ecosystem service function and the decline of eco-environmental quality (Edmondson et al., 2016).

3 Study area and data

3.1 Study area

Wuhan is located at the confluence of the Jianghan Plain and the Yangtze River (Figure 1). It is the capital city of Hubei Province, the main city in central China and one of the first riverside cities opened to the outside world. In 2007, Wuhan was formally approved as an experimental resource-saving and environmentally friendly comprehensive reform area. In 2009, the People’s Government of Hubei Province proposed to construct “ecological Hubei” to continuously improving the eco-environmental quality. Subsequently, in the 12th Five-year Plan for Economic and Social Development of Wuhan (2011-2015), the local government of Wuhan took the construction of ecological and livable city as its critical strategic objective to coordinate environmental protection and urban development. Currently, Wuhan occupies a land area of 8589.15 km2, including seven main urban areas (districts), Jiangan, Jianghan, Qiaokou, Hanyang, Wuchang, Qingshan, Hongshan, and six suburban areas (districts), Caidian, Jiangxia, Dongxihu, Hannan, Huangpi and Xinzhou. Wuhan’s urbanization rate rose from 47.4% in 1978 to 80.29% in 2018, ranking first among the six provinces in central China. The largest urbanization process in Wuhan’s history began in the 1990s (Mei et al., 2009). By the end of 2019, the resident population in Wuhan reached 11.21 million individuals and the per capita GDP was up to 145,545 yuan. Rapid urbanization has triggered a huge demand for various types of construction lands to meet the massive demand for infrastructure construction, urban space expansion and industrial layout adjustment.
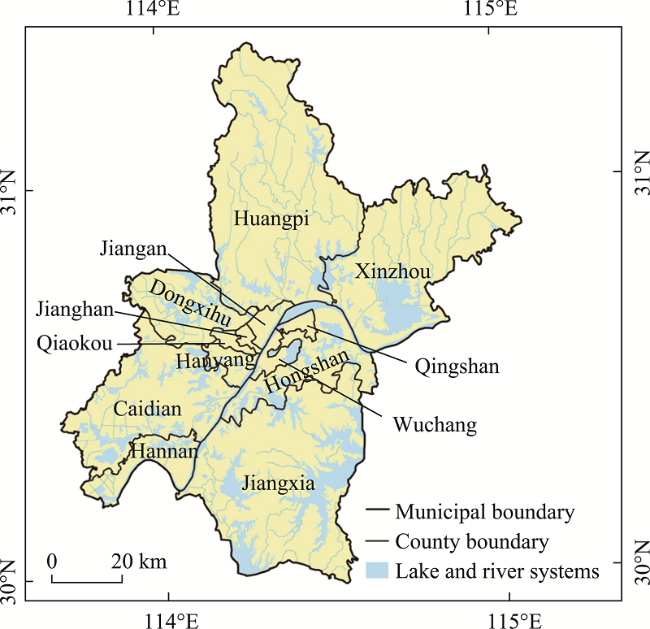
Figure 1 Location of Wuhan, Hubei province, central China

3.2 Data sources and processing

3.2.1 Data sources

Landsat remote sensing data were used to extract land use information and monitor eco-environmental quality changes in Wuhan. Landsat images in summer and early autumn are usually accompanied by clear weather and low cloud cover, which can provide high-quality remote sensing images for this research. According to this, three Landsat scenes of Wuhan in 2000, 2009 and 2018 with high imaging conditions were collected for image mosaicking. In addition, the year of 2009 is a critical time point in the process of economic development and environment conservation. 2009 is not only a year for Wuhan to practice “ecological Hubei”, but also a year for Wuhan to plan the urban ventilation corridors, which will have an impact on the eco-environmental quality. The images of path 123, row 39 and path 123, row 38 on September 13, 2000, September 6, 2009 and September 15, 2018 were the main data sources. To avoid the impact of seasonal differences on the results, the images of path 122, row 39 between June and September were selected to be stitched with those of path 123, row 39 and path 123, row 3. In addition, administrative boundary vector data derived from a 1:1,000,000 national basic geographical database of China were used to extract the boundary of Wuhan. All data sources are shown in Table 1.
Table 1 Data sources
Type Name of the data Date Path/row Data source
Remote sensing data Landsat 5 TM 2000-09-13 123/39 https://earthexplorer.usgs.gov/
United States Geological Survey (USGS)
2000-09-13 123/38
2000-06-18 122/39
2009-09-06 123/39
2009-09-06 123/38
2009-07-13 122/39
Landsat 8 OLI/TIRS 2018-09-15 123/39
2018-09-15 123/38
2018-09-08 122/39
Vector data Administrative boundary of Wuhan 2017 / http://www.webmap.cn/
National Geomatics Center of China

3.2.2 Data processing

The Landsat datasets were processed through ENVI 5.3 and ArcGIS 10.5. First, multispectral data and thermal infrared data were preprocessed through radiometric corrections, atmospheric corrections, projection conversion, mosaics and shearing. All data were projected on WGS 1984, UTM zone 50N with a 30-m spatial resolution. Second, to ensure the comparability of the multispectral data, blue band, green band, red band, near-infrared band, shortwave infrared band-1 and shortwave infrared band-2 were selected for the land use classifications. At the same time, the Normalized Difference Vegetation Index (NDVI) and texture feature information (mean, variance, contrast, and entropy) were added to the classification band to improve the classification accuracy (Zhang et al., 2012; Zhai et al., 2016). Third, based on China’s national standards listed in the published Current Land Use Classification (GB/T 21010-2017) and the land-use monitoring classification system using remote sensing established by the Chinese Academy of Sciences, the land types in Wuhan were divided into forestland, farmland, construction land (urban land, rural residential areas), water and unused land (bare land, sandy land, tidal flats). Fourth, the principles of sample selection followed those described by Li (2015) and the ratio of the training set to the validation set was 2:1. Fifth, a support vector machine (SVM) was used for the land use classification of the Landsat dataset, and the classification accuracy was evaluated using the validation set. Last, lakes with abundant aquatic plants in Wuhan were easily classified as farmland and forestland. Thus, the classification results of the SVM need to be modified and optimized by visual interpretation in the postprocessing stage.

4 Methods

4.1 Land use change analysis

4.1.1 Land use structure

The land use structure characterizes the proportional relationship or composition of various lands within a certain area. The following indicator was used to reflect the speed of structural changes in various land types:
${{K}_{1}}=\frac{{{Q}_{m}}-{{Q}_{n}}}{{{Q}_{n}}}\times \frac{1}{m-n}\times 100%$
where K1 refers to the annual change rate of a given land use type and Qm and Qn represent the area of that land use type (km2) in years m and n, respectively.

4.1.2 Land use degree

The land use degree comprehensive index (LUDCI) is a method in which land use types are divided into several levels and values are assigned to different land types according to the impacts of human activities on the land. The LUDCI can reflect both the natural attributes of land and the interactions between human activities and the environment. The greater the impacts of human activities on land are, the higher the LUDCI value is. The LUDCI can be calculated as follows:
$LUDCI=100\times \sum\limits_{i=1}^{k}{{{A}_{i}}\times {{C}_{i}}}$
where LUDCI ranges from 100 to 400; Ai represents the land use index of grade i (when i corresponds to unused land, water and forestland, farmland, and construction land, Ai is assigned as 1, 2, 3 and 4, respectively); and Ci refers to the percentage of area of grade i land use.
The change in the land use degree comprehensive index (ΔLUDCI) can measure the degree of interaction among various land types in a certain period (Formula (3)). When ΔLUDCI is less than 0, it indicates that land use in the corresponding area is in the recession stage; otherwise, it is in the development stage. The ΔLUDCI value can be calculated as follows:
$\Delta LUDCI=LUDC{{I}_{m}}-LUDC{{I}_{n}}=100\times \left[ \left( \sum\limits_{i=1}^{k}{{{A}_{i}}\times {{C}_{im}}} \right)-\left( \sum\limits_{i=1}^{k}{{{A}_{i}}\times {{C}_{in}}} \right) \right]$
where LUDCIm and LUDCIn represent the land use degree comprehensive index value in years m and n, respectively.

4.1.3 Land use spatial pattern

The land use transfer matrix can synthetically reflect the structure and direction of a regional land use change. Land use transition matrices in 2000-2009 and 2009-2018 were obtained by the superposition analysis function of ArcGIS 10.5.

4.2 Eco-environmental quality assessment

The extant literature has shown that results obtained using the RSEI are comparable to those obtained with the ecological index (EI), which was proposed by the Ministry of Environmental Protection of China to evaluate regional eco-environmental quality (Wang et al., 2016). The RSEI was constructed by integrating four indicators using principal component analysis, avoiding the subjectivity of the weight of each indicator (Formula (4)). The humidity (WET), normalized difference vegetation index (NDVI), normalized difference soil index (NDSI), and land surface temperature (LST) were applied to represent the humidity, greenness, dryness, and heat, respectively.
$RSEI=f(WET,NDVI,NDSI,LST)$

4.2.1 Component indicators of the remote sensing-based ecological index

(1) Humidity (WET). The humidity plays a crucial role in the process of water exchange between the land surface and atmosphere, and it is an essential indicator used to measure land degradation. WET, as calculated by a tasseled cap transformation, can properly reflect the humidity conditions of vegetation and soil; thus, this study selected WET as one of the indicators of the RSEI. The calculation methods used for the TM data and OLI/TIRS data are shown in Formula (5) (Crist, 1985) and Formula (6) (Baig et al., 2014), respectively.
$\begin{align} & WET=0.0315{{\rho }_{Blue}}+0.2021{{\rho }_{Green}}+0.3102{{\rho }_{Red}}+0.1594{{\rho }_{NIR}} \\ & \text{ }-0.6806{{\rho }_{SWIR1}}-0.6109{{\rho }_{SWIR2}} \end{align}$
$\begin{align} & WET=0.1511{{\rho }_{Blue}}+0.1973{{\rho }_{Green}}+0.3283{{\rho }_{Red}}+0.3407{{\rho }_{NIR}} \\ & \text{ }-0.7117{{\rho }_{SWIR1}}-0.4559{{\rho }_{SWIR2}} \end{align}$
where ρBlue, ρGreen, ρRed, ρNIR, ρSWIR1, and ρSWIR2 are the reflectance values of the blue band, green band, red band, near-infrared band, shortwave infrared band-1, and shortwave infrared band-2, respectively.
(2) Greenness (NDVI). The NDVI value reflects the growth of plants and the vegetation coverage of the corresponding area; this value is closely related to the crop yield and leaf area and is widely used in assessments of vegetation conditions and eco-environmental quality.
$NDVI=\frac{\rho NIR-\rho Red}{\rho NIR+\rho Red}$
(3) Dryness (NDSI). The continuous expansion of construction land and bare soil will lead to the deterioration of regional eco-environments. The NDSI was selected to represent the dryness of land surfaces, and this index is calculated by integrating the soil index (SI) and the normalized difference building index (NDBI) (Rikimaru et al., 2002; Zha et al., 2003).
$SI=\frac{(\rho SWIR1+\rho Red)-(\rho NIR+\rho Blue)}{(\rho SWIR1+\rho Red)+(\rho NIR+\rho Blue)}$
$NDBI=\frac{\rho SWIR-\rho NIR}{\rho SWIR1+\rho NIR}$
$NDSI=\frac{SI+NDBI}{2}$
(4) Heat (LST). Wuhan, which has high temperatures, is one of China’s “four furnaces”, meaning that the temperature changes can be directly perceived by people. The LST is a common indicator used to measure the regional thermal degree and eco-environmental quality. Using thermal infrared Landsat data, this study adopted an atmospheric correction method to retrieve the surface temperature in Wuhan. By combining Planck’s radiation formula, the LST can be calculated as follows:
${{T}_{S}}=\frac{{{K}_{3}}}{\ln \left( \frac{{{K}_{2}}}{B({{T}_{S}})+1} \right)}$
where TS refers to LST and B(Ts) refers to the black-body radiance. For Landsat TM data, K2=607.76 W/(m2·μm·sr) and K3=1260.56 K. For Landsat OLI/TIRS data, K2=774.89 W/(m2·μm·sr) and K3=1321.08 K. B(TS), the black-body radiance, can be calculated as follows:
$B({{T}_{S}})=\frac{{{L}_{\lambda }}-{{L}_{u}}-\tau \times (1-\varepsilon )\times {{L}_{d}}}{\tau \times \varepsilon }$
where Lλ, Lu and Ld refer to the radiance of the thermal infrared band, the upward atmospheric radiance and the downward atmospheric radiance, respectively; τ represents the infrared atmosphere transmittance; and ε refers to the land surface emissivity of different land surfaces. The land surface emissivity can be computed as follows (Qin et al., 2004):
${{\varepsilon }_{water}}=0.995$
${{\varepsilon }_{surface}}=0.9625+0.0614{{P}_{v}}-0.0461{{P}_{v}}^{_{^{2}}}$
${{\varepsilon }_{building}}=0.9589+0.086{{P}_{v}}-0.0671{{P}_{v}}^{_{^{2}}}$
where Pv is the vegetation fractional coverage. Pv can be calculated using Formula (16) below:
${{P}_{v}}=\frac{NDVI-NDV{{I}_{soil}}}{NDV{{I}_{veg}}-NDV{{I}_{soil}}}$
where NDVIsoil refers to the NDVI value of the vegetation-free pixels in the study area and NDVIveg is the value of the vegetation-covered pixels in the study area. According to the empirical values obtained from the existing literature, NDVIsoil is equal to 0.7, and NDVIveg is equal to 1 (Qin et al., 2004). When the NDVI value of a pixel is greater than 0.7, Pv is equal to 1, and when the NDVI value of a pixel is less than 0.05, Pv is equal to 0.

4.2.2 Assessment of the remote sensing-based ecological index

Because the units and ranges of the four indicators are different, the indicators need to be normalized within the range of [01] before the principal component analysis (PCA) can be performed (Formula (17)). Moreover, when an area has a large body of water, the weight of the WET indicator may be affected, and the results of the RSEI in the water area may not conform to the actual situation (Li, 2015). Considering that Wuhan has a large water area, it is necessary to mask the water before normalizing the four indicators. The vector data of the water mask were extracted from the land classification results:
$NI=\frac{index-inde{{x}_{\min }}}{inde{{x}_{\max }}-inde{{x}_{\min }}}$
where NI and index refer to the normalized and the original value of each indicator, respectively, and indexmax and indexmin are the maximum and minimum value of each indicator, respectively. Based on the normalization of the four indicators, the initial RSEI value (RSEI0) can be obtained by the PCA method (Formula (18)), and then the RSEI value can be computed by normalizing RSEI0 (Formula (17)). The RSEI ranges from 0 to 1. The higher the RSEI is, the better the eco-environmental quality is.
$RSE{{I}_{0}}=1-PCA[f(WET,\text{ }NDVI,\text{ }NDSI,\text{ }LST)]$

5 Results and analyses

5.1 Temporal and spatial land use changes

The overall land use classification accuracies in 2000, 2009 and 2018 were 94.31%, 93.39% and 95.50%, respectively, and their Kappa coefficients were 0.9376, 0.9224 and 0.9429, respectively; these accuracies meet the needs of land use change monitoring research. Figure 2 shows the land use status of Wuhan in 2000, 2009 and 2018.
Figure 2 Land use status of Wuhan in 2000, 2009 and 2018

5.1.1 Land use structure

As shown in Figure 2 and Table 2, the land use types in Wuhan mainly include cultivated land and construction land, followed by water and forestland. The growth rate of construction land was the greatest among all land use types, showing a rapid increasing trend with an average annual growth rate of 5.20% in 18 years. Although the growth rate of construction land slowed down in Wuhan, the area of construction land continued to expand rapidly in 2009-2018 and reached to 1602.83 km2 in 2018. However, the areas of forestland, farmland, water and unused land showed a general downward trend in 18 years, indicating that there was fierce competition among construction land and other land types in Wuhan. Specifically, forestland increased by 2.00% per year in 2000-2009 and then decreased by 2.35% per year in 2009-2018, with a total decrease of 6.91% in 18 years. The total amount of farmland in Wuhan decreased and displayed a “V-shaped” change. From 2000 to 2009, the area of farmland in Wuhan decreased at an annual average rate of 0.7%, while from 2009 to 2018, increased at an annual average rate of 0.31%. The area of water in Wuhan shrank from 1378.62 km2 in 2000 to 1148.62 km2 in 2018, with a total decrease rate of 16.68%, and the unused land also showed a rapid downward trend.
Table 2 Changes in land use areas in Wuhan in 2000-2018
Land use Area (km2) K1 (%)
2000 2009 2018 2000-2009 2009-2018 2000-2018
Forestland 1113.17 1313.52 1036.21 2.00 -2.35 -0.38
Farmland 4935.72 4625.39 4755.36 -0.70 0.31 -0.20
Construction land 827.54 1258.11 1602.83 5.78 3.04 5.20
Water 1378.62 1247.17 1148.62 -1.06 -0.88 -0.93
Unused land 314.10 124.96 26.12 -6.69 -8.79 -5.09

5.1.2 Land use degree

In Wuhan, the LUDCI values in 2000, 2009 and 2018 were 273.25, 281.88 and 292.60, respectively, showing an overall upward trend. In 2000-2018, construction land in Wuhan expanded rapidly, but the LUDCI values were not very high. This is because the farmland and forestland areas in the suburban areas and the water area in Wuhan accounted for a large part of the total land area. The ΔLUDCI values in 2000-2018 were positive, and the ΔLUDCI value (10.72) in 2009-2018 was higher than the ΔLUDCI value (8.64) in 2000-2009. The change in land use degree of Wuhan is closely related to the expansion of construction land and the decline of forestland and water. These results indicated that land use in Wuhan was in the rapid development stage in 18 years and that the impacts of socioeconomic activities on land use were greater in 2009-2018 than in 2000-2009. Previous studies have shown that the promotion of urbanization in Wuhan relies on the accelerated expansion of construction land (Dai et al., 2016). This kind of urban development model resulted in the rapid expansion of the impervious surfaces and the occupation of urban ecological land in Wuhan, which exacerbated the conflict between land use and eco-environmental conservation.

5.1.3 Spatial evolution of land use

As shown in Table 3, some of the land use transitions in 2000-2009 were significant, including the conversion of farmland to construction land (589.01 km2), the conversion of forestland to farmland (393.35 km2), the conversion of farmland to forestland (598.00 km2), and the conversion of water and unused land to farmland (202.80 km2 and 198.70 km2, respectively).
Table 3 Land use transition matrix of Wuhan in 2000-2009
Land use (km2) Forestland Farmland Construction land Water Unused land Total in 2000
Forestland 653.92 393.35 47.92 10.98 6.99 1113.17
Farmland 598.00 3562.02 589.01 121.80 64.89 4935.72
Construction land 20.96 268.53 501.12 29.95 6.99 827.54
Water 25.97 202.79 79.92 1068.93 0.99 1378.62
Unused land 15.05 198.70 40.14 15.05 45.16 314.10
Total in 2009 1313.91 4625.40 1258.11 1246.71 125.02 8569.15
As shown in Table 4, the land use transitions in 2009-2018 mainly included the conversion of farmland to construction land (712.20 km2), the conversion of forestland to farmland (574.28 km2), the conversion of farmland to forestland (332.37 km2), and the conversion of water to farmland (171.42 km2). Owing to the limited reserves of land resources, a large amount of unused land was converted to farmland in Wuhan, and the unused land area plummeted to 84.73 km2 during this period. From 2000 to 2018, the mutual conversions between farmland and forestland in Wuhan were intense, indicating that drastic competition among land use types existed not only between construction land and other land types but also between farmland and ecological land (forestland and water areas).
Table 4 Land use transition matrix of Wuhan in 2009-2018
Land use (km2) Forestland Farmland Construction land Water Unused land Total in 2009
Forestland 670.82 574.28 51.99 12.47 3.95 1313.52
Farmland 332.37 3460.53 712.20 108.20 12.09 4625.39
Construction land 11.18 464.71 752.67 27.69 1.85 1258.11
Water 5.29 171.42 68.49 996.94 5.03 1247.17
Unused land 16.11 84.73 17.67 3.29 3.16 124.96
Total in 2018 1035.78 4755.67 1603.03 1148.58 26.09 8569.15

5.2 Dynamic changes of eco-environmental quality

5.2.1 Status of eco-environmental quality

The results of the PCA of WET, NDVI, NDSI, and LST are exhibited in Table 5.
Table 5 Contributions of the four indicators and the remote sensing-based ecological index in 2000-2018
Year PC1 PC2 PC3 PC4 RSEI
2000 WET 0.390 0.548 -0.522 0.524 0.5658
NDVI 0.479 -0.650 0.224 0.546
NDSI -0.686 0.142 0.291 0.652
LST -0.384 -0.507 -0.770 0.050
Eigenvalue 0.056 0.010 0.007 0.001
Percent eigenvalue (%) 75.68% 13.51% 9.46% 1.35%
2009 WET 0.357 0.625 -0.175 0.672 0.6023
NDVI 0.560 -0.736 -0.157 0.347
NDSI -0.634 -0.247 0.333 0.653
LST -0.395 -0.083 -0.913 0.050
Eigenvalue 0.059 0.014 0.006 0.001
Percent eigenvalue (%) 73.75% 17.50% 7.50% 1.25%
2018 WET 0.313 0.545 -0.515 0.582 0.6036
NDVI 0.643 -0.679 0.066 0.348
NDSI -0.552 -0.109 0.379 0.735
LST -0.428 -0.479 -0.766 0.001
Eigenvalue 0.043 0.008 0.006 0.000
Percent eigenvalue (%) 75.44% 14.04% 10.53% 0.00%
As shown in Table 5, the contribution rate of PC1 in 2000, 2009 and 2018 is more than 70%, which indicates that PC1 can represent most of the characteristic information of the four indicators. Compared with the results of PC2-PC4, the WET, NDVI, NDSI and LST values have certain contributions to PC1, and the contributions of these four indicators to PC1 are relatively stable. In PC1, WET and NDVI are positive indicators, meaning that they have positive effects on the eco-environment, while NDSI and LST are negative indexes, indicating that they have negative effects on the eco-environment; these results are in line with the actual situation of the eco-environment. In addition, the four indicators had different effects on PC2, PC3 and PC4 in 2000, 2009 and 2018; thus, PC1 was most suitable for the analysis of the RSEI.
From 2000 to 2018, the RSEI value of Wuhan increased from 0.5658 in 2000 to 0.6036 in 2018, showing that the quality of the eco-environment in Wuhan had improved. The growth of the RSEI value in 2009-2018 was slower than that in 2000-2009. According to the contributions of the four indicators to PC1, the NDVI and NDSI values had greater effects on the RSEI than the other indicators, indicating that vegetation, impervious surfaces and bare surfaces were crucial factors affecting the eco-environment of Wuhan. The contributions of WET and LST were relatively small, but their influences cannot be ignored.
To characterize the eco-environmental status of Wuhan more clearly, this study divided the RSEI into five grades (Table 6) and counted the area proportion of each eco-environmental quality grade in 2000, 2009 and 2018.
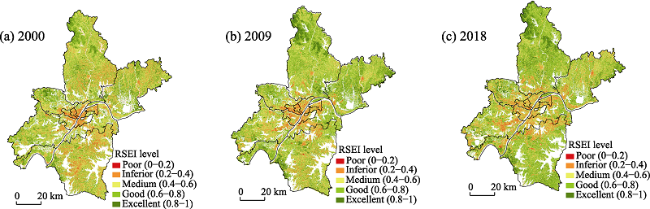
Table 6 Levels of the remote sensing-based ecological index in Wuhan in 2000, 2009 and 2018 (%)
RSEI Level 2000 2009 2018
Poor (0.0-0.2) 0.75 0.66 0.69
Inferior (0.2-0.4) 16.24 11.09 13.53
Medium (0.4-0.6) 38.23 32.94 28.82
Good (0.6-0.8) 38.16 46.62 47.30
Excellent (0.8-1.0) 6.63 8.69 9.66
According to Table 6, the proportions of poor, inferior and medium RSEI levels in the total area of Wuhan decreased from 2000 to 2009, and the proportions of good and excellent RSEI levels grew by 8.46% and 2.06%, respectively, over the same period. In 2018, the proportions of poor, inferior and medium RSEI levels in the total area of Wuhan accounted for 0.69%, 15.53%, and 28.82% of the land area, respectively, all of which were improved compared with the 2009 values. The percentages of good and excellent RSEI levels increased from 2009 to 2018. Compared with 2000-2009, the growth of areas with good and excellent eco-environmental quality in 2009-2018 was significantly slower; this result was consistent with the rising trend of the RSEI (Table 5).
As shown in Figure 3, the areas with medium and good eco-environmental quality in Wuhan were the most widely distributed, and these areas were mainly concentrated in forestland and farmland. The areas with excellent eco-environmental quality were mostly forestland and were mainly located in the suburbs of Huangpi, Xinzhou, Hannan and Jiangxia. The areas with poor and inferior eco-environmental quality were principally construction land and unused land, and these land use types were principally located in the main urban areas. In 2000-2018, the areas with poor and inferior eco-environmental quality expanded in blocks to their surrounding areas (see the orange and red parts in Figure 3), indicating that the continuous expansion of built-up areas in Wuhan has led to the degradation of the surrounding eco-environmental quality.
Figure 3 Spatial distributions of the remote sensing-based ecological index levels in Wuhan in 2000-2018

5.2.2 Changes in eco-environmental quality

For the purpose of comparing changes in the eco-environmental quality among different periods and exploring the driving forces behind land use changes, this study analyzed the changes in the RSEI values in Wuhan from 2000 to 2018 based on the RSEI levels.
Table 7 shows the percentage changes in the RSEI values in Wuhan.
Table 7 Change detection of the remote sensing-based ecological index levels in Wuhan in 2000-2018
Category Differences 2000-2009 2009-2018 2000-2018
Ratio Subtotal ratio Ratio Subtotal ratio Ratio Subtotal ratio
Deteriorated -4 0.01% 17.49% 0.02% 24.03% 0.02% 22.06%
-3 0.31% 0.43% 0.60%
-2 2.73% 4.47% 4.76%
-1 14.45% 19.12% 16.68%
Unchanged 0 48.07% 48.07% 49.70% 49.70% 39.85% 39.85%
Improved 1 30.66% 34.44% 22.89% 26.27% 30.02% 38.10%
2 3.58% 3.14% 7.48%
3 0.20% 0.24% 0.59%
4 0.00% 0.01% 0.01%
Generally, there are two opposite trends, improvement and deterioration, in regional eco-environmental changes. The interaction between these two trends in a certain region will lead to an increase or decrease in the overall eco-environmental quality (Zhang et al., 2011). In 2000-2018, observing the change trend of the RSEI in Wuhan, the overall eco-environment showed a positive trend. However, as shown in Table 7, the scale of the improved eco-environment areas (38.10%) was greater than that of the deteriorated areas (22.06%) in 2000-2018; this explains the improvement of the overall eco-environmental quality of Wuhan in this period.
Table 7 shows that in 2000-2009, the areas experiencing eco-environmental degradation in Wuhan accounted for 17.49% (deteriorated), the proportion of unchanged eco-environments was 48.07% (unchanged), and the area experiencing eco-environmental improvement in Wuhan accounted for 34.44% (improved). In 2009-2018, the areas experiencing eco-environment degradation in Wuhan accounted for 24.03% (deteriorated), the proportion of areas with unchanged eco-environmental quality was 49.70% (unchanged) and the areas experiencing eco-environmental improvement in Wuhan accounted for 26.27% (improved).

5.3 Eco-environmental quality responses to land use changes

5.3.1 Response of eco-environmental quality

The RSEI includes four indicators that are closely related to the land cover: the WET, NDVI, NDSI, and LST. These indicators can comprehensively reflect changes in the eco-environment caused by land use changes within a certain period. As shown in Table 5, the four indicators have different effects on the eco-environment, and these effects are consistent with existing research results (Wang and Pan, 2014; Ariken et al., 2020). The WET and NDVI are positive indicators, while the NDSI and LST are negative indicators. Table 5 shows that the impact of NDVI is greater than that of WET in 2000, 2009 and 2018. Previous studies have revealed that increased vegetation coverage can greatly improve the eco-environments of urban areas, while for ecological conservation areas, the impact of wetness is greater than that of greenness (Wang et al., 2016; Zhang et al., 2018). This shows that the contribution of indicators in different regions to RSEI is different. Moreover, the RSEI is affected not only by the positive or negative directions of these indicators but also by their contribution degrees in different periods. In general, the impacts of the NDVI and NDSI on the RSEI in Wuhan are obviously higher than the impacts of the WET and LST, indicating that vegetation and impervious surfaces, including bare land and construction land, are important influencing factors for urban ecosystems. The contribution degree of each indicator to the RSEI and its dynamic changes can reflect the importance of different influencing factors in different regions and different periods, providing guidance for local governments to formulate more effective and targeted land use policies to conserve the local eco-environments.
Differences in the eco-environments exist under different land use types, which echoes with the results of Zhang et al. (2018). The RSEI values of different land-use types in 2018 were calculated. The results showed that the eco-environmental quality values of forestland (0.7490) and farmland (0.6445) were classed into good, while the eco-environmental quality values construction land (0.3924) and unused land (0.3744) were classed into inferior. In order to clarify the relationship between land use types and the RSEI more clearly, this paper established the regression equation between different land use types (the proportion of each land use type in each district) and the RSEI (the RSEI in each district). As shown in Table 8, Model 1 is the results of Ordinary Least Square (OLS) and adjusted R2 is 0.955. However, the Variance Inflation Factor (VIF) of unused land was 10.498, which implied a multicollinearity problem in Model 1. In order to solve this problem, we used the ridge regression method. Ridge regression analysis is a nonlinear partial estimation method that is used to analyze any data with multicollinearity. It can not only eliminate the multicollinearity between variables, but also retain the information of each variable to a greater extent, making the model more practical and reliable (Yang, 2004; Wang, 2015). Therefore, to solve the multicollinearity of variables, we further used ridge regression to illustrate the relationship between land use types and the RSEI and compared it with the OLS results.
Table 8 Results of ordinary least square and ridge regression
Model 1 (k=0, OLS) Model 2 (k=0.25)
Estimate SE Estimate SE
Forestland 0.197** 0.068 0.211* 0.083
Farmland 0.297*** 0.045 0.215*** 0.055
Constructionland -0.120** 0.040 -0.128** 0.049
Unusedland -1.282*** 0.268 -0.752* 0.328
_cons 0.436*** 0.034 0.467*** 0.041
R2 0.960 0.940
Adjusted R2 0.955 0.933
MSE 0.020 0.024

Note: ***p<0.001; **p<0.01; *p<0.05; When k=0, ridge regression is the OLS method.

When k≥0.25, the ridge estimation of each regression coefficient was basically stable, and the mean square error (MSE) did not increase much. Therefore, taking k=0.25, this paper established the ridge regression model between eco-environmental quality and different land use types in Wuhan. The results showed that adjusted R Square was 0.933, indicating that the ridge regression equation had high goodness-of-fit. It can be seen from Table 8 that forestland (0.211) and farmland (0.215) have a positive impact on the RSEI, and construction land (-0.128) and unused land (-0.752) have a negative impact on RSEI. With the increase of forestland and farmland, the LST and NDSI values of these areas will decrease, while the NDVI and WET values will increase, and finally, the eco-environmental quality of these areas will improve. The increase of construction land and unused land will result in increased NDSI and LST values and decreased NDVI and WET values, and eventually, the eco-environmental quality will deteriorate.

5.3.2 Spatial heterogeneity of eco-environmental quality response

Due to the complexity of land use change in rapidly urbanized areas, the eco-environmental quality of Wuhan showed significant spatial differences among different areas, especially between the main urban areas and the suburban areas. This kind of spatial heterogeneity of the eco-environmental quality is mainly associated with the mutual transformation of different land use types, that is, changes in the land use mode, layout and scale related to human-related land use behaviors. As the main city in central China, Wuhan undertakes the tasks of economic development, farmland protection and eco-environment conservation. The main urban areas in this city are rapidly urbanizing areas, while the suburban areas are rich in forest resources, wetland resources and biological resources, leading to diverse changes in the RSEI values and composition in the main urban areas and the suburban areas.
As shown in Figure 3, the eco-environmental quality of the suburban areas is significantly higher than that of the main urban areas. From 2000 to 2018, the eco-environmental quality of the main urban areas was improved on the whole, especially the RSEI values of Wuchang and Jiangan increased by 0.0824 and 0.0742, respectively. This improvement of eco-environmental quality indicated that the ecological conditions of the main urban areas were constantly improved through the construction of greenways, parks and other green space. The RSEI values of Dongxihu, Hannan and Caidian in the suburban areas decreased by 0.0130, 0.0124 and 0.0319, respectively. Comparing the spatial distribution of land use types (Figure 2) with the spatial distribution of the RSEI values (Figure 3), it can be found that the deterioration areas of eco-environment in Dongxihu, Hannan and Caidian (see the newly added orange and red parts in Figure 3) were almost new construction land in 2000-2018. This result suggested that the expansion of construction land in rapidly urbanizing areas caused impervious surfaces to continue to expand and lead to the deterioration of the eco-environment, which is consistent with the results of (Wang and Xu, 2018). The RSEI values of Jiangxia and Huangpi increased by 0.0926 and 0.0768, respectively. A sharp decline in unused land was observed in Jiangxia and Huangpi, and this decline brought about the improvement of the eco-environmental quality (Figure 2). Increases in the areas of forestland and farmland as well as the decrease of unused land are a major factor associated with the improvement of the eco-environment, while the continuous expansion of construction land is a crucial reason for the deterioration of the eco-environment in Wuhan. Therefore, adjusting the distribution of different land use types among different areas is of great significance for realizing green development and maintaining a healthy urban eco-environment.

6 Conclusions and discussion

6.1 Conclusions

Based on Landsat series of remote sensing images obtained in 2000, 2009 and 2018, this study used the support vector machine classification method to extract land use information and then analyzed the land use evolution in Wuhan. On this basis, the RSEI, composed of four indicators, was employed to explore the eco-environmental feedbacks to land use changes in Wuhan from 2000 to 2018. This evaluation method, which integrated multiple elements, including humidity, greenness, dryness and heat, can comprehensively reflect changes in eco-environmental quality. This paper attempts to provide a reference for countries and regions such as China that are experiencing drastic land use changes caused by urbanization and assist decision makers in coordinating the relationship between economic development and eco-environmental conservation to achieve high-quality development.
(1) From 2000 to 2018, the structure, degree and spatial layout of land use in Wuhan have changed drastically with rapid urbanization. The growth rate of construction land is the greatest among all land use types, while the areas of forestland, farmland, water and unused land show a general downward trend. The values of land use degree are 273.25, 281.88 and 292.60 in 2000, 2009 and 2018, respectively. The land use transitions from 2000 to 2018 mainly include the conversion of farmland to construction land and conversion between farmland and forestland.
(2) The RSEI value of Wuhan increased from 0.5658 in 2000 to 0.6023 in 2009, and then to 0.6036 in 2018, indicating that the overall quality of eco-environment in Wuhan continues to improve. The scale of ecological environment improvement area is larger than that of ecological environment deterioration area, which leads to the increase of RSEI value in Wuhan. The scale of the improved eco-environment areas is greater than that of the deteriorated areas in Wuhan. The direction and magnitude of the impacts of the four indicators on the eco-environmental quality are different. The WET and NDVI have positive effects on the eco-environmental quality, while the NDSI and LST have negative effects on the eco-environmental quality.
(3) Different land use types have different effects on eco-environmental quality. The increase of farmland and forestland is an important factor for the improvement of eco-environmental quality in Wuhan, while the expansion of construction land is an important reason for the deterioration of eco-environmental quality. In addition, the eco-environmental quality of Wuhan shows significant spatial differences among different areas, especially between the main urban areas and the suburban areas. The inconsistent land use structure within the regions is the fundamental cause of the differences of the eco-environmental quality.

6.2 Discussion

Currently, the construction land in Wuhan is expanding continuously and occupying the adjacent ecological land in the form of blocks, which conflicts with the goals of green development and high-quality development. Therefore, this paper puts forward the following suggestions are put forward to coordinate the development of land use and eco-environment in Wuhan, and attempts to provide a reference for rapidly urbanizing areas in China. First, it is necessary to delimit the dynamic urban growth boundary. The construction land in Wuhan mainly expands to Xinzhou, Caidian and Dongxihu, which resulted in the eco-environment deterioration in those areas. Thus, considering the population size, permanent basic farmland, ecological protection area and urban development potential, the government should reasonably allocate the annual construction land index and dynamically manage the urban growth boundary. Second, with the help of remote sensing technology, the key factors affecting the eco-environments in different areas can be identified to provide scientific evidence for policy making, effectively adjust the regional land use structure and urban development direction, and finally improve the eco-environmental quality. For instance, combined with the existing ecological red lines, the RSEI can be considered and applied to distinguish whether regional vegetation cover should be increased and to divide a certain area into important ecological protection areas in future planning according to the subindicator values. Third, this study demonstrates that an increase in vegetation cover and a decrease in impervious surfaces bring about increases in the RSEI value and regional eco-environmental quality. In the future, the emphasis on natural elements with important ecological functions and their spatial combinations should be continuously strengthened.
This study analyzed how the eco-environmental quality responses to land use changes in rapidly urban areas, trying to provide a theoretical basis and decision-making reference for the optimization of land use pattern and the improvement of eco-environmental quality. However, there are still some issues to be further studied. The results of land use change monitoring and the RSEI are closely related to the time at which the remote sensing images were acquired. Although the data selected in this study were collected at similar time and with similar vegetation cover conditions, differences are still unavoidable due to crop rotation and other reasons. Additionally, the RSEI does not involve water areas, but some studies have indicated that water areas have a positive feedback effect on the regional eco-environmental quality. Thus, evaluation factors related to water areas could be included in the remote sensing evaluation model of eco-environmental quality used in future research.
[1]
Ariken M, Zhang F, Liu K et al., 2020. Coupling coordination analysis of urbanization and eco-environment in Yanqi Basin based on multi-source remote sensing data. Ecological Indicators, 114: 106331.

DOI

[2]
Baig M H A, Zhang L F, Shuai T et al., 2014. Derivation of a tasselled cap transformation based on Landsat 8 at-satellite reflectance. Remote Sensing Letters, 5(5): 423-431.

DOI

[3]
Bryan B A, Ye Y Q, Zhang J E et al., 2018. Land-use change impacts on ecosystem services value: Incorporating the scarcity effects of supply and demand dynamics. Ecosystem Services, 32: 144-157.

DOI

[4]
Crist E P, 1985. A TM tasseled cap equivalent transformation for reflectance factor data. Remote Sensing of Environment, 17(3): 301-306.

DOI

[5]
Cui E Q, Ren L J, Sun H Y, 2015. Evaluation of variations and affecting factors of eco-environmental quality during urbanization. Environmental Science and Pollution Research, 22(5): 3958-3968.

DOI

[6]
Dai D Y, Rao Y X, Liu D F et al., 2016. Study on spatiotemporal evolution of urban expansion: A case study of Wuhan during 1989-2015. Resources and Environment in the Yangtze Basin, 25(10): 1545-1554. (in Chinese)

[7]
Daunt A B P, Silva T S F, 2019. Beyond the park and city dichotomy: Land use and land cover change in the northern coast of São Paulo (Brazil). Landscape and Urban Planning, 189: 352-361.

DOI

[8]
Edmondson J L, Stott I, Davies Z G et al., 2016. Soil surface temperatures reveal moderation of the urban heat island effect by trees and shrubs. Scientific Reports, 6: 33708.

DOI PMID

[9]
Fang C L, Liu H M, Li G D, 2016. International progress and evaluation on interactive coupling effects between urbanization and the eco-environment. Journal of Geographical Sciences, 26(8): 1081-1116.

DOI

[10]
Gałecka-Drozda A, Raszeja E, Szczepańska M et al., 2019. Land cover changes in natura 2000 areas located in suburban zones: Planning problems in the context of environmental protection. Polish Journal of Environmental Studies, 28(2): 587-595.

DOI

[11]
Grimm N B, Faeth S H, Golubiewski N E et al., 2008. Global change and the ecology of cities. Science, 319(5864): 756-760.

DOI PMID

[12]
Guo B B, Fang Y L, Jin X B, 2020. Monitoring the effects of land consolidation on the ecological environmental quality based on remote sensing: A case study of Chaohu Lake Basin, China. Land Use Policy, 95: 104569.

DOI

[13]
Hauser L T, Vu G N, Nguyen B A et al., 2017. Uncovering the spatio-temporal dynamics of land cover change and fragmentation of mangroves in the Ca Mau peninsula, Vietnam using multi-temporal SPOT satellite imagery (2004-2013). Applied Geography 86: 197-207.

DOI

[14]
Jin G, Chen K, Wang P et al., 2019. Trade-offs in land-use competition and sustainable land development in the North China Plain. Technological Forecasting and Social Change, 141: 36-46.

DOI

[15]
Jin G, Shi X, He D W et al., 2020. Designing a spatial pattern to rebalance the orientation of development and protection in Wuhan. Journal of Geographical Sciences, 30(4): 569-582.

DOI

[16]
Kuang W H, 2020. National urban land-use/cover change since the beginning of the 21st century and its policy implications in China. Land Use Policy, 97: 104747.

DOI

[17]
Lang Y Q, Song W, 2019. Quantifying and mapping the responses of selected ecosystem services to projected land use changes. Ecological Indicators, 102: 186-198.

DOI

[18]
Li B J, Wang W M, 2008. Coupling relatlonship between regional land use and eco-environment. Arid Land Geography, 31(1): 142-148. (in Chinese)

[19]
Li Y, 2015. Study on land use change and its effects on eco-environment in CZT Core Region[D]. Changsha: Hunan Agricultural University. (in Chinese)

[20]
Lichtenberg E, Ding C R, 2008. Assessing farmland protection policy in China. Land Use Policy, 25(1): 59-68.

DOI

[21]
Liu J Y, Ning J, Kuang W H et al., 2018a. Spatio-temporal patterns and characteristics of land-use change in China during 2010-2015. Acta Geographica Sinica, 73(5): 789-802. (in Chinese)

[22]
Liu J Y, Zhang Z X, Xu X L et al., 2010. Spatial patterns and driving forces of land use change in China during the early 21st century. Journal of Geographical Sciences, 20(4): 483-494.

DOI

[23]
Liu N N, Liu C Z, Xia Y F et al., 2018b. Examining the coordination between urbanization and eco-environment using coupling and spatial analyses: A case study in China. Ecological Indicators, 93: 1163-1175.

DOI

[24]
Locke D H, King K L, Svendsen E S et al., 2014. Urban environmental stewardship and changes in vegetative cover and building footprint in New York City neighborhoods (2000-2010). Journal of Environmental Studies and Sciences, 4(3): 250-262.

[25]
Manuschevich D, Sarricolea P, Galleguillos M, 2019. Integrating socio-ecological dynamics into land use policy outcomes: A spatial scenario approach for native forest conservation in south-central Chile. Land Use Policy, 84: 31-42.

DOI

[26]
Mei L, Gong S S, Yan J, 2009. The evolutional characters of urban landscape system in the course of urbanization in Wuhan. Modern Urban Research, 24(7): 39-46. (in Chinese)

[27]
Narducci J, Quintas-Soriano C, Castro A et al., 2019. Implications of urban growth and farmland loss for ecosystem services in the western United States. Land Use Policy, 86: 1-11.

DOI

[28]
Peng J, Tian L, Liu Y X et al., 2017. Ecosystem services response to urbanization in metropolitan areas: Thresholds identification. Science of the Total Environment, 607/608: 706-714.

DOI

[29]
Pickett S T, Cadenasso M L, Grove J M et al., 2011. Urban ecological systems: Scientific foundations and a decade of progress. Journal of Environmental Management, 92(3): 331-362.

DOI PMID

[30]
Qin Z H, Li W J, Xu B et al., 2004. The estimation of land surface emissivity for Landsat TM6. Remote Sensing for Land & Resources, 16(3): 28-32. (in Chinese)

[31]
Rikimaru A, Roy P S, Miyatake S, 2002. Tropical forest cover density mapping. Tropical Ecology, 43(1): 39-47.

[32]
Salhi A, Benabdelouahab S, Bouayad E O et al., 2021. Impacts and social implications of landuse-environment conflicts in a typical Mediterranean watershed. Science of The Total Environment, 764: 142853.

DOI

[33]
Song Y Y, Xue D Q, Dai L H et al., 2020. Land cover change and eco-environmental quality response of different geomorphic units on the Chinese Loess Plateau. Journal of Arid Land, 12(1): 29-43.

DOI

[34]
Sun R, Wu Z X, Chen B Q et al., 2020. Effects of land-use change on eco-environmental quality in Hainan Island, China. Ecological Indicators, 109: 105777.

DOI

[35]
Turner B L, Clark W C, Kates R W et al., 1993. The Earth as Transformed by Human Action: Global and Regional Changes in the Biosphere over the Past 300 Years. Cambridge: Cambridge University Press.

[36]
Venter O, Sanderson E W, Magrach A et al., 2016. Sixteen years of change in the global terrestrial human footprint and implications for biodiversity conservation. Nature Communications, 7(1): 1-11.

[37]
Wang J Q, Pan W B, 2014. Application of remote sensing index in assesing ecological changes of Aojiang Watershed. Environmental Science and Management, 39(12): 186-190. (in Chinese)

[38]
Wang M Y, Xu H Q, 2018. Temporal and spatial changes of urban impervious surface and its influence on urban ecological quality: A comparison between Shanghai and New York. Chinese Journal of Applied Ecology, 29(11): 3735-3746. (in Chinese)

[39]
Wang S Y, Zhang X X, Zhu T et al., 2016. Assessment of ecological environment quality in the Changbai Mountain Nature Reserve based on remote sensing technology. Progress in Geography, 35(10): 1269-1278. (in Chinese)

DOI

[40]
Wang T S, 2015. Analysis on the factors and effects of technical efficiency of China’s service industry: An empirical research based on ridge regression. Science and Technology Management Research, 35(13): 206-210. (in Chinese)

[41]
Wu Z, Dai E F, Wu Z F et al., 2019. Future forest dynamics under climate change, land use change, and harvest in subtropical forests in southern China. Landscape Ecology, 34(4): 843-863.

DOI

[42]
Xiong Y, Zhang F, 2021. Effect of human settlements on urban thermal environment and factor analysis based on multi-source data: A case study of Changsha city. Journal of Geographical Sciences, 31(6): 819-838.

DOI

[43]
Xu H Q, 2013. A remote sensing urban ecological index and its application. Acta Ecologica Sinica, 33(24): 7853-7862. (in Chinese)

[44]
Yang N, 2004. The unique role of ridge regression analysis in solving multicollinearity problems. Statistics and Decision, 3: 14-15. (in Chinese)

[45]
Ye Y Q, Bryan B A, Zhang J E et al., 2018. Changes in land-use and ecosystem services in the Guangzhou-Foshan Metropolitan Area, China from 1990 to 2010: Implications for sustainability under rapid urbanization. Ecological Indicators, 93: 930-941.

DOI

[46]
Zha Y, Gao J, Ni S X, 2003. Use of normalized difference built-up index in automatically mapping urban areas from TM imagery. International Journal of Remote Sensing, 24(3): 583-594.

DOI

[47]
Zhai T L, Jin G, Deng X Z et al., 2016. Research of Wuhan City land use classification method based on multi-source remote sensing image fusion. Resources and Environment in the Yangtze Basin, 25(10): 1594-1602. (in Chinese)

[48]
Zhang F F, Li W Z, Lu L Y et al., 2012. Technologies of extracting land utilization information based on SVM method with multi-window texture. Journal of Remote Sensing, 16(1): 67-78. (in Chinese)

[49]
Zhang H M, Zhang Y F, Tian M et al., 2018. Dynamic monitoring of eco-environment quality changes based on PCA: A case study of urban area of Baoji City. Remote Sensing for Land & Resources, 30(1): 203-209. (in Chinese)

[50]
Zhang T, Gao Y, Li C et al., 2020. How human activity has changed the regional habitat quality in an eco-economic zone: Evidence from Poyang Lake Eco-Economic Zone, China. International Journal of Environmental Research and Public Health, 17(17): 6253.

DOI

[51]
Zhang Y, Liu Y F, Gu J P et al., 2011. Land use/land cover change and its environmental effects in Wuhan City. Scientia Geographica Sinica, 31(10): 1280-1285. (in Chinese)

DOI

[52]
Zhao J L, Yang Z Q, Govers G, 2019. Soil and water conservation measures reduce soil and water losses in China but not down to background levels: Evidence from erosion plot data. Geoderma, 337: 729-741.

DOI

[53]
Zhao Y B, Wang S J, Zhou C S, 2016. Understanding the relation between urbanization and the eco-environment in China’s Yangtze River Delta using an improved EKC model and coupling analysis. Science of the Total Environment, 571: 862-875.

DOI

Outlines

/