
Journal of Geographical Sciences >
Have China’s drylands become wetting in the past 50 years?
|
Zhang Yu, PhD Candidate, specialized in global change ecology. E-mail: zhangyu0041@igsnrr.ac.cn |
Received date: 2021-11-12
Accepted date: 2022-03-18
Online published: 2023-01-16
Supported by
The Major Program of National Natural Science Foundation of China(41991234)
The National Science Fund for Distinguished Young Scholars(41725003)
Copyright
Recently, whether drylands of Northwest China (NW) have become wetting has been attracting surging attentions. By comparing the Standard Precipitation Evapotranspiration Indices (SPEI) derived from two different potential evapotranspiration estimates, i.e., the Thornthwaite algorithm (SPEI_th) and the Penman-Monteith equation (SPEI_pm), we try to resolve the controversy. The analysis indicated that air temperature has been warming significantly at a rate of 0.4°C decade−1 in the last five decades and the more arid areas are more prone to becoming warmer. Annual precipitation of the entire study area increased insignificantly by 3.6 mm decade−1 from 1970 to 2019 but NW presented significantly increasing trends. Further, the SPEI_th and SPEI_pm demonstrated similar wetting-drying-wetting trends (three phases) in China’s drylands during 1970-2019. The common periodical signals in the middle phase were identified both by SPEI_th and SPEI_pm wavelet analysis. Analysis with different temporal intervals can lead to divergent or even opposite results. The attribution analysis revealed that precipitation is the main climatic factor driving the drought trend transition. This study hints that the wetting trend’s direction and magnitude hinge on the targeted temporal periods and regions.
ZHANG Yu , ZHANG Yangjian , CHENG Liang , CONG Nan , ZHENG Zhoutao , HUANG Ke , ZHANG Jianshuang , ZHU Yixuan , GAO Jie , SUN Yihan . Have China’s drylands become wetting in the past 50 years?[J]. Journal of Geographical Sciences, 2023 , 33(1) : 99 -120 . DOI: 10.1007/s11442-022-2067-5
Table 1 Summary of drying or wetting trends in China’s drylands |
| Location | Period | Data source | Index | Methods of regional classification | Related finding | Reference |
|---|---|---|---|---|---|---|
| Northwest China | 1950s-2000s | Observation | Temperature; Precipitation; Glacier melt water; Runoff; Lake level; Flood disasters; Vegetation cover; Dust storm days | Geographic boundary | A climate mutation to warm wet (1987 abrupt) | Shi et al. (2003) |
| North China | 1948-2008 | CPC GLDAS | Aridity Index (AI) | Climate classifications | Dryland extent has extended | Li et al. (2015) |
| China | 1961-2012 | CRU | SPEI_pm; PDSI_pm; sc_PDSI_pm; PDSI_th; sc_PDSI_th | Köppen climate classifications | Arid region and Tibetan Plateau (TP):↑; Semiarid regions:↓ | Chen et al. (2017) |
| Arid regions of Central Asia | 1950-2015 | CRU | SPEI_pm; PDSI_th; PDSI_pm; sc_PDSI_th; sc_PDSI_pm | Geographic and climatic characteristics | Xinjiang region and Hexi Corridor:↑ | Hu et al. (2018) |
| China | 1961-2016 | CMA | AI | Geographic and climatic characteristics | Northwest China and TP:↑; North and Northeast China:↓ | Liu et al. (2018) |
| Xinjiang, China | 1961-2015 | CMA | SPEI_th | Geographic boundary | 1961-1996:↑; 1997-2015:↓ | Yao et al. (2018) |
| Eurasia and Xinjiang, China | 1961-2019 | CRU | Temperature; Precipitation; SPI; PDSI | Topographic characteristics and geographic boundary | Wetting trend not a regional episode for Xinjiang | Wang et al. (2020) |
| Xinjiang, China | 1963-2018 | CRU | SPEI_pm | Geographic boundary | Overall trend:↑ (1988 abrupt); Southwest and Southeast part:↓ | Song et al. (2021) |
Note: ↑ (wetting trend); ↓ (drying trend). |
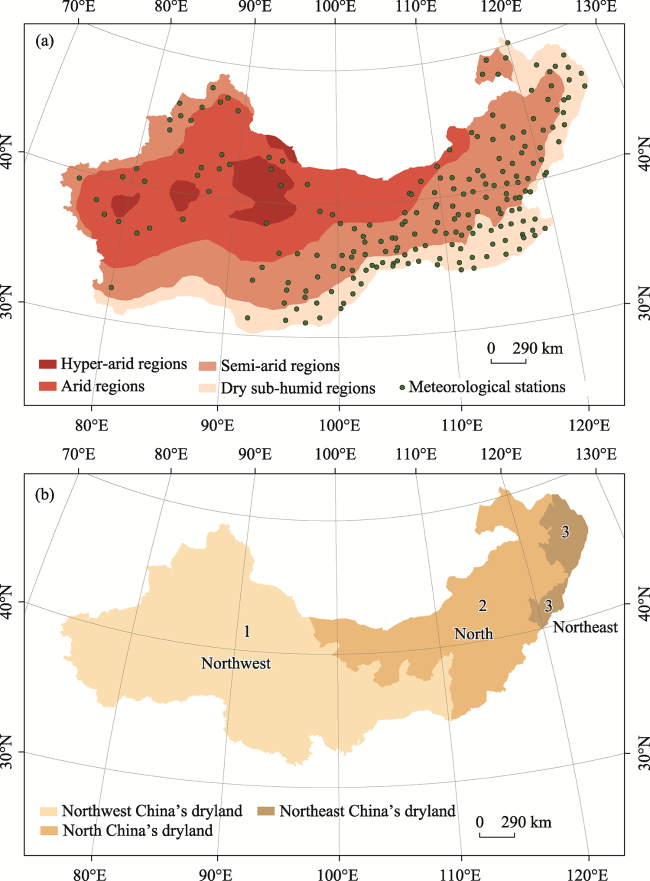
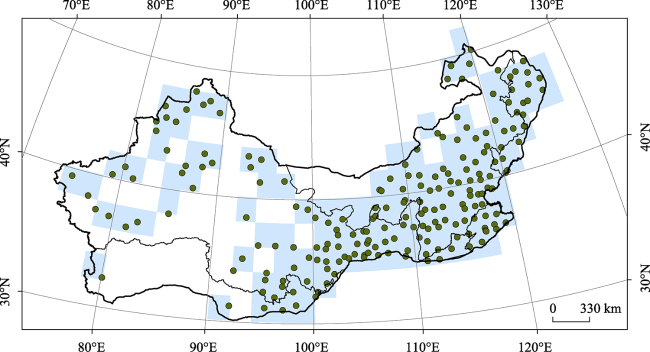
Figure 1 China’s drylands (a) and geographic boundary (b). In this study area, 206 meteorological stations (green dots) in China’s drylands (1970-2019) were used. No.1, Northwest China; No.2, North China; No.3, Northeast China; over drylands regions |
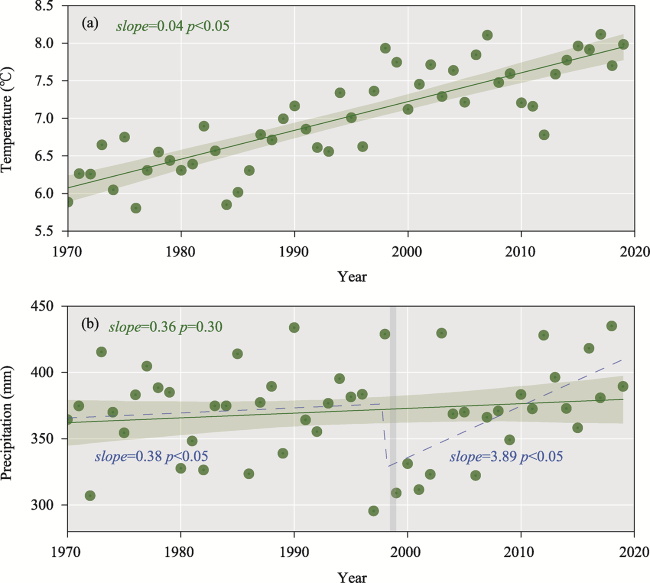
Figure 2 Time series of the annual mean air temperature (a) and precipitation (b). All green dots are averaged for 206 meteorological stations in China’s drylands (1970-2019). The green shaded area indicates the 95% confidence interval. The blue dotted lines indicate changes in slopes of precipitation. |
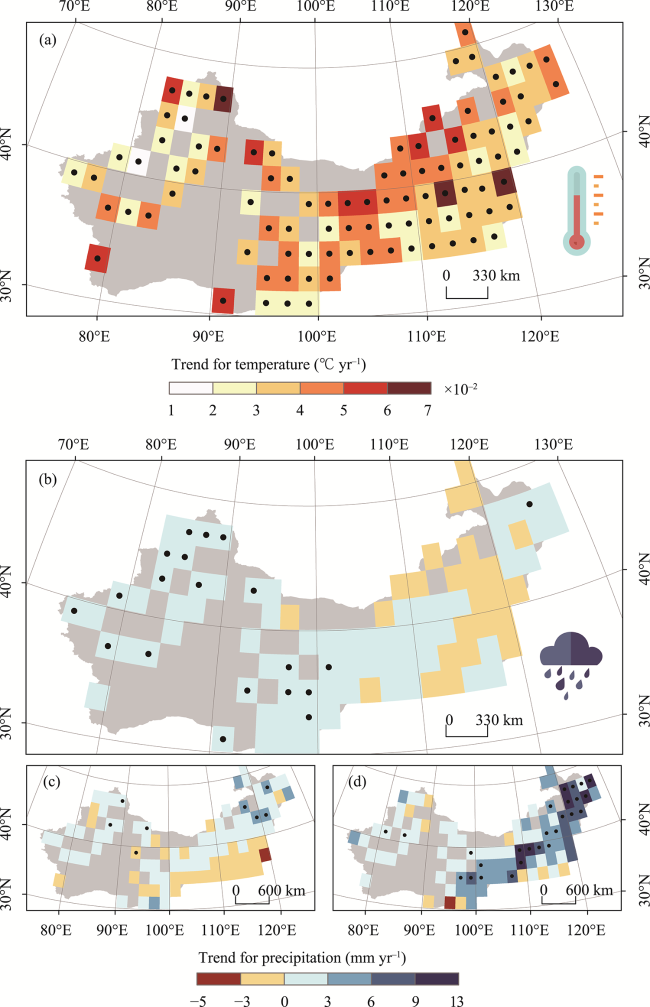
Figure 3 Long-term trends during 1970-2019 over China’s drylands in annual mean air temperature (a) and precipitation (b-d). Comparison of precipitation trends over China’s drylands between pre-turning point (1970-1998) (c) and post-turning point (1999-2019) (d). The black dots indicate the trends are statistically significant at the 95% significance level. |
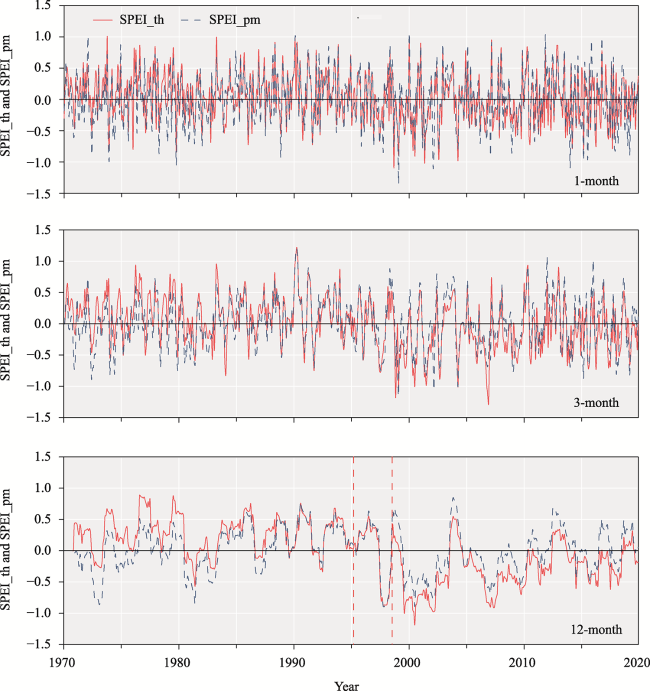
Figure 4 Multi-scale (1-, 3-, and 12-month) SPEI time series over China’s drylands (1970-2019). Time series of two different SPEI estimates forced with Thornthwaite algorithm (denoted as SPEI_th) and with Penman-Monteith equation (denoted as SPEI_pm), respectively. |
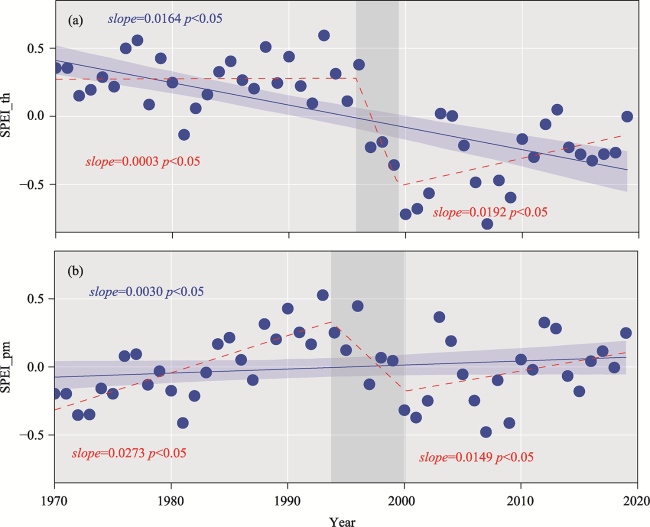
Figure 5 Comparisons of 12-month SPEI_th (a) and SPEI_pm (b) over China’s drylands from 1970 to 2019. Time series of two different SPEI estimates forced with Thornthwaite algorithm (denoted as SPEI_th) and with Penman-Monteith equation (denoted as SPEI_pm). The blue shaded areas indicate the 95% confidence interval. The red dotted lines indicate the changes in the slopes of SPEI. |
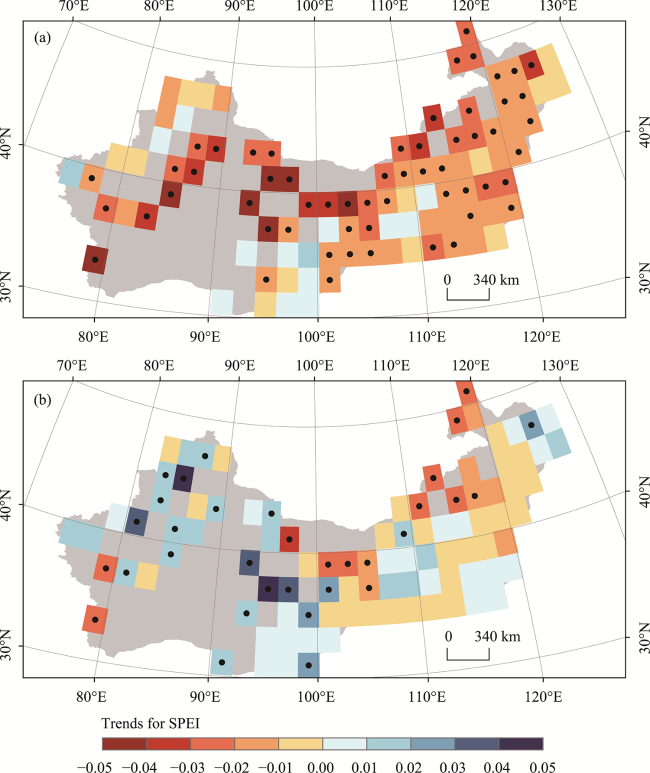
Figure 6 Long-term trends for 1970-2019 over China’s drylands according to 12-month SPEI_th (a) and SPEI_pm (b). Two different SPEI estimates forced with Thornthwaite algorithm (denoted as SPEI_th) and with Penman-Monteith equation (denoted as SPEI_pm), respectively. The black dots indicate the trends are statistically significant at the 95% significance level. |
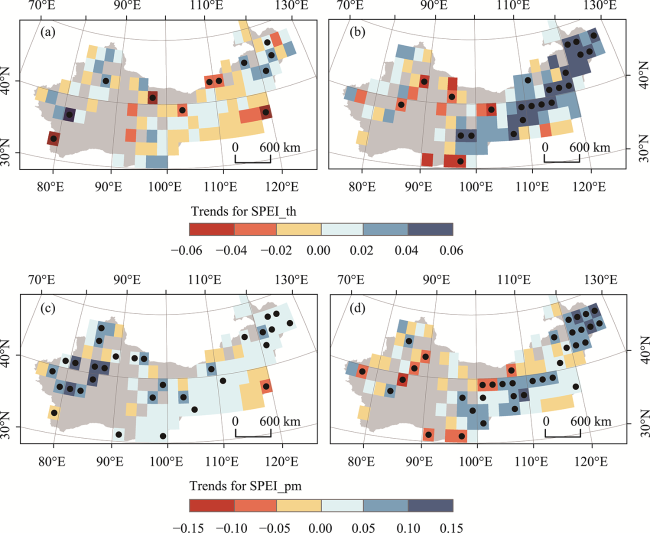
Figure 7 Comparison of 12-month SPEI_th (a-b) and SPEI_pm (c-d) trends over China’s drylands between pre-turning point and post-turning point periods. SPEI_th trend of 1970-1995 (a), SPEI_th trend of 1999-2019 (b); SPEI_pm trend of 1970-1993 (c), SPEI_pm trend of 2000-2019 (d). Two different SPEI estimates were forced with Thornthwaite algorithm (denoted as SPEI_th) and with Penman-Monteith equation (denoted as SPEI_pm), respectively. The black dots indicate the trends are statistically significant at a 95% significance level. |
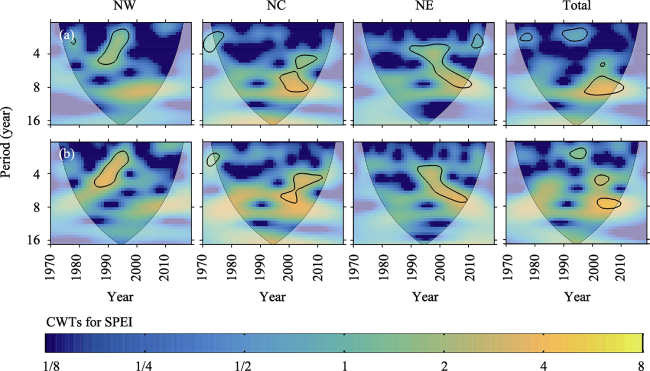
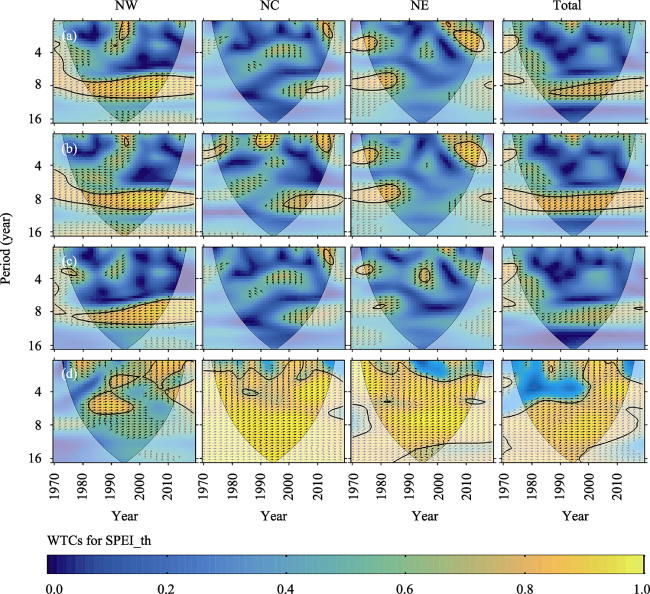
Figure 8 Continuous wavelet transforms (CWTs) for 12-month SPEI_th (a) and SPEI_pm (b) over China’s drylands from 1970 to 2019. The two different SPEI estimates are forced by Thornthwaite algorithm (denoted as SPEI_th) and Penman-Monteith equation (denoted as SPEI_pm), respectively. The period is measured in years. Each subplot shows the CWT in a region. NW = Northwest China’s drylands; NC = North China’s drylands; NE = Northeast China’s drylands; Total = China’s drylands. The color denotes the strength of the wavelet power. Tick contours denote 95% significance levels against yellow noise. Pale regions indicate the cone of influence where edge effects might bias the results. |
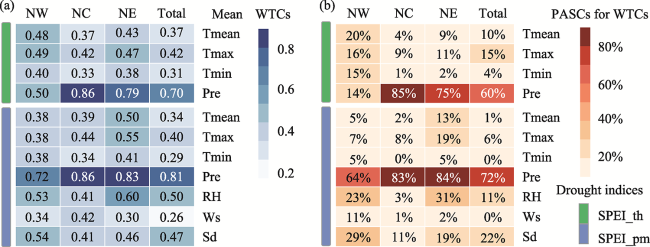
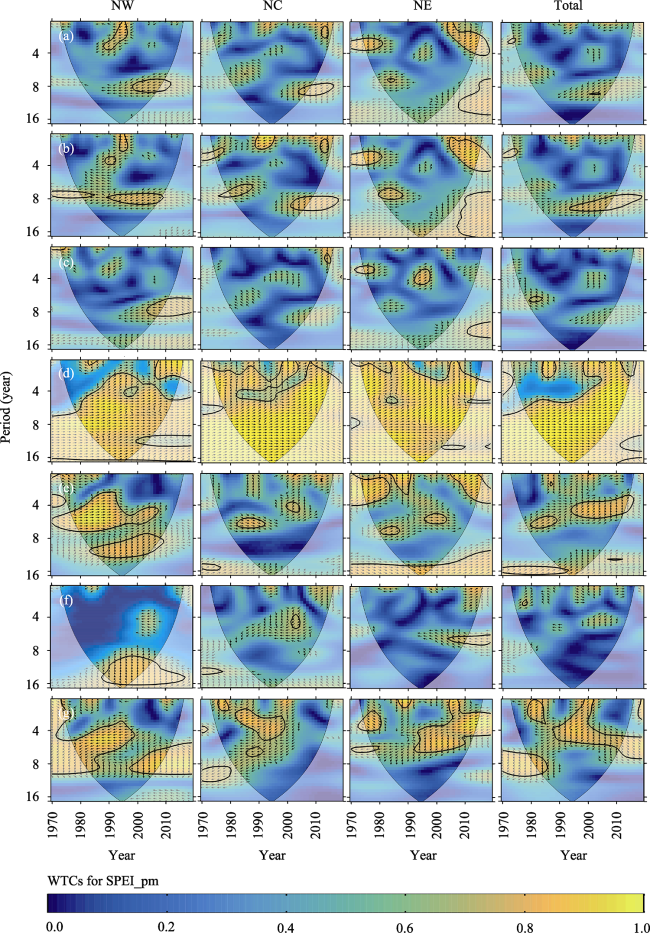
Figure 9 Mean wavelet transform coherences (WTCs) between drought indices (SPEI_th and SPEI_pm) and input climatic variables (a); the percent area of significant coherences (PASCs) for the WTCs between drought indices and input climatic variables (b). NW = the Northwest China’s drylands; NC = the North China’s drylands; NE = the Northeast China’s drylands; Total = the China’s drylands; Pre = precipitation; Tmean = mean air temperature; Tmax = mean max air temperature; Tmin = mean minimum air temperature; RH = relative air humid; Ws = wind speed; Sd = sunshine duration. |
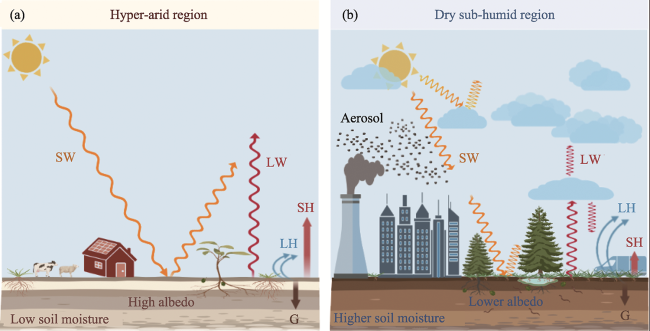
Figure 10 The thermodynamic mechanism of enhanced warming-more arid areas (SW = shortwave radiation; LW = longwave radiation; LH = latent heat flux; SH= sensible heat flux; G = ground heat flux) |
Figure S1 96 (2° × 2°) grid boxes (color: blue) were identified containing at least one station with continuous observations. In total, 206 meteorological stations (color: spruce green) were used. |
Figure S2 Wavelet transform coherences (WTCs) between 12-month SPEI_th and input climatic variables (a. mean air temperature; b. mean maximum air temperature; c. mean minimum air temperature; d. precipitation) over China’s drylands from 1970 to 2019. The SPEI estimates forced with Thornthwaite algorithm (denoted as SPEI_th). The period is measured in years. Each subplot shows the WTC between a region and the individual meteorological variable. NW = Northwest China’s drylands; NC = Northern China’s drylands; NE = Northeastern China’s drylands; Total = China’s drylands. The color denotes the strength of coherence. Thick contours reflect 95% significance levels against yellow noise. Pale regions indicate the cone of influence where edge effects might bias the results. Small arrows show the relative phase relationship (in-phase, arrow point right; anti-phase, arrows point left). |
Figure S3 Wavelet transform coherences (WTCs) between 12-month SPEI_pm and input climatic variables (a. mean air temperature; b. mean maximum air temperature; c. mean minimum air temperature; d. precipitation; e. relative air humid; f. wind speed; g. sunshine duration) over China’s drylands from 1970 to 2019. The SPEI estimates forced with Penman-Monteith equation (denoted as SPEI_pm). The period is measured in years. NW = Northwest China’s drylands; NC = North China’s drylands; NE = Northeast China’s drylands; Total = China’s drylands. |
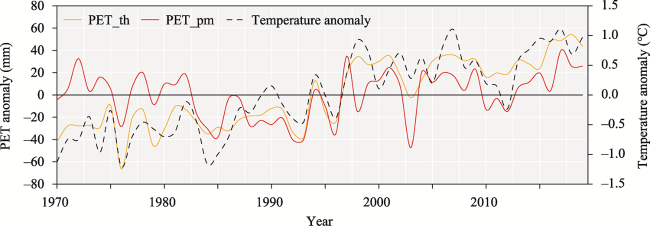
Figure S4 Changes in potential evapotranspiration (PET) anomaly over China’s drylands: 1970-2019. Time series of two PET anomaly calculated by two approaches: Thornthwaite algorithm (denoted as PET_th) and Penman-Monteith equation (denoted as PET_pm), against temperature anomaly. |
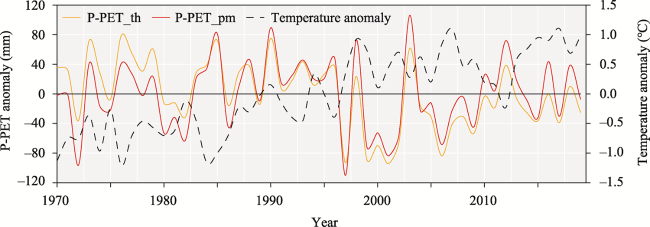
Figure S5 Changes in water balance (precipitation minus potential evapotranspiration (P-PET)) anomaly over China’s drylands: 1970-2019. Time series of two PET anomaly calculated by two approaches: Thornthwaite algorithm (denoted as PET_th) and Penman-Monteith equation (denoted as PET_pm), against temperature anomaly. |
| [1] |
|
| [2] |
|
| [3] |
|
| [4] |
|
| [5] |
|
| [6] |
|
| [7] |
|
| [8] |
|
| [9] |
|
| [10] |
|
| [11] |
|
| [12] |
|
| [13] |
|
| [14] |
|
| [15] |
|
| [16] |
|
| [17] |
|
| [18] |
|
| [19] |
|
| [20] |
|
| [21] |
|
| [22] |
|
| [23] |
|
| [24] |
|
| [25] |
|
| [26] |
|
| [27] |
|
| [28] |
|
| [29] |
|
| [30] |
|
| [31] |
|
| [32] |
|
| [33] |
|
| [34] |
|
| [35] |
|
| [36] |
|
| [37] |
|
| [38] |
|
| [39] |
|
| [40] |
|
| [41] |
|
| [42] |
|
| [43] |
|
| [44] |
|
| [45] |
|
| [46] |
|
| [47] |
|
| [48] |
|
| [49] |
|
| [50] |
|
| [51] |
|
| [52] |
|
| [53] |
|
| [54] |
|
| [55] |
|
| [56] |
United Nations (UN), 2015. Transforming Our World: The 2030 Agenda for Sustainable Development (United Nations General Assembly. https://www.un.org/sustainabledevelopment/progress-report/
|
| [57] |
|
| [58] |
|
| [59] |
|
| [60] |
|
| [61] |
|
| [62] |
|
| [63] |
|
| [64] |
|
| [65] |
World Meteorological Organization, 2020. WMO statement on the status of the global climate in 2019. In: Organización Mundial de la Meteorología, 1248: 44pp.
|
| [66] |
|
| [67] |
|
| [68] |
|
| [69] |
|
| [70] |
|
| [71] |
|
| [72] |
|
| [73] |
|
| [74] |
|
| [75] |
|
| [76] |
|
| [77] |
|
/
| 〈 |
|
〉 |