Research Articles

Embodied land in China’s provinces from the perspective of regional trade

  • WANG Shaojian ,
  • WANG Jieyu
Expand
  • Guangdong Provincial Key Laboratory of Urbanization and Geo-simulation, School of Geography and Planning, Sun Yat-sen University, Guangzhou 510006, China

Wang Shaojian (1986-), PhD, specialized in urban geography and low-carbon development. E-mail:

Received date: 2022-08-08

  Accepted date: 2022-10-20

  Online published: 2023-01-16

Supported by

The Humanities and Social Sciences Planning Fund of the Ministry of Education(21YJAZH087)

Copyright

© 2023 Science Press Springer-Verlag

Abstract

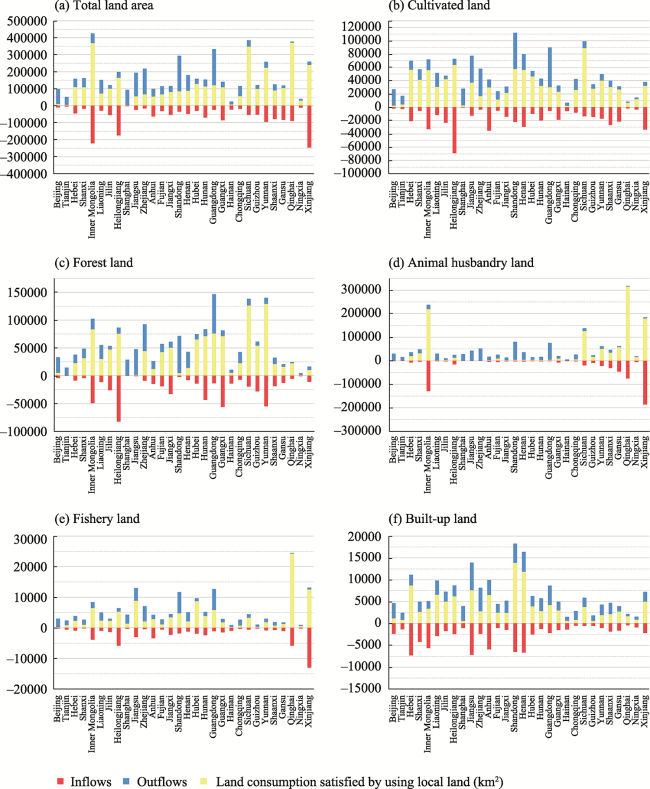
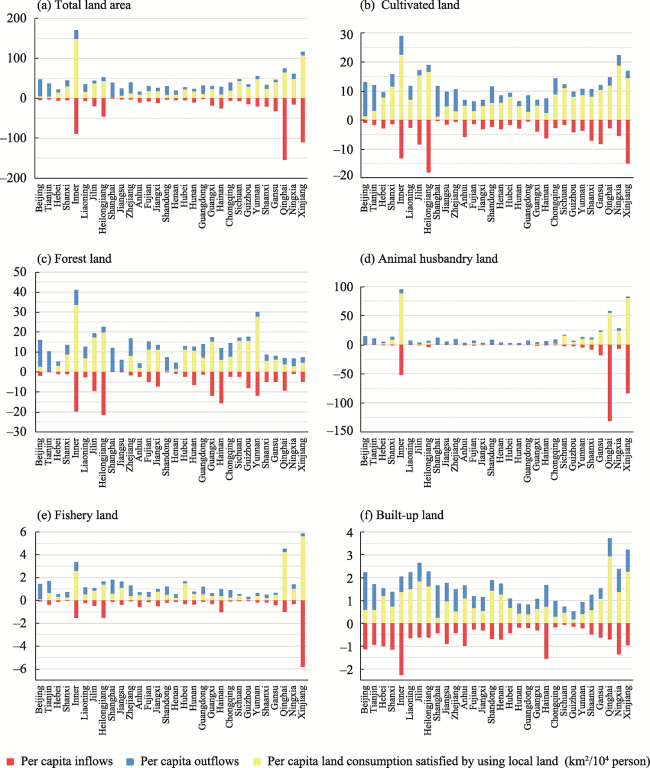
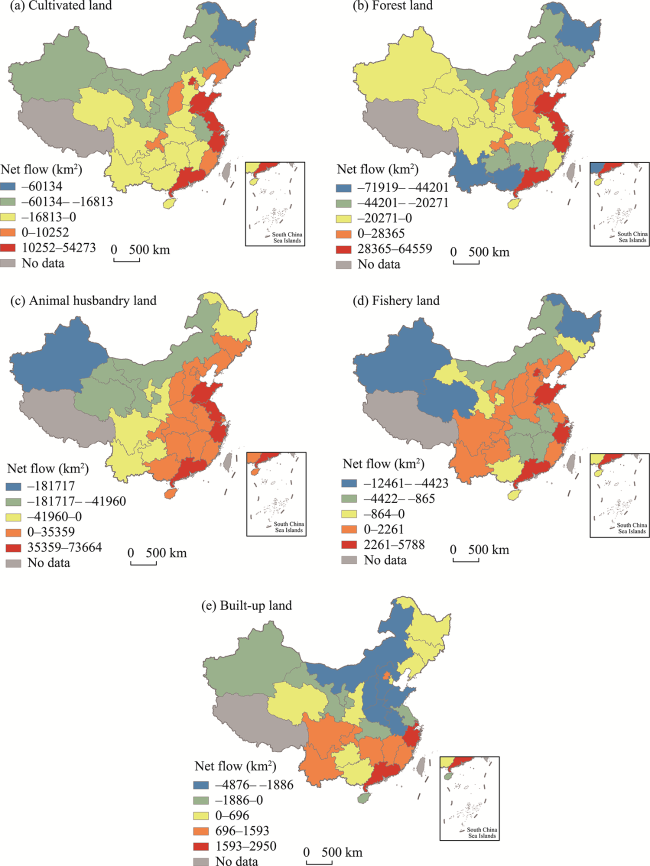
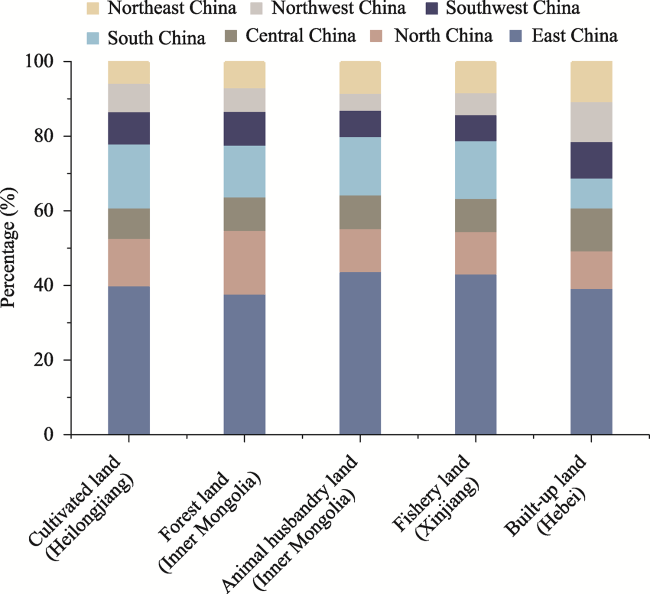
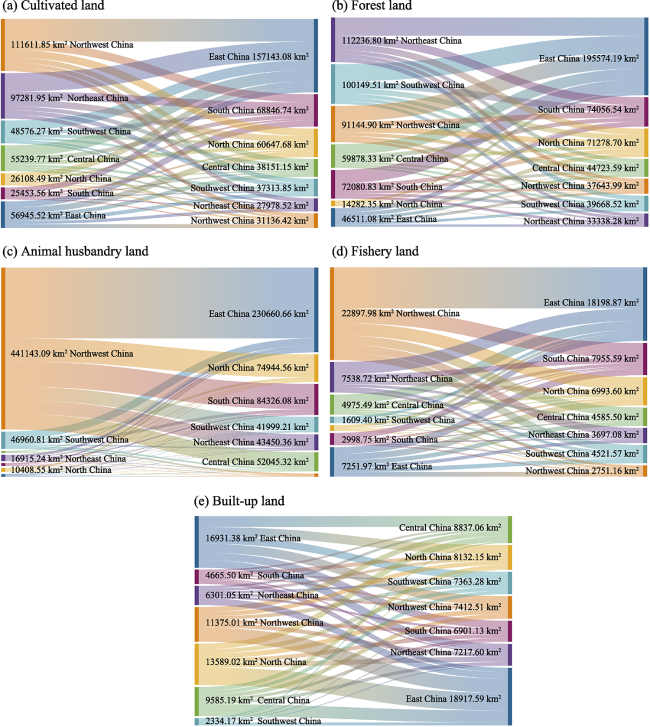
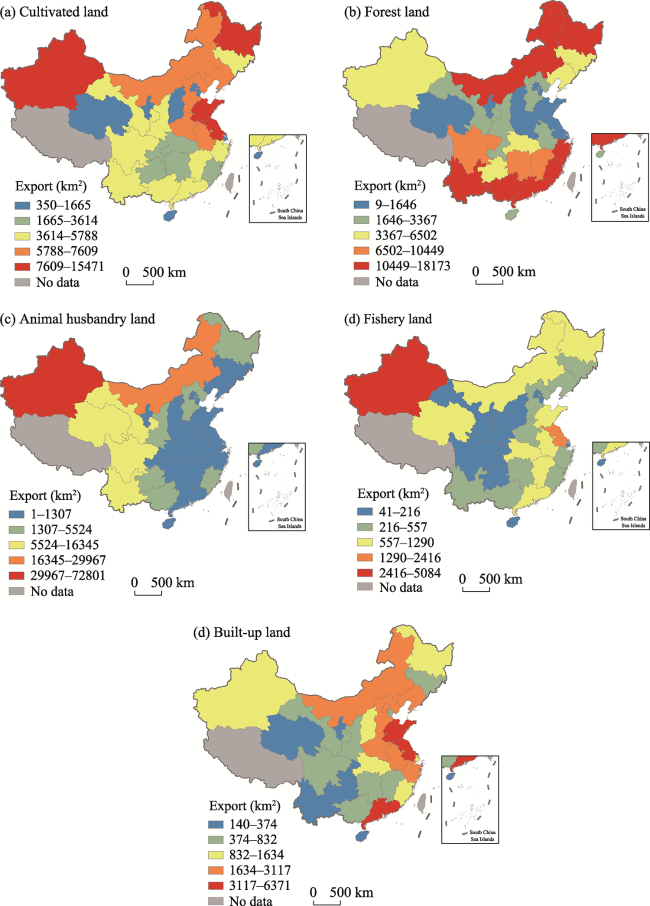
With the continuous enhancement of regional connectivity, the indirect use of land resources through the pathways of trade in goods and services plays an increasingly important role in the overall utilization of land resources. Despite this, relevant research in this field is still in its infancy, and few papers have addressed this issue. This paper uses a multi-regional input-output model to calculate the embodied land in the 30 provinces (autonomous regions and municipalities) and eight regions of China from the perspective of regional trade and further analyzes the spatial pattern of characteristics associated with embodied land flows. The results show that the amount of embodied land occupied by China’s inter-regional trade accounts for 21.39% of the country’s total land, and an average of 38.54% of China’s provincial land demand is met by land exports from other provinces. More than 80% of land consumed by Beijing, Tianjin, and Shanghai is from other provinces. The provinces of Heilongjiang, Inner Mongolia, Xinjiang, and Hebei are the largest net exporters of cultivated land, forest and grazing and aquatic land, fishery land, and built-up land, respectively (the outflows account for 42.26%, 27.53%, 38.66%, and 35.28% of the corresponding land types in the province); and Guangdong, Shandong, and Zhejiang are the main net importers. The flow of agricultural land (cultivated land, forest land, grazing land, and aquatic land) generally shows a shift from west to east and from north to south. The regions in northeast and northwest China have the largest scale of agricultural land outflows, mainly into East and South China. In addition, 8.43% of cultivated land, 7.47% of forest land, 6.41% of grazing land, 6.88% of aquatic land, and 18.35% of built-up land in China are provided for foreign use through international trade. This paper provides feasible ideas and a theoretical basis for solving the contradiction between land use and ecological protection, which could potentially help to achieve sustainable land use in China.

Cite this article

WANG Shaojian , WANG Jieyu . Embodied land in China’s provinces from the perspective of regional trade[J]. Journal of Geographical Sciences, 2023 , 33(1) : 59 -75 . DOI: 10.1007/s11442-023-2074-1

1 Introduction

Land is the basic resource and material guarantee for human survival, and it is also the space carrier of the main economic activities of human society (Long et al., 2018). Driven by increased land demand, expanded production, and rapid industrialization and urbanization in recent years, China is facing unprecedented pressure. Under the background of the current critical period of strategic transition, alleviating the shortage of land resources and realizing the sustainable utilization of land resources has become one of the important development goals in the future (Qiang et al., 2013a; Guo et al., 2014). However, considering that the current economic organization model attempts to match the supply of resources and the demand for commodities by expanding the production network (Chen and Han, 2015a), areas with developed economies, large populations, and a relative lack of land resources indirectly use the land of other areas through the trade of land-intensive products, so as to alleviate the pressure of land shortage (Chen et al., 2019). This kind of land embodied in commodity trade is considered an effective measure to relieve the pressure of land use and rationally allocate land resources to a certain extent (Liu et al., 2018a).
Embodied land, also known as virtual land, refers to the land resources required in the production and trade process of goods and services (Wichelns, 2001). It reflects the actual amount of land resources carried in the trade of goods and services (Yu et al., 2013). It is the land resource indirectly used in the production process of products, which exists in the processing of goods and services trading in a virtual form, not real land consumption (Luo, 2006). As globalization continues, production and trade chains continue to expand, and supply and demand are spatially rematched, embodied land use related to consumption and trade becomes increasingly important. In a globalized world, even if a country’s domestic needs can be met through its own land use, its dependence on external land ecosystems is increasing (Kissinger and Rees, 2010). Empirical studies on embodied land use started and gradually developed, mainly focusing on the accounting of embodied arable land resources, including the global scale (Weinzettel et al., 2013; Vivanco et al., 2017), national scale (Chen and Han, 2015b; O’Brien et al., 2015), and industrial sector scale (Khoo, 2015; Bosire et al., 2016). The issue of food security has always been a focal point of concern for the Chinese government and scholars, so most of the research on virtual water, virtual land and virtual land strategies in China has been centered on food security (Hu et al., 2006; Liu et al., 2007; Qiang et al., 2013b; Wang et al., 2015; Liu and Guo, 2018), i.e., mainly on virtual land resources for agricultural trade. For instance, Qiang et al. (2013b) calculated the embodied land in China’s crop trade from the perspectives of production and consumption. They found that China has changed from being a net exporter of embodied land for agricultural trade in 1986 to a net importer in 2009.
There are two main accounting methods for embodied land, one is based on the physical measurement and ecological footprint analysis, and the other is based on multi-regional, input-output analysis. Physical measurement and ecological footprint analysis are the main methods adopted by most domestic embodied land flow research. However, this method cannot trace the end use of agricultural and forestry products, so it can only assess the direct consumption of land caused by the primary products, such as the production by the agricultural and forestry sectors and rough processed products. Considering the insufficiency of physical quantity measurement, some scholars have begun to introduce and apply a multi-regional input-output model to calculate embodied land flow. The multi-regional input-output method can comprehensively and systematically reflect the economic relationships between various industries in various regions, carry out correlation analyses between different countries and regions, and further expand upon detailed research in individual countries or regions (Yao et al., 2018). Currently, multi-regional input-output models are widely used in regional and global studies to assess the impact of trade on various virtual resources, such as greenhouse gas emissions (Davis and Calderia, 2010; Peters et al., 2011; Guo et al., 2012), water footprints (Feng et al., 2011; Sun et al., 2017), and land replacement (Weinzettel et al., 2013; Marselis et al., 2017).
In summary, although some researchers on embodied land use have made some achievements, the research on embodied land is insufficient, in its infancy and only gradually developing, and mainly related to agricultural products. Furthermore, the research perspective is biased towards global and regional scales, lacking analysis on the provincial scale. Therefore, this paper uses a multi-regional input-output model to analyze the spatial pattern characteristics of embodied land flow in 30 provincial-level areas (province hereafter) and eight major regions in China and constructs an accounting framework for five types of embodied land. This study provides a new analytical perspective for alleviating the land resource constraints and the mismatch between the population distribution and spatial distribution of land resources in the rapid urbanization process. In addition, this study provides data support for establishing a land governance system, which would prove conducive to resolving the contradiction between land use and ecological protection and provide theoretical support for the sustainable use of land resources.

2 Data and methods

2.1 Data

Land-use data is collected from remote sensing satellite data such as Landsat 8 OLI and GF-2. The land classification system adopts the land-use remote sensing monitoring and classification system of the Chinese Academy of Sciences (Zhang et al., 2014), which applies a trinity observational technology system consisting of high-resolution remote sensing, unmanned aerial vehicles, and ground observations. When combined with the human-computer interaction interpretation method, the Landsat TM digital image covering China is obtained, and a national 1:100,000 scale land-use database is constructed (Dong et al., 2018). For the areas where the data quality of Landsat TM data is poor or cannot be covered, the CCD multispectral data of GF-2 is used as a replacement. Land use is divided into five types: cultivated land, forest land, animal husbandry land, fishery land, and built-up land. To ensure data quality, the quality inspection of the land data set was carried out by conducting field surveys in different regions across the country, stratified random sampling according to land types, etc., and the comprehensive evaluation accuracy of land-use classification exceeded 93% (Liu et al., 2014; Liu et al., 2018a).
Input-output data come from the 2012 China Inter-regional Input-Output Table compiled by the Chinese Academy of Sciences (Liu et al., 2018b). Due to the lack of land-use data in 2012, this paper uses the land-use data in 2013 to calculate the embodied land.

2.2 Data processing and uncertainty

China’s inter-regional input-output table contains the input-output relationships of 30 provinces (due to lacking data availability, Tibet, Taiwan, Hong Kong, and Macao are excluded) and 42 departments. However, the land-use classification is not completely consistent with the economic sectors of the input-output table, so it is necessary to adjust the economic sectors in the input-output table so that farmland, forest land, animal husbandry land, fishery land, and built-up land are consistent with the sectors of the input-output table.
The first is the correspondence between the four types of agricultural land (arable land, forest land, animal husbandry land, and fishery land), noting that only an agricultural sector (agriculture, forestry, animal husbandry, and fishery and services) is in the input-output table. In the input-output table, the four sub-sectors of agriculture, forestry, animal husbandry, and fishery are combined into one large agricultural sector, indicating that the four sub-sectors are assumed to have the same production structure and land-use coefficient. To more accurately calculate the amount of embodied land in the four categories of agriculture, forestry, animal husbandry, and fishery, we split the agricultural sector to provide different land-use coefficients for each land-use type. Because agricultural production is land-intensive, and most of the embodied land flows through the trade of agricultural products, it is of great significance to more accurately calculate the amount of implied land in these four sub-categories. The specific splitting steps are as follows: according to the percentages recorded in the “China Rural Statistical Yearbook” by the four agricultural sectors of agriculture, forestry, animal husbandry, and fishery, the sectors of “agriculture, forestry, animal husbandry, and fishery products and services” in the input-output table is divided into four sub-sectors. Thus, a more accurate estimation of the land-use coefficient of the four sub-sectors of agriculture, forestry, animal husbandry, and fishery specific to their respective locations can be obtained. The disaggregation of large agricultural sectors overturns the assumption in the input-output table that each agricultural sector has the same land-use coefficient and provides a different land-use coefficient for each agricultural sector, which is clearly more realistic.
This paper decomposes the built-up land categories into the remaining non-agricultural sectors in the input-output table in two steps. First, the percentage of built-up land in the mining, transportation, and storage sectors is found using the Chinese land survey data. The original sectors of coal mining and processing products, oil and gas mining products, metal ore mining and processing products, and non-metallic ores and other mining and processing products in the input-output table are then aggregated into the mining sector. Second, it is assumed that the area of built-up land used for non-agricultural production is proportional to the corresponding sectoral share of non-agricultural employment (excluding mining, transportation, and warehousing). Based on the employment data of the non-agricultural sector in each province, the remaining built-up land sector is further classified into the remaining non-agricultural sector in the input-output table (Chen et al., 2019). Such assumptions may lead to inaccurate results; however, due to data constraints, the corresponding assumptions are necessary, which is also a common practice following the existing literature (Yu et al., 2013; Chen et al., 2019). Although assumptions about the correspondence between built-up land and the non-agricultural sector may create uncertainty in the final results, built-up land accounts for a relatively small proportion of total land use compared with other types of land; therefore, the uncertainty of the corresponding assumptions between the built-up land and the non-agricultural sector may not lead to a large difference in the final results (Yu et al., 2013; Chen et al., 2019).

2.3 Multi-regional input-output model

Assuming there are m regions, each with n sectors, the standard formula for the multi- regional input-output model (MRIO) can be written as:
$x_{i}^{r}=\sum\nolimits_{s=1}^{m}{\sum\nolimits_{j=1}^{n}{z_{ij}^{rs}+\sum\nolimits_{s=1}^{m}{y_{i}^{rs}+e_{i}^{r}}}}$,
where $x_{i}^{r}~$is the total output of sector i of region r. $z_{ij}^{rs}$is the direct input of sector i of region r to sector j of region s.$~y_{i}^{rs}$is the final consumption of sector i of region s provided by
region r. $e_{i}^{r}$represents the products or services of sector i provided by region r to the rest of the world. The direct input coefficient is defined as the amount of value that sector i in region r requires to produce one monetary unit of output in sector j in region s. We define the ratio:
$a_{ij}^{rs}=z_{ij}^{rs}/x_{j}^{s},$
Allowing Eq. (1) to be transformed into:
$x_{i}^{r}=\sum\nolimits_{s=1}^{m}{\sum\nolimits_{j=1}^{n}{a_{ij}^{rs}x_{j}^{s}+\sum\nolimits_{s=1}^{m}{y_{i}^{rs}+e_{i}^{r}}.}}$
The above equation can be transformed into a matrix to describe the entire input-output system:
${{X}^{*}}={{A}^{*}}{{X}^{*}}+{{Y}^{*}}$
where ${{X}^{*}}=[x_{i}^{r}]$,$\text{ }\!\!~\!\!\text{ }{{A}^{*}}=[a_{ij}^{rs}],$ and ${{Y}^{*}}=[y_{i}^{rs},e_{i}^{r}]$ represent the matrices of inputs, direct input coefficients, and final demand, respectively. Assuming that A* is a constant, Eq. (4) can be transformed into:
${{X}^{*}}={{(I-{{A}^{*}})}^{-1}}{{Y}^{*}}$,
where I is an identity matrix$~{{(I-{{A}^{*}})}^{-1}}$ and is known as the inverse Leontief matrix, which reveals the amount of direct and indirect inputs required to meet the final demand for one unit of monetary value. Therefore, Eq. (5) calculates the change in sectoral output caused by the change in final demand.
To calculate the embodied land used for the production of goods and services, Eq. (5) can be further extended by adding the land use coefficient matrix:
$L_{k}^{*}=l_{k}^{*}{{(I-{{A}^{*}})}^{-1}}{{Y}^{*}}$
where$\text{ }\!\!~\!\!\text{ }L_{k}^{*}$is a matrix representing the embodied land area of region k.$\text{ }\!\!~\!\!\text{ }l_{k}^{*}$ represents the amount of land of type k directly used by a sector’s output. This study considered five types of land use, namely cultivated land, forest land, animal husbandry land, fishery land, and built-up land. Due to a lack of supplementary data, the embodied land use of foreign countries by each province is not included; however, the embodied land exports to foreign countries/regions are taken into account. In the matrix $L_{k}^{*}$, $L_{k}^{TS}$represents the area of the embodied land of type k in the region r consumed by the region s; therefore, the total area of k-type land use in the region r can be decomposed as:
$L_{k}^{r{}^\circ }=L_{k}^{TT}+\sum\nolimits_{r\ne s}{L_{k}^{rs}+L_{k}^{E}}$
where $L_{k}^{r{}^\circ }$ represents the total area of land use of type k in region r, which consists of the local consumed area and the embodied land area in the remaining area. $L_{k}^{TT}$is the local consumed land areas of type k in region r.$\sum\nolimits_{r\ne s}{L_{k}^{rs}}$is the embodied land area of type k in region r, and$~L_{k}^{E}$ is the embodied land area of type k in region r for foreign export. The total area of the k-type land that satisfies the consumption of the region r can be expressed as:
$L_{k}^{{}^\circ r}=L_{k}^{TT}+\sum\nolimits_{r\ne s}{L_{k}^{sr},}$
where$\ L_{k}^{{}^\circ r}$ is the total land area of type k in region r,$\sum\nolimits_{r\ne s}{L_{k}^{sr}}$is the embodied land area of type k flowing into the region r; therefore, the net embodied inflow of land of k-type in the region r is:
$\Delta L_{k}^{r}=\sum\nolimits_{r\ne s}{L_{k}^{sr}-\sum\nolimits_{r\ne s}{L_{k}^{rs},}}$
where$\Delta L_{k}^{r}$ is net flow embodied land area of type k in region r, the condition $\Delta L_{k}^{r}>0$ indicated that region r is a net inflow region of embodied land of type k, where the condition $\Delta L_{k}^{r}<0$ indicates that region r is a net outflow region.$\text{ }\!\!~\!\!\text{ }$The calculation of$\Delta L_{k}^{r}$ does not take into account exports to foreign countries/regions.

3 Results

3.1 The patterns of embodied land use in China’s provinces

Figure 1 shows the local land consumption caused by inter-provincial final demand and the amount of embodied land use by other provinces. From Figure 1a, it can be seen that a large amount of embodied land is included in the trading process of goods and services in China. The provinces with the largest total land consumption (that is, the total consumption of local land and the land of other provinces) are Inner Mongolia, Qinghai, and Sichuan, and the total land consumption exceeds 350,000 km2. Guangdong is the province that consumes the most land from other provinces, and Xinjiang has the largest land outflow, at about 245,100 km2. Shanghai’s embodied land inflow accounted for the highest proportion of the province’s land, at 1093%, followed by Beijing, Tianjin, Zhejiang, Jiangsu, Shandong, and Guangdong, all of which accounted for more than 100% of the province’s land. The province’s average embodied land inflow accounted for 101.5% of the province’s land; the province’s average embodied land outflow and net flow accounted for 26.59% and 91.45% of the province’s land, respectively. Based upon the proportion of embodied land inflow to the province’s total land consumption, more than 90% of Shanghai’s land needs and more than 87% of Beijing’s and Tianjin’s land needs are met by supplies from other provinces. In contrast, the western provinces consume less land from other provinces. For example, more than 90% of the final demand in Gansu and Qinghai is met by local land, and only less than 10% of the land demand needs to be met by supply from other provinces. In general, an average of 38.54% of the land demand in China’s provinces is met through embodied land from other provinces. In comparison, the amount of embodied land occupied by China’s inter-regional trade accounts for 21.39% of the country’s total land.
Figure 1 Land inflow/outflow at the provincial level in China
Because most agricultural production is land-intensive, the embodied land consumed is mainly concentrated in the agricultural sector, including cultivated land, forest land, and animal husbandry land. The areas with the most total cultivated land consumption (the sum of the cultivated land from the local area and other provinces) are mainly concentrated in coastal areas (e.g., Shandong, Guangdong, and Jiangsu). The areas with the greatest total forest land consumption (the sum of local and other provinces’ forest land) are concentrated in southwestern regions such as Sichuan and Yunnan, the areas with the largest total consumption of animal husbandry land (consumption of local animal husbandry land and animal husbandry land in other provinces) are mainly concentrated in western regions such as Qinghai, Sichuan, Inner Mongolia, and Gansu. Guangdong is the province that consumes the most cultivated land and forest land from other provinces, and Shanghai and Shandong are the regions that consume the most animal husbandry land and fishery land from other provinces, respectively. More than 80% of the demand for cultivated land, forest land, and animal husbandry land in Shanghai, Tianjin, and Beijing is met by supply from other provinces. Nearly two-thirds of the provinces have more than 50% of their animal husbandry land needs to be met through the supply of other provinces. It can be seen that the distribution of animal husbandry land resources in China is extremely uneven, and the animal husbandry land in a few provinces (e.g., Xinjiang and Inner Mongolia) meets the needs of most provinces. In the non-agricultural sector land (built-up land), an average of 44.74% of the built-up land demand for a province is met through the embodied land in other provinces. The provinces with the greatest total consumption of built-up land (the sum of local and other provinces’ built-up land) are Shandong, Jiangsu, and Henan.
Figure 2 shows the per capita embodied land inflow/outflow. It can be seen from Figure 2a that the areas with the most local land consumption per capita are mainly concentrated in northwest areas such as Qinghai, Inner Mongolia, Xinjiang, Ningxia, and southwest areas, such as Yunnan and Sichuan. The per capita consumption of local land in Jiangsu, Beijing, Tianjin, and Shanghai is significantly lower than that of other regions, and the per capita embodied land inflow in these regions is at the forefront of the country. Inner Mongolia, Qinghai, Xinjiang, and Heilongjiang have the largest per capita embodied land outflows. The per capita inflow/outflow patterns of cultivated land and forest land are similar. Beijing, Tianjin, Shanghai, Zhejiang, and Inner Mongolia are the regions with the largest per capita embodied cultivated land and forest land inflows, while Heilongjiang and Inner Mongolia are the regions with the largest per capita embodied cultivated land and forest land outflows. Qinghai, Xinjiang, and Inner Mongolia have the largest per capita outflows for animal husbandry, and Inner Mongolia, Heilongjiang, Hainan, Qinghai, and Xinjiang have significantly higher per capita outflows for fishery land than other regions. Beijing, Shanghai, and Tianjin have the highest per capita embodied built-up land inflows, whereas Inner Mongolia, Hainan, and Ningxia have the highest per capita embodied built-up land outflows.
Figure 2 Per capita land inflow/outflow at the provincial level in China

3.2 Major embodied land inflow/outflow provinces

The distribution of net land flow of different land types has obvious spatial differences. It can be seen from Figure 3 that the net inflow of cultivated land is mainly distributed in coastal areas, such as Shandong, Guangdong, Shanghai, and Jiangsu. In contrast, in some northern provinces such as Heilongjiang, outflow accounts for 42.26% of the province’s cultivated land area; similarly, Anhui (44.96%), Xinjiang (38.66%), and Inner Mongolia (27.53%) are the three other areas with the largest outflow of cultivated land. The main outflow provinces of embodied forest land are located in the southwest and northeast regions with the most abundant forest land resources. These include Heilongjiang, Guangxi, Yunnan, and Inner Mongolia, within which the outflow of forest land compared to the total forest land accounts for 42.25%, 35.95%, 24.82%, and 27.53%, respectively. In contrast, the eastern coastal areas such as Guangdong, Shandong, Zhejiang, and Jiangsu are the main net inflow areas of forest land.
Figure 3 Net land flows for each land use category at the provincial level in China
The distribution of animal husbandry land resources is extremely uneven. The animal husbandry land in the four provinces of Xinjiang, Inner Mongolia, Qinghai, and Gansu meets the needs of most provinces. The sum of the outflow of animal husbandry land accounts for 75.16% of the total outflow. On average, 59.96% of the demand for animal husbandry land in each province in China is met by the embodied animal husbandry land in other provinces, which is much higher than other types of land, indicating that domestic animal husbandry land is highly interdependent. In addition, the eastern coastal areas such as Shandong, Guangdong, Zhejiang, and Jiangsu are the main inflow areas of animal husbandry land. The provinces with a net inflow of fishery land are mainly distributed in the North China Plain and the southeastern coastal areas, and the provinces with net outflow are mainly distributed in the northern regions such as Xinjiang, Inner Mongolia, Heilongjiang, and Qinghai. The outflow of fishery land of the total area of fishery land in these provinces accounts for 38.66%, 27.53%, 42.25%, and 18.93%, respectively. The reason may be that the North China Plain and the southeastern coastal areas have a large population and developed economy, which have a large demand for fishery land. Although they have abundant fishery resources, they still need to consume a large amount of fishery land from other areas to meet the excessive demand. However, to develop the economy, Xinjiang, Inner Mongolia, and other relatively backward regions can only import a large amount of primary agricultural products to the developed regions, resulting in a large number of fishery land being used by the developed regions and becoming a net outflow of fishery land. The net flow of embodied built-up land has obvious spatial differences with the north and south as the boundary. The net inflow provinces are mainly distributed in the southeast coastal area, such as Beijing and Tianjin, and the net outflow provinces are mainly distributed in the central and northern regions. The provinces with the largest outflow are Hebei, Jiangsu, Henan, and Shandong, where the outflow of built-up land accounts for 35.28%, 34.22%, 32.42%, and 23.01% of the total land, respectively.

3.3 Spatial pattern of embodied land flow between regions

Figure 4 reflects the land flow of the provinces with the largest outflow of each type of land. Heilongjiang is the largest exporting province of cultivated land. According to the amount of embodied cultivated land flowing out to each region from Heilongjiang, the regions can be sorted into East China, South China, North China, Southwest China, Central China, Northwest China, and Northeast China. The cultivated land in Heilongjiang mainly flows into the eastern and southern coastal areas. Inner Mongolia, rich in forest resources, is the largest outflow province of forest land and animal husbandry land in China. It mainly flows out to East China and South China, accounting for 52% of the total outflow of Inner Mongolia’s embodied forest land and animal husbandry land. Xinjiang is the largest outflow province of embodied fishery land. The fishery land in Xinjiang used by East China, South China, and Central China accounted for 43%, 15%, and 9% of their total outflows, respectively. Hebei is the province with the largest outflow of built-up land in China. According to the size of the built-up land flowing into each region, the regions can be sorted into East China, Central China, Northeast China, Northwest China, Southwest China, North China, and South China. In addition, the embodied built-up land in Hebei used by East and Central China accounted for 51% of its total outflow.
Figure 4 Land flows from the largest land exporters in China
Figure 5 displays the interregional land flows among the different regions in China. The northeast and northwest regions are the main embodied cultivated land outflow areas, and the sum of their outflows accounts for 49.27% of the total cultivated land outflows. The northeast, southwest, and northwest regions are the main embodied forest outflow regions, and the sum of their outflows accounts for 60.98% of the total outflows. East China, South China, and North China are the most important inflows of embodied forest land, accounting for 39.29%, 14.88%, and 14.36% of the total inflow, respectively. Northwest China is the most important outflow area of embodied animal husbandry land, and its outflow accounts for 82.07% of the total outflow. The main inflows of embodied animal husbandry land in Northwest China are East China (43.66%) and South China (15.63%). In terms of the flow of fishery land, more than half of the fishery land that flows domestically comes from the Northeast and Northwest regions. The main outflow areas of built-up land are East China, North China, and Northwest China, which account for 25.76%, 20.98%, and 17.31% of the total outflow, respectively. The main inflow areas for built-up land include East China, South China, and North China.
Figure 5 The inter-regional land flows among the different regions in China

3.4 Export of Chinese land to foreign countries

In addition to the domestic inter-regional land flow, some of China’s land is used to meet the demand for land in international trade with other countries. This study found that 8.43% of cultivated land, 7.47% of forest land, 6.41% of animal husbandry land, 6.88% of fishery land, and 18.35% of built-up land are supplied to foreign countries through international trade. The main export areas of cultivated land are located in the northern region. Shandong, Xinjiang, Heilongjiang, and Jiangsu are the largest important export areas of cultivated land, and their exports account for 10.28%, 8.68%, 7.39%, and 6.73% of the total export cultivated land in the country, respectively (Figure 6a). The northeastern and southern regions are the main forest land export areas (Figure 6b), such as Yunnan (10.63% of the total national forest land export), Heilongjiang (7.75%), Fujian (7.70%), Guangdong (7.67%) and Guangxi (7.61%). China’s export of animal husbandry land mainly comes from Inner Mongolia and Xinjiang provinces (Figure 6c), which, together, account for more than 60% of the country’s total animal husbandry land exports. As can be seen from Figure 6d, Xinjiang and Jiangsu are the main export areas for fishery land, and their exports account for 25.95% and 12.34% of the total export of fishery land in the country, respectively. In addition, there are large differences in the number of built-up land exports between the eastern coastal and inland provinces (Figure 6e). The main exporting provinces of built-up land are Jiangsu (accounting for 13.84% of the total national export of built-up land), Shandong (10.93%), Guangdong (9.33%), Hebei (6.77%), and Zhejiang (5.34%).
Figure 6 The amount of land exported to foreign countries/regions at the provincial level in China

4 Discussion

Achieving sustainable development is the basic strategic goal of China’s current and future economic and social development. As a strategic economic resource, land resources are an integral part of the country’s comprehensive strength. Under the background of the current critical period of strategic transformation, alleviating the shortage of land resources and realizing sustainable utilization of land resources has become one of the important development goals in the future. Due to the vast territory of China, there is significant spatial heterogeneity in resource endowment and economic development levels (Lin et al., 2018). The transformation of the economic development model has separated the production chain from the consumption chain, and the spatial dislocation of production and consumption has become increasingly obvious. The matching of consumption, production, and the spatial distribution of resources enables different types of land to be used most effectively. Areas with a developed economy, large population, and a relative lack of land resources tend to use land in other areas indirectly through the trade of land-intensive products so as to achieve the purpose of alleviating the pressure of land shortage. However, for the regions involved in the land trade, this embodied land flow will have complex socioeconomic and ecological impacts, which will have additional far-reaching impacts on its sustainable development.
Specifically, embodied land flows can have positive or negative socioeconomic and environmental impacts in both inflow and outflow regions, and such impacts can occur in different locations and spatiotemporal scales. Taking embodied cultivated land as an example, the cultivated land trade between the embodied cultivated land outflow areas, such as Inner Mongolia and Xinjiang, and the embodied cultivated land inflow areas, such as Shanghai and Guangdong, may cause the overuse of agricultural land in Inner Mongolia and Xinjiang. Consequently, the extensive use of fertilizers and pesticides in agricultural production may reduce biodiversity, damage ecosystem services, and increase carbon emissions from transportation systems. On the other hand, the flow of embodied cultivated land will also increase economic income, create employment opportunities, and intensive land use in Xinjiang and other outflow areas. In addition, for more developed areas such as Shanghai and Guangdong, the impact of this land flow may be that many arable lands are no longer used for cultivating crops but are converted into forest land or encroached upon by urban land, thus affecting the ecosystem. These developed inflow areas have transferred land pressure through trade, thereby upgrading the industrial structure and developing their service industries. In addition, the movement of embodied land may also impact the transportation between the inflow and outflow areas. For example, the long-distance transportation of agricultural products may consume energy and increase carbon dioxide emissions in the areas along the route. In general, embodied land flows have complex economic, social, and environmental impacts, not only directly on land use but also indirectly on economic sectors and consumer spending. There is also a cascading effect, in which the effects of land flow on one system radiate outward to many other systems. This kind of impact on the economy, society, and environment is usually non-linear and volatile and has a lag effect and legacy effect (that is, after the land stops flowing, the impact will not immediately stop but persist for some time) (Liu et al., 2013). Therefore, both the inflow and outflow areas of embodied land should consider the ecological and socioeconomic impacts.
Researching embodied land flow in China can provide a basis for understanding the ecological and socioeconomic impacts of land-use change. This study finds that, on average, 38.54% of the land demand in China’s provinces is met through the embodied land in other provinces, and there is a strong interdependence between the provinces. The consumption structure and its change are the main determinants of land-use changes in an inter-regional economic system. For the less-developed regions in the west and the north, exporting land to other regions will not only stimulate their economic growth but also bring corresponding resource and environmental problems. The research results on the spatial pattern of implicit land flow can directly measure responsibility from the perspective of consumption, which is helpful in the realization of Payment for Ecosystem Services mechanisms (Naeem et al., 2015). That is to say, the resource and environmental problems caused by land flow in a certain area not only need to be resolved by the local area itself but also need to assume the responsibility for the other areas that consume the land in the source area. The embodied land inflow area should pay ecosystem service compensation to the embodied land outflow area. Through the study of the embodied land flow pattern, this paper defines who is responsible for the consumption of land, which helps to realize the principle of environmental fairness in the context of regional trade. Discussing the responsibilities of inflow and outflow areas concerning land-use issues and providing data support for the establishment of a land governance system is conducive to resolving the contradiction between land use and ecological protection and strengthens the accounting and management of embodied land resources, which is conducive to the realization of sustainable land use (Xu et al., 2020).

5 Conclusions

Under the background of rapid urbanization, the contradiction between the supply and demand of land resources, urbanization, farmland protection, and ecological environment protection has become increasingly intensified. Alleviating the constraints of land resources in the rapid urbanization process and resolving the contradiction between land supply and demand and ecological pressure is extremely important to realize the sustainable use of land resources. Therefore, this study uses a multi-regional input-output model to reveal the flow of provincial embodied land, identify the pattern of embodied land flow at the provincial level in China, and provide a new perspective for creating a land governance system and the realization of sustainable land development.
An average of 38.54% of the land demand in each province is met through the embodied land in other provinces. The developed coastal provinces consume a large amount of land in the western provinces, of which more than 80% of the land consumption in Beijing, Tianjin, and Shanghai comes from other provinces. Heilongjiang is the province with the largest net outflow of cultivated land (outflow accounts for 42.26% of the province’s cultivated land area). Inner Mongolia is the province with the largest net outflow of forest land and animal husbandry (outflow accounts for 27.53% of the province’s forest land and animal husbandry land area). Xinjiang (with outflow accounting for 38.66% of the province’s fishery land area) and Hebei (outflow accounting for 35.28% of the province’s built-up land area) are the provinces with the largest net outflow of fishery land and built-up land, respectively. Guangdong, Shandong, and Zhejiang are the main provinces with net land inflows. The flow of agricultural land (arable land, forest land, animal husbandry land, and fishery land) generally shows a trend from west to east and from north to south. Areas with the largest loss of agricultural land are in the northeastern and northwestern regions, which mainly flowed into East China and South China. In addition, 8.43% of China’s arable land, 7.47% of forest land, 6.41% of animal husbandry land, 6.88% of fishery land, and 18.35% of built-up land are supplied to foreign countries through international trade. The overseas export of agricultural land is mainly concentrated in the northeastern and northwestern regions, while the export of built-up land is mainly concentrated in the eastern coastal provinces.
Upon considering the inter-regional flow of embodied land, the analyses in this study can provide useful information on the potential environmental feedback of future land-use changes. It can further expand the scope of land management, help to establish a reasonable cooperation system, and provide feasible ideas and a theoretical basis for resolving the contradiction between land use and ecological protection. Developed regions need to take responsibility for the land and environment of underdeveloped regions that have been destroyed in their past urbanization and industrialization processes and should also make environmental compensation for their corresponding consumer responsibilities in underdeveloped regions, thereby establishing a more reasonable and fair land governance system to provide effective solutions for the long-term sustainable development of land.
[1]
Bosire C K, Krol M S, Mekonnen M M et al., 2016. Meat and milk production scenarios and the associated land footprint in Kenya. Agricultural Systems, 145: 64-75.

DOI

[2]
Chen G Q, Han M Y, 2015a. Global supply chain of arable land use: Production-based and consumption-based trade imbalance. Land Use Policy, 49: 118-130.

DOI

[3]
Chen G Q, Han M Y, 2015b. Virtual land use change in China 2002-2010: Internal transition and trade imbalance. Land Use Policy, 47: 55-65.

DOI

[4]
Chen Y, Li X, Liu X et al., 2019. Quantifying the teleconnections between local consumption and domestic land uses in China. Landscape and Urban Planning, 187: 60-69.

DOI

[5]
Davis S J, Caldeira K, 2010. Consumption-based accounting of CO2 emissions. Proceedings of the National Academy of Sciences of the United States of America, 107(12): 5687-5692.

[6]
Dong J W, Kuang W H, Liu J Y, 2018. Continuous land cover change monitoring in the remote sensing big data era. Science China Earth Sciences, 48(2): 259-260. (in Chinese)

[7]
Feng K, Chapagain A, Suh S et al., 2011. Comparison of bottom-up and top-down approaches to calculating the water footprints of nations. Economic Systems Research, 23(4SI): 371-385.

DOI

[8]
Guo S, Liu J B, Shao L et al., 2012. Energy-dominated local carbon emissions in Beijing 2007: Inventory and input-output analysis. Scientific World Journal, 923183.

[9]
Guo S, Shen G Q, Chen Z et al., 2014. Embodied cultivated land use in China 1987-2007. Ecological Indicators, 47: 198-209.

DOI

[10]
Han M, Chen G, 2018. Global arable land transfers embodied in mainland of China’s foreign trade. Land Use Policy, 70: 521-534.

DOI

[11]
Hu B Q, Yang W B, Shao H, 2006. Application of virtual land security strategy to the sustainable land use in county territory: A case study of Du’an and Tiandong Guangxi. Tropical Geography, 26 (2): 97-101. (in Chinese)

[12]
Khoo H H, 2015. Review of bio-conversion pathways of lignocellulose-to-ethanol: Sustainability assessment based on land footprint projections. Renewable & Sustainable Energy Reviews, 46: 100-119.

[13]
Kissinger M, Rees W E, 2010. Importing terrestrial biocapacity: The US case and global implications. Land Use Policy, 27(2SI): 589-599.

[14]
Lin W Q, Wu M H, Zhang Y et al., 2018. Regional differences in China’s urbanization and their driving factors. Science China Earth Sciences, 48(5): 639-650. (in Chinese)

[15]
Liu H M, Wang K Q, Shi F, 2007. An empirical analysis of virtual land resource imports for food in China. Chinese Rural Economy, (11): 26-33. (in Chinese)

[16]
Liu J, Hull V, Batistella M et al., 2013. Framing sustainability in a telecoupled world. Ecology and Society, 18(2): 26.

[17]
Liu J Y, Kuang W H, Zhang Z X, 2014. Spatiotemporal characteristics, patterns and causes of land use changes in China since the late 1980s. Acta Geographica Sinica, 69(1): 3-14. (in Chinese)

DOI

[18]
Liu J Y, Ning J, Kuang W H et al., 2018a. Spatio-temporal patterns and characteristics of land-use change in China during 2010-2015. Acta Geographica Sinica, 73(5): 789-802. (in Chinese)

DOI

[19]
Liu W D, Tang Z P, Han M Y et al., 2018b. The 2012 China Multi-Regional Input-output Table of 31 Provincial Units. Beijing: China Statistics Press. (in Chinese)

[20]
Liu Y H, Guo C X, 2018. Emipirical studies on land embodied in the foreign trade of China: A literature review. China Population, Resources and Environment, 28(11): 65-72. (in Chinese)

[21]
Long H L, Zhang Y N, Tu S S, 2018. Land consolidation and rural vitalization. Acta Geographica Sinica, 73(10): 1837-1849. (in Chinese)

DOI

[22]
Luo Z L, 2006. Exploring the sustainable use management of regional land resources based on the virtual land perspective. Land & Resources Herald, 3(2): 17-20. (in Chinese)

[23]
Marselis S M, Feng K, Liu Y et al., 2017. Agricultural land displacement and undernourishment. Journal of Cleaner Production, 161: 619-628.

DOI

[24]
Naeem S, Ingram J C, Varga A et al., 2015. Get the science right when paying for nature’s services. Science, 347(6227): 1206-1207.

DOI PMID

[25]
O’Brien M, Schuetz H, Bringezu S, 2015. The land footprint of the EU bioeconomy: Monitoring tools, gaps and needs. Land Use Policy, 47: 235-246.

DOI

[26]
Peters G P, Minx J C, Weber C L et al., 2011. Growth in emission transfers via international trade from 1990 to 2008. Proceedings of the National Academy of Sciences of the United States of America, 108(21): 8903-8908.

DOI PMID

[27]
Qiang W, Liu A, Cheng S et al., 2013a. Agricultural trade and virtual land use: The case of China’s crop trade. Land Use Policy, 33: 141-150.

DOI

[28]
Qiang W L, Liu A M, Cheng S K et al., 2013b. Quantification of virtual land resources in China’s crop trade. Journal of Natural Resources, 28(8): 1289-1297. (in Chinese)

[29]
Sun S, Fang C, Lv J, 2017. Spatial inequality of water footprint in China: A detailed decomposition of inequality from water use types and drivers. Journal of Hydrology, 553: 398-407.

DOI

[30]
Vivanco D F, Sprecher B, Hertwich E, 2017. Scarcity-weighted global land and metal footprints. Ecological Indicators, 83: 323-327.

DOI

[31]
Wang Y F, Feng R X, Guo T B, 2015. Analysis of virtual land import benefits of China’s major agricultural products. Journal of Agrotechnical Economics, (4): 26-35. (in Chinese)

[32]
Weinzettel J, Hertwich E G, Peters G P et al., 2013. Affluence drives the global displacement of land use. Global Environmental Change-Human and Policy Dimensions, 23(2): 433-438.

DOI

[33]
Wichelns D, 2001. The role of ‘virtual water’ in efforts to achieve food security and other national goals, with an example from Egypt. Agricultural Water Management, 49(2): 131-151.

DOI

[34]
Xu Z, Li Y, Chau S N et al., 2020. Impacts of international trade on global sustainable development. Nature Sustainability, 3(11): 964-971.

DOI

[35]
Yao Qiuhui, Han Mengyao, Liu Weidong, 2018. Tracking embodied carbon flows in the Belt and Road regions. Acta Geographica Sinica, 73(11): 2210-2222. (in Chinese)

DOI

[36]
Yu Y, Feng K, Hubacek K, 2013. Tele-connecting local consumption to global land use. Global Environmental Change-Human and Policy Dimensions, 23(5SI): 1178-1186.

DOI

[37]
Zhang Z, Wang X, Zhao X et al., 2014. A 2010 update of National Land Use/Cover Database of China at 1:100000 scale using medium spatial resolution satellite images. Remote Sensing of Environment, 149: 142-154.

DOI

Outlines

/