The effects of climate change and phenological variation on agricultural production and its risk pattern in the black soil area of northeast China

  • GAO Jiangbo , 1 ,
  • LIU Lulu 1 ,
  • GUO Linghui 2 ,
  • SUN Dongqi 3 ,
  • LIU Wanlu 1, 4 ,
  • HOU Wenjuan 1 ,
  • WU Shaohong 1, 4
Expand
  • 1. Key Laboratory of Land Surface Pattern and Simulation, Institute of Geographic Sciences and Natural Resources Research, CAS, Beijing 100101, China
  • 2. School of Surveying and Land Information Engineering, Henan Polytechnic University, Jiaozuo 454000, Henan, China
  • 3. Key Laboratory of Regional Sustainable Development Modeling, Institute of Geographic Sciences and Natural Resources Research, CAS, Beijing 100101, China
  • 4. College of Resources and Environment, University of Chinese Academy of Sciences, Beijing 100049, China
*Guo Linghui (1983-), PhD and Associate Professor, specialized in climate change and ecological response, ecosystem service trade-off. E-mail:

Gao Jiangbo (1984-), PhD and Professor, specialized in integrated physical geography, mountain ecosystem services, climate change impact and adaptation. E-mail:

Received date: 2022-10-08

  Accepted date: 2022-11-21

  Online published: 2023-01-16

Supported by

The Strategic Priority Research Program of the Chinese Academy of Sciences(XDA28130104)

Copyright

© 2023

Abstract

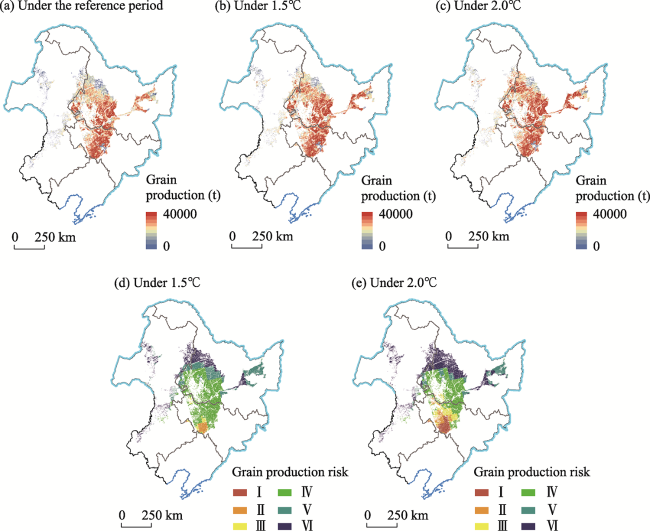
The black soil region of northeast China is a vital food base and is one of the most sensitive regions to climate change in China. However, the characteristics of the crop phenological response and the integrated impact of climate and phenological changes on agricultural productivity in the region under the background of climate change are not clear. The future agricultural risk assessment has been insufficiently quantified and the existing risk level formulation lacks a sound basis. Based on remote sensing products, climate data, and model simulations, this study integrated a logistic function fitting curvature derivation, multiple linear regression, and scenario simulation to investigate crop phenology dynamics and their climate response characteristics in the black soil region. Additionally, the compound effects of climate and phenology changes on agricultural production and possible future risks were identified. The key results were as follows: (1) From 2000 to 2017, 29.76% of the black soil region of northeast China experienced a significant delay in the start of the growing season (SOS) and 16.71% of the total area displayed a trend for the end of the growing season (EOS) to arrive earlier. The time lagged effects of the SOS in terms of the crop response to climatic factors were site and climatic parameter dependent. The influence of temperature was widespread and its effect had a longer lag time in general; (2) Both climatic and phenological changes have had a significant effect on the inter-annual variability of crop production, and the predictive ability of both increased by 70.23%, while the predictive area expanded by 85.04%, as compared to that of climate change in the same period of the growing season; (3) Under the RCP8.5 scenario, there was a risk that the future crop yield would decrease in the north and increase in the south, and the risk area was constantly expanding. With a 2.0℃ rise in global temperature, the crop yield of the southern Songnen black soil sub-region would reduce by almost 10%. This finding will improve our understanding of the mechanisms underlying climate change and vegetation productivity dynamics, and is also helpful in the promotion of the risk management of agrometeorological disasters.

Cite this article

GAO Jiangbo , LIU Lulu , GUO Linghui , SUN Dongqi , LIU Wanlu , HOU Wenjuan , WU Shaohong . The effects of climate change and phenological variation on agricultural production and its risk pattern in the black soil area of northeast China[J]. Journal of Geographical Sciences, 2023 , 33(1) : 37 -58 . DOI: 10.1007/s11442-023-2073-2

1 Introduction

Climate change is one of the greatest challenges faced by human beings in recent years and is a crucial factor influencing the sustainable development of the economy and society (Byers et al., 2018; Chen et al., 2020; Su et al., 2021). Recent climate change has greatly changed the spatial and temporal pattern of agricultural production factors and agricultural production processes, which threaten global food security (Liu et al., 2018; Fujimori et al., 2019; Liu et al., 2020). Averaged globally, climate change has caused recent yield decreases in rice production (0.3%) and wheat production (0.9%) (Ray et al., 2019). Strong yield losses have been predicted for global soybean production (14%-43%) and spring wheat production (14%-52%) under the future scenario by 2050 (Osborne et al., 2013), and overall agricultural productivity will be reduced between 2% and 15% (Delincé et al., 2015). By the end of the 21st century, an average projected loss in global crop yields of 5.6% is predicted due to temperature changes alone under the lowest emissions scenario, with this figure rising to 18.2% under the highest emissions scenario (Zhao et al., 2017). Therefore, studying the mechanisms by which climate change impacts agricultural production, and enhancing the ability to adapt to climate change, has become an important strategic task in the establishment of global and regional sustainable development. Some studies have found that the fluctuation of crop yield is mainly controlled by the change in average temperature (Arnell et al., 2019; Hou et al., 2021), with estimated average yield reductions of 5.8% in maize (Hou et al., 2021), 5.7% in wheat (Liu et al., 2016), and 3.2% in rice (Zhao et al., 2017) for a 1℃ increase in mean temperature. However, other studies have reported that the global precipitation fluctuation in the future will be highly heterogeneous, and the sensitivity of crop yield to precipitation may be higher than that to temperature (Liu et al., 2013; Leng and Hall, 2019). Agricultural production is a complex process that relies on multiple factors. Although many studies have explored the possible impact of climate change through the joint simulation of multiple crop models, covering the continuous enrichment of crop types, more comprehensive response indicators, and increasingly in-depth analyses of the mechanisms involved, the results are still uncertain due to the structure, premise assumptions, and input parameters of the models used (Rosenzweig et al., 2013; Kukal and Irmak, 2018). Furthermore, most crop models have consider related processes, such as climate change, crop water supply and demand, and changes in the growing season, but the quantification of their cascading effects still needs to be investigated further (Lin et al., 2015; Zhao et al., 2017).
Northeast China is one of the three black soil regions in the northern hemisphere and is also the largest commercial grain production base in China (Lam et al., 2013). The output of corn, rice, soybean, and other crops accounts for about 30% of the total output of the country (Lv et al., 2019; Sun and Li, 2019). Over the past few decades, due to excessive soil reclamation and utilization, unsustainable farming activities, and the long-term concepts of reuse and light cultivation, soil erosion in the black soil area of northeast China has become serious, the soil layer has become thinner, and the fertility has decreased (Xu et al., 2010; Li et al., 2017). Additionally, the soil nutrient efficiency has been reduced and the environmental risk has increased (Xu et al., 2010; Jiang et al., 2019). The black soil area in northeast China is also one of the areas of China that is most sensitive to climate change. Over the past 50 years, the regional average temperature has risen by 0.38℃/l0a, which is higher than the national average (Liu et al., 2009). The average temperature is likely to increase further (Zhang et al., 2019), while precipitation has generally shown a fluctuating but increasing trend, with a growing heterogeneity (Piao et al., 2021) under future climate scenarios. The changes in hydrothermal conditions could improve the potential productivity to a certain extent, but they may also lead to the aggravation of agrometeorological disasters. According to the China bulletin on flood and drought disaster mitigation 2019, the drought and flood affected areas of cropland in northeast China reached 3.29 × 10⁶ and 4.60 × 10⁶ ha, respectively, and the risk to agricultural production may increase in the future (Ari et al., 2021). Therefore, the protection and scientific utilization of black soil cropland has become a core issue in the national food security strategy. Clarifying the response characteristics of crop production in the black soil region of northeast China under climate change and identifying the degree of risk presented by agrometeorological disasters is not only a scientific and technological approach to managing the national economy and the livelihood of citizens but will also assist with the major political task of implementing the instructions of the central government.
Many studies have investigated the possible impact of climate change on agricultural production in northeast China through field experiments, remote sensing inversions, and model simulation (Li et al., 2016; Chu et al., 2017; Wang et al., 2020; Zhang et al., 2021). Chu et al. (2017) identified the spatial distribution and temporal variation of agricultural thermal and precipitation resources. Zhang et al. (2019) and Lv et al. (2015) analyzed the fluctuation characteristics and future trends of grain yield in crops. Other studies have investigated the temporal and spatial variation of crop phenology and its response to climate change (Lin et al., 2017; Xiao et al., 2021) and even the impact of crop phenology on crop growth (Wang et al., 2020). However, few studies have focused on crop phenology to analyze the comprehensive effects of climate change and the phenological response on agricultural production. Quantitative identification of the contribution of climate variability and risk level in agrometeorological disaster risk assessment has been insufficient (He et al., 2013). It has therefore proven difficult to provide more information for decision makers.
This study was based on the whole chain of climate change, phenological response, a productivity dynamics, and risk assessment. The objectives were to: (1) investigate the characteristics of crop phenological response to climate change in the black soil region of northeast China; (2) quantify the comprehensive effects of climate factors and crop phenological changes on agricultural production; and (3) evaluate the variation of agricultural risk under different temperature rise scenarios. The results will lead to a more comprehensive understanding of the measures necessary to mitigate climate change in the region and contribute to the provision of national food security.

2 Materials and methods

2.1 Study area

This study area was located in northeast China, which includes Liaoning Province, Jilin Province, Heilongjiang Province, and Hulunbuir City, Xing’an League, Tongliao City, and Chifeng City of the Inner Mongolia Autonomous Region (Figure 1), with a total area of about 1.25 million km2 (You et al., 2021). This region has a temperate continental monsoon climate with hot and rainy conditions in summer, while it is cold and dry in winter. The annual average temperature is -1 to 9℃, and annual precipitation is about 500‒800 mm. Precipitation is mainly concentrated in June to September, which accounts for 60%-70% of the annual precipitation. The frost-free period is about 140-170 days (Liu et al., 2009). The black land in this region is concentrated and connected, covering about 556,000 km2 across 146 county-level administrative regions (Liu et al., 2021). The region is well known for being fertile, and the output of soybean and corn account for approximately 45.8% and 32.8%, respectively, of the entire national output (http://data.stats.gov.cn/).
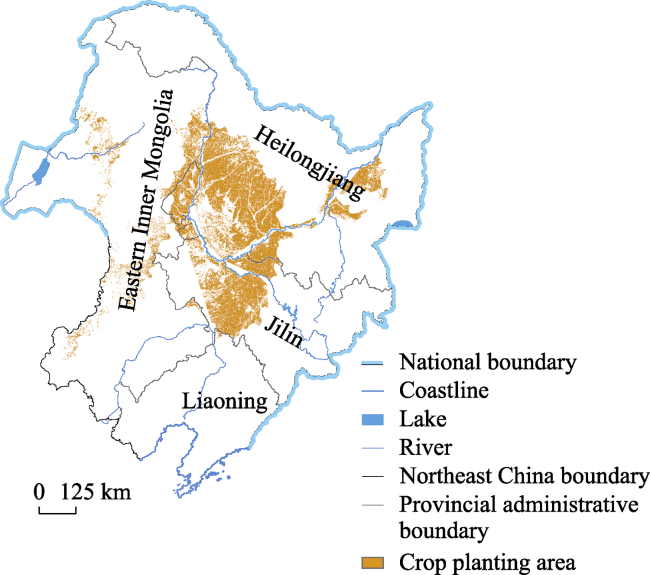
Figure 1 Spatial distribution of the crop planting area in the black soil area of northeast China

2.2 Dataset

A dataset was compiled that included the following information. (1) The vector boundary of the typical northeast black soil area. This boundary was obtained through digitization of the results of Liu et al. (2021) and covered the black soil sub-region in eastern Inner Mongolia, Songnen black soil sub-region, and Sanjiang black soil sub-region. (2) Land use data. Land use data with a 1 km resolution in 2000 and 2015 were obtained from the resources and environmental science and data center of the Chinese Academy of Sciences (https://www.resdc.cn/). (3) Enhanced vegetation index (EVI) data. The data originated from the 8-day EVI inversion product from 2000 to 2017, which was provided by the University of Oklahoma Center for Spatial Analysis (CSA), with a 500 m spatial resolution. This product was calculated from the MOD09A1 C6 500 m 8-day land surface reflectance dataset and was then filled with a linear interpolation and smoothed using a Savitzky-Golay filter after checking for bad quality data (Zhang et al., 2017). (4) Meteorological data. Historical meteorological data for the period of 2000-2017 were collected from the China Meteorological Administration (CMA) science data sharing service network (http://data.cma.cn/). The data included the monthly average temperature (Tm), monthly average minimum temperature (Tmin), monthly average maximum temperature (Tmax), and monthly precipitation (TP). First, meteorological stations with long-term unmeasured data were eliminated, and the few unmeasured values were then interpolated using the mean value of the same period for the adjacent years. Second, based on digital elevation model (DEM) data, the original meteorological data for the remaining 2031 meteorological stations in China was interpolated to a 1 km spatial resolution dataset using the AUSPLINE software. The future daily climate scenario data were obtained from the five global climate models (GCMs) under the framework of the Inter-Sectoral Impact Model Intercomparison Project (ISI-MIP), with a spatial resolution of 0.5° × 0.5°. To determine the grain production risk in the black soil area under the worst climate change scenario in the future and provide a baseline for coping with climate change, only the RCP 8.5 scenario, representing the highest level of greenhouse gas emissions, was selected. (5) Grain production data. The historical grain production data at the county (district) scale were obtained from the China county statistical yearbook and regional yearbooks, which were mainly used for the correction of simulation data. We took the sum of rice, wheat, and corn production as the total grain production. The grain production data under the RCP8.5 scenario were obtained from Xiong et al., which took 1981-2010 as the historical period. In addition, considering the intersection of the simulation period and different heating periods, the period of 1991-2010 was selected as the reference period. The future grain production simulation did not consider the adjustment of the future planting area and the progress made in agricultural technology, and reflected the impacts of climate change (Xiong et al., 2012; 2020).
The vector boundary and land use data for the northeast black soil area were converted into 1 km grid data with ArcGIS 10.4 software for use as climate interpolation data. To reduce the impacts of land use change, images of the 1 km agricultural land for 2000 and 2015 were masked upon each other. Then, the remaining agricultural land was used to further mask the 1 km grid boundary data. Areas with sparse vegetation (EVI values less than 0.05 from April (the 97th day) to the peak of the growing season) were excluded, to generate the agricultural planting range in the northeast black soil area (Figure 1). At the same time, the EVI data were also resampled to a resolution of 1 km, accurately corresponding to the climate interpolation data.

2.3 Methods

2.3.1 Estimating crop phenology

The four-parameter logistic function fitting curve curvature derivation method based on the EVI accumulation curve was used to extract the start of the growing season (SOS) and the end of the growing season (EOS). This method could effectively overcome the abnormal vegetation phenology caused by environmental interference (such as drought and pest infestation) (Wu et al., 2016). To eliminate the interference of snow and rainfall on the EVI curve in early spring or autumn and winter, only the crop growth period from the beginning of April (the 13th image) to the end of October (the 38th image) was used in the analyses, with these dates selected based on the growth pattern of single season crops in northeast China. Furthermore, to eliminate the interference of environmental factors at the beginning of the growing season, the minimum EVI value before the maximum EVI value in the crop growing period was used to replace the original EVI value before this minimum value. The calculation was as follows:
$CumEV{{I}_{t}}=\underset{i=1}{\overset{t}{\mathop \sum }}\,EV{{I}_{i}}$
$CumEV{{I}_{t}}=\frac{c}{1+{{e}^{a+bt}}}+d$
$RCC =\text{ }{{b}^{3}}cz\left\{ \frac{3z\left( 1-z \right){{\left( 1+z \right)}^{3}}\left[ 2{{\left( 1+z \right)}^{3}}+{{b}^{2}}{{c}^{2}}z \right]}{{{\left[ {{\left( 1-z \right)}^{4}}+bc{{z}^{2}} \right]}^{2.5}}} \right\}-\frac{{{\left( 1+z \right)}^{2}}\left( 1+2z-5{{z}^{2}} \right)}{{{\left[ {{\left( 1+z \right)}^{4}}+{{\left( bcz \right)}^{2}} \right]}^{1.5}}}$
where t represents day of the year (DOY) for an 8-day interval, cumEVIt is the cumulative EVI from 1 DOY to time t, a and b are fitting parameters, the sum of c and d is the maximum cumEVI, and d is the minimum cumEVI. z = e (a+bD), D is DOY on a daily scale. The first inflection point of the rate of change of curvature (RCC) was identified as the SOS, while another inflection point was identified as the EOS.

2.3.2 Time lag effect of crop phenology

Agricultural crop growth is not only related to climate factors but is also strongly influenced by human activities such as crop variety renewal, fertilization, and irrigation. We therefore calculated the first-difference time series (i.e., the value of every year minus the value in the first year) for crop SOS (∆SOS) / EOS (∆EOS) and the corresponding climate factors, such as ∆Tmax, ∆Tmin, ∆Tm, and ∆TP, which has been reported to eliminate non-climatic influences, such as crop management (Guo et al., 2019). Then, the time lag effects of the crop phenology response to climatic factors were identified by a correlation analysis based on the first-difference time series of crop phenology and climate variables.
${{r}_{xyTj}}=\frac{\mathop{\sum }_{i=1}^{m}\left( {{x}_{iTj}}-{{{\bar{x}}}_{Tj}} \right)\left( {{y}_{i}}-\bar{y} \right)}{\sqrt{\mathop{\sum }_{i=1}^{m}{{\left( {{x}_{iTj}}-{{{\bar{x}}}_{Tj}} \right)}^{2}}}\sqrt{\mathop{\sum }_{i=1}^{m}{{\left( {{y}_{i}}-\bar{y} \right)}^{2}}}}$
$LagT=Tj,\ \text{when}\ r_{xyTj}^{2}=\text{max}\left( r_{xy0}^{2},r_{xy1}^{2},r_{xy2}^{2},r_{xy3}^{2} \right)$
For each climate factor, LagT is the lagged time interval, $r_{xyTj}^{2}~$ is the square of the correlation coefficient for the different lagged time ranges, Tj represents the previous months and ranges from 0 to 3 (marked separately as T0, T1, T2, or T3), and x refers to the first-difference time series of climate factors (∆Tm, ∆TP, ∆Tmin, and ∆Tmax), respectively. For example, ∆Tm2 refers to the first-difference time series of the average Tm from the current month to the previous two months; and y refers to the first-difference time series of crop phenology (∆SOS, ∆EOS) and m indicates the time series length of these first-difference data. Finally, the least square method was used to fit a linear slope (S) to characterize the change of crop phenology or climate factors. All of the statistical analyses were performed at a significance level of 0.10.

2.3.3 Climate impact on crop productivity

The EVI can reflect the photosynthetic capacity of vegetation and has a strong correlation with the gross primary productivity (GPP) and other vegetation productivity indices. First, we defined crop productivity as the average value of EVI during the growth season, which was determined by the month in which the average growth season started and ended in the whole study area. Second, the effects of climate factors and the SOS and EOS on crop productivity were identified by a multiple linear regression analysis.
$\begin{align} & \Delta EVI={{A}_{Tj}}*\Delta Tma{{x}_{Tj}}+{{B}_{Tj}}*\Delta Tmi{{n}_{Tj}}+{{C}_{Tj}}*\Delta T{{m}_{Tj}} \\ & \text{ }+{{D}_{Tj}}*\Delta T{{P}_{Tj}}+E*\Delta SOS+F*\Delta EOS\ldots +\varepsilon \end{align}$ (6)
where ∆EVI refers to the first-difference time series of EVI, ATj, BTj, CTj, and DTj are the respective regression coefficient values for ∆Tmax, ∆Tmin, ∆Tm, and ∆TP in different previous months, E and F are the regression coefficient values for ∆SOS and ∆EOS, respectively, and ε is the residual term, indicating the influence of other factors on crop growth. The multiple linear regression determination coefficient R2 was used to express the degree of explanation of the different climate factors. The significance level was p < 0.10.

2.3.4 Grain production risk assessment under different temperature rise targets

Global average temperature is predicted to rise by 1.5℃ by 2029 and 2.0℃ by 2040. Therefore, the time periods of 2019‒2038 and 2030‒2049 were selected for the global temperature rise of 1.5℃ and 2.0℃ in a food production risk assessment (Schleussner et al., 2016; Wu et al., 2019). To obtain the measured spatial total grain output in the reference period, the grain output was spatialized through the agricultural planting range in the black soil area, based on the total grain output of the county (district) from the statistical yearbook data for the different years (Luo et al., 2020). The δ interpolation method was then used to correct the simulated grain output by a systematic error elimination (Hay et al., 2000).
${{X}_{s}}=\left( \overline{{{X}_{s}}}-\overline{{{X}_{o}}} \right)+{{X}_{o}}$
where Xs is the corrected total grain output in the future period, $\overline{{{X}_{s}}}$ is the total grain output of the original simulation in the future period, $\overline{{{X}_{o}}}$ is the total grain output of the original simulation in the reference period, and Xo is the measured total grain output in the reference period. Finally, the degree of change (Q) of the corrected total grain output in the future period relative to the reference period was taken as the evaluation index of grain production risk. According to the disaster reduction requirements (Deng et al., 2002), any year with a 2% or 5% reduction in grain production was defined as a poor or disaster year, respectively. In addition, for the increase in total grain production in the future (i.e., Q≥1), the standard deviation method was applied to identify accurately the regional differentiation characteristics of future grain production.
$Q={{Y}_{t}}/{{Y}_{0}}$
$\left\{ \begin{matrix} Q\ge 1\ \ \ \ \ \ \ \ \ \ \ \ \ \text{Risk}\ \text{free} \\ 0.98\le Q<1\ \ \ \ \ \ \ \ \text{Low}\ \text{risk}\left( \text{III} \right) \\ 0.95\le Q<0.98\ \ \ \ \ \ \text{Medium}\ \text{risk}\left( \text{II} \right) \\ Q<0.95\ \ \ \ \ \ \ \ \ \ \text{High}\ \text{risk}\left( \text{I} \right) \\ \end{matrix} \right.$
$\left\{ \begin{array}{*{35}{l}} Q\ge {{{\bar{Q}}}_{1}}+\frac{1}{2}{{\sigma }_{1}}\text{ Slight}\ \text{increase}\left( \text{IV} \right) \\ {{{\bar{Q}}}_{1}}-\frac{1}{2}{{\sigma }_{1}}\le Q<{{{\bar{Q}}}_{1}}+\frac{1}{2}{{\sigma }_{1}}\text{ Obvious}\ \text{increase}\left( \text{V} \right) \\ Q<{{{\bar{Q}}}_{1}}-\frac{1}{2}{{\sigma }_{1}}\text{ Significant}\ \text{increase}\left( \text{VI} \right) \\ \end{array} \right.$
where Q represents the degree of change in future grain output, Yt is the grain output in the future period (1.5℃ or 2.0℃), Y0 is the grain output in the reference period, ${{\bar{Q}}_{1}}~$and σ1 represent the average output and the standard deviation of the total grain output, respectively, in the future when Q≥1.

2.2.5 Drought risk assessment under different temperature rise targets

The drought risk assessment method proposed by Wu et al. (2018) was used to calculate the drought risk index of the northeast black soil region during the period of global temperature rise of 1.5℃ and 2.0℃, based on the comprehensive meteorological drought index. First, according to the value of the comprehensive meteorological drought index, three categories of mild, moderate, and severe drought were established. Second, when each drought category persisted for more than 10 consecutive days, it was recorded as a (mild, moderate, or severe) drought process. Finally, the frequency of the different types of drought was calculated to determine the drought risk index by an overlay analysis.
${{H}_{C,i}}=\left\{ \begin{matrix} 1\ \ {{f}_{C,i}}\ge T \\ \frac{{{f}_{C,i}}}{T}\text{ }{{f}_{C,i}}<T \\ \end{matrix} \right.$
where HC,i is the probability of drought, fC,i is the frequency of drought process, i is the category of drought, and T is the number of years.

3 Results

3.1 Climate change characteristics and phenological dynamics

The annual average temperature in the black soil area of northeast China fluctuated significantly during 2000-2017 (Figure 2). Specially, the average temperature gradually increased from 2000 to 2007, fluctuated from 2008 to 2011, and then increased again after 2012, with a rate of increase of about 0.24℃/a (p = 0.11). In contrast, the precipitation in this area displayed a significant increasing trend from 2000 to 2017, with a rate of increase of 8.28 mm/a (p = 0.02), but it decreased significantly after 2012 (Figure 2a). Generally, the seasonal climate change was consistent with the annual average change, but there were also temporal differences, with the maximum, minimum, and annual average temperatures increasing rapidly in spring from 2012 to 2017, and decreasing significantly in autumn (Figures 2b-2e). In terms of the spatial pattern, from 2000 to 2017, the annual precipitation across 59.57% of the black soil area in northeast China displayed a significant increasing trend, with a rapid increase in annual precipitation (above 9 mm/a) occurring in 30.23% of the whole area. The increase was mainly distributed in Qiqihar, Suihua, Baicheng, and Changchun in the Songnen black soil sub-region and the northern part of the Sanjiang black soil sub-region. The average annual temperature in 52.07% of the whole area fluctuated and decreased, with the decrease mainly concentrated in the northern, central, and eastern parts of the Songnen black soil sub-region (Figure 3).
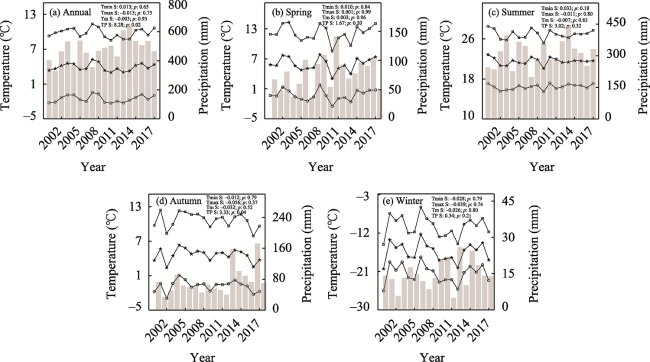
Figure 2 Trends in the annual and seasonal precipitation and average temperature in the black soil region of northeast China from 2000 to 2017
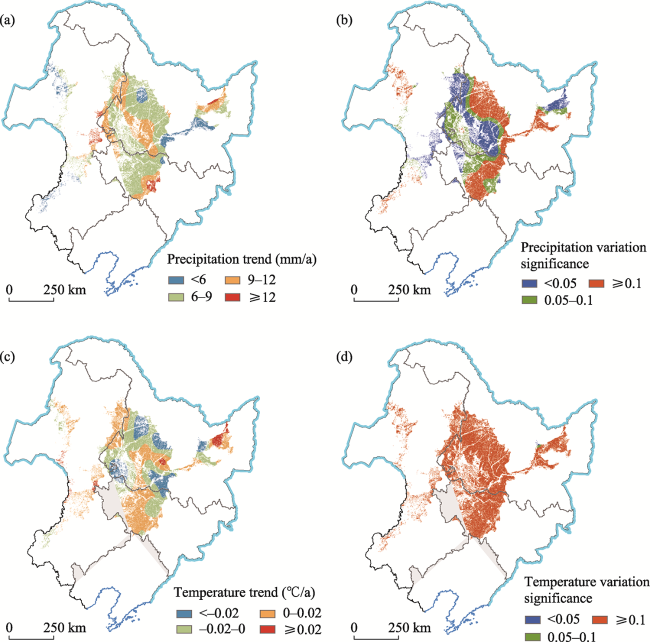
Figure 3 Spatial variation of the annual precipitation and average temperature in the black soil region of northeast China from 2000 to 2017
As seen in Figure 4, the average crop SOS in the black soil area of northeast China was DOY 147 (May 27) and the average crop EOS was DOY 265 (September 25) during 2000-2017. These SOS, and EOS values were consistent with the seedling emergence and maturity times of the main crops from the 79 agrometeorological observation sites of three provinces in northeast China (Li et al., 2011). Spatially, the SOS in the north and east of the Songnen black soil sub-region and the Sanjiang black soil sub-region was mainly between DOY 150 and 160, and the EOS was generally earlier than DOY 270. In comparison, the SOS in the southwest of the Songnen black soil sub-region and the eastern Inner Mongolia black soil sub-region was earlier and the EOS was slightly later (Figures 4a and 4b).
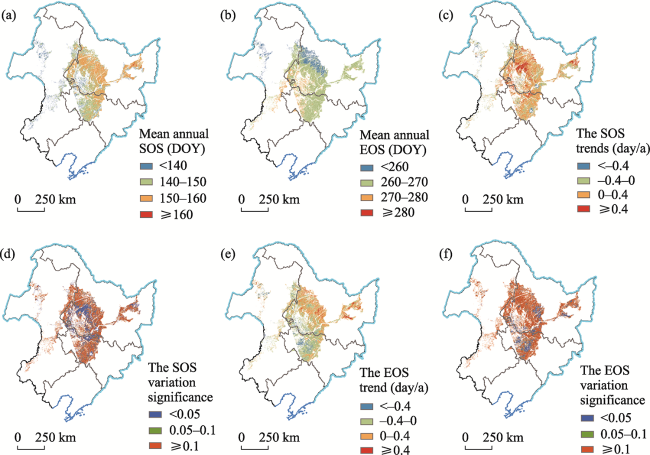
Figure 4 Spatial variation of the mean annual SOS, EOS and their trends in the black soil region of northeast China during 2000-2017
Figure 4 also shows the spatial distributions of the SOS and EOS linear trends for 2000-2017. From 2000 to 2017, most of the black soil area of northeast China experienced delaying SOS trends (68.25% of whole area), of which 43.60% of the whole area displayed a significant trend (p < 0.10), mainly in Qiqihar, Suihua, the north central area of Harbin, the west of Baicheng, and the northeast of Songyuan. Only 8.01% of the black soil area indicated a significantly advanced SOS, with a sporadic advance over the southeast and northwest regions (Figures 4c and 4d). In contrast, about 58.36% of the whole area (the significant area being about 16.71%) displayed an advanced EOS trend, especially in Baicheng, Songyuan, Siping, and Changchun in the Songnen black soil sub-region, with an advance rate of 0.4 days/a. However, our results also indicated a delayed EOS in the northeast of the black soil area, accounting for about 8.95% of the total area (Figure 4e and 4f).

3.2 Response of crop phenology to climate change and the impact on productivity

Figure 5 shows the spatial distribution of the temporal correlations between the SOS and climate factors in the black soil region of northeast China. In general, the SOS was significantly positively correlated with the precipitation in T2 and T3 on the northern edge of the Songnen black soil sub-region and the central and southern regions. The SOS in the Sanjiang black soil sub-region and the central of Qiqihar, Suihua black soil region, and was significantly positively correlated with the precipitation in T1, and the SOS generally had a negative correlation with the precipitation in T2 and T3 in the eastern Inner Mongolia black soil sub-region (Figures 5a and 5b). The average temperature had a significant negative correlation with the SOS in the Sanjiang black soil sub-region and the north and south of the Songnen black soil sub-region. However, the lag time of the Sanjiang black soil sub-region was concentrated in the T0 and T1 periods, which was earlier than that of the Songnen black soil sub-region (T2 and T3). There was a positive correlation between the SOS and average temperature in some parts of the eastern Inner Mongolia black soil sub-region and Songnen black soil sub-region (Figures 5c and 5d). The response of the SOS to the minimum and maximum temperatures was basically consistent with the response to the average temperature, but the minimum temperature at T0 was mostly negatively correlated with the SOS in the northwest of the Songnen black soil sub-region and the eastern Inner Mongolia black soil sub-region (Figures 5e-5h).
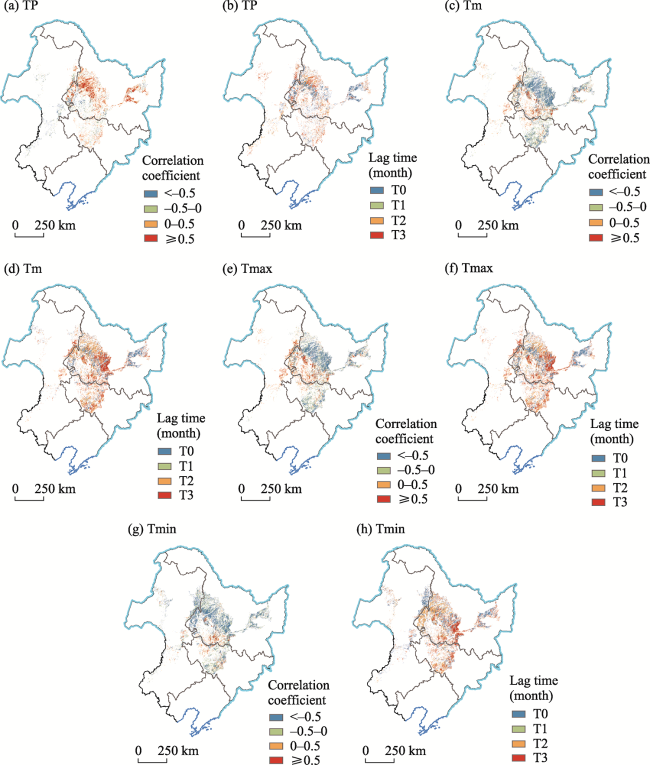
Figure 5 Spatial distribution of the significant lag responses of the SOS to climate variables in the black soil region of northeast China during 2000-2017 (p < 0.10)
The EOS in the west of the Sanjiang black soil sub-region, the north and middle of the Songnen black soil sub-region, and the east of the Inner Mongolia black soil sub-region was positively correlated with precipitation, but the lag time displayed an advancing trend from T3 to T0 and T1. The EOS was negatively correlated with precipitation in T3 in the south of the Songnen black soil sub-region (Figures 6a and 6b). In terms of temperature, from the northeast to the southwest, the relationship between the average and maximum temperatures and EOS in the black soil area of northeast China gradually changed from negative to positive, and the lag time changed from T3 to T2. There was an obvious spatial heterogeneity in the correlation between the change in minimum temperature and the EOS. The EOS was negatively correlated with minimum temperature in T3 in the middle of the Songnen black soil sub-region and Sanjiang black soil sub-region, but there was a positive relationship in the north and south of the Songnen black soil sub-region and eastern Inner Mongolia black soil sub-region, mainly in T0 and T1 (Figures 6c-6h).
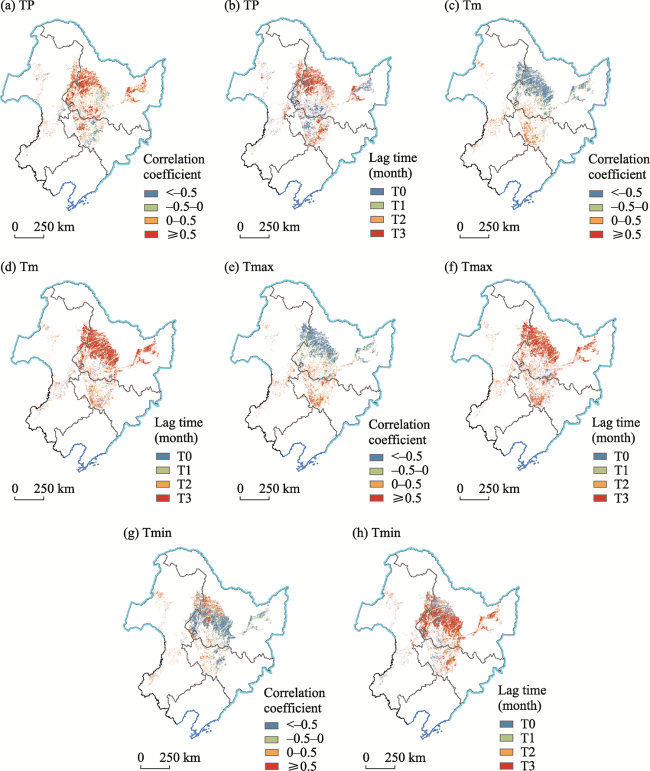
Figure 6 Spatial distribution of the significant lag responses of the EOS to climate variables in the black soil region of northeast China during 2000-2017 (p <0.10)
As shown in Figure 7, there were large spatial differences in the ability of climate change and crop phenology to predict crop productivity in the black soil area of northeast China. Climate change and crop phenological variation could significantly explain crop productivity in 57.69% of the whole area, with a predictive ability of 50%-80% and more than 80% in 39.77% and 17.92% of the whole area, respectively. The strongest predictive ability was mainly distributed in the Songnen and Sanjiang black soil sub-regions, to the west of the Songyuan—Suihua line (Figures 7a and 7b). In contrast, the area in which climate change could predict crop productivity in the same period was only 31.18% of the whole area and was concentrated in the Songnen black soil sub-region, including Baicheng, Songyuan, Daqing, the south of Qiqihar, and the southeast of the eastern Inner Mongolia black soil sub-region. The areas with a predictive ability of 50%-80% and more than 80% were reduced by 41.90% and 95.20%, respectively (Figures 7c and 7d). Additionally, climate change in T1 showed no marked improvement in terms of its ability to predict crop productivity, with the predictive area decreasing by about 0.52% (Figures 7e and 7f).
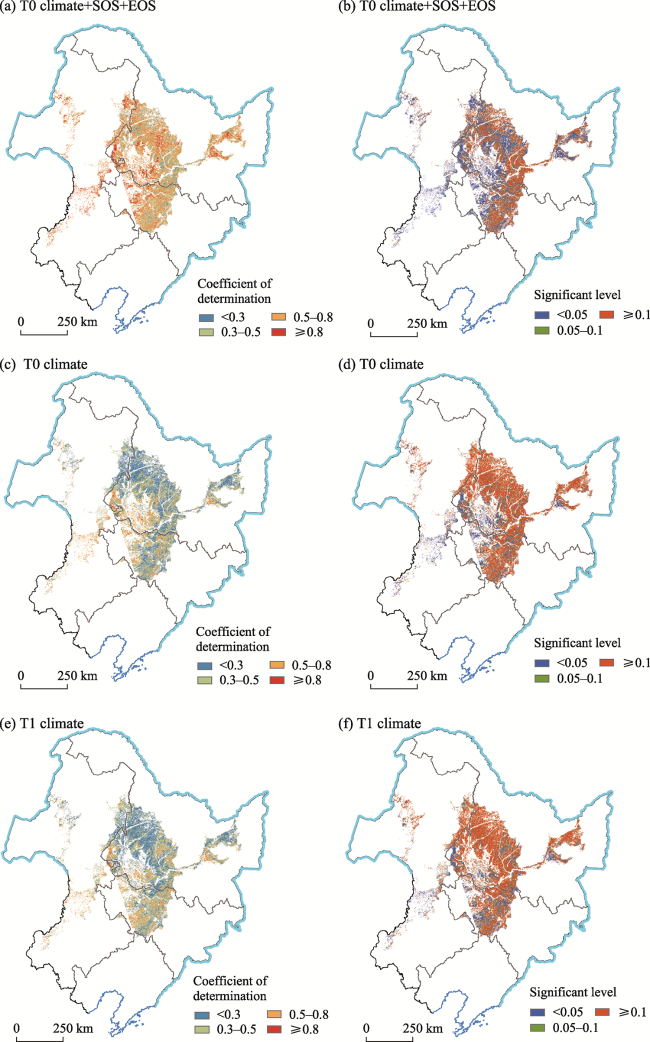
Figure 7 Spatial distribution of the determination coefficient for the relationships between vegetation productivity and climatic variables, the SOS, and the EOS in the black soil region of northeast China from 2000 to 2017

3.3 Grain production risk assessment under different temperature rise targets

The corrected simulation results for grain production in the northeast black soil region showed that the average annual total grain production was about 54 million tons from 1991 to 2010, and the high-yield areas were mainly concentrated in the middle of the Sanjiang black soil sub-region and the east and west of the Songnen black soil sub-region (Figure 8a).
Figure 8 Spatial distribution of total grain yield (a, b, c) and grain production risk (d, e) in the black soil region of northeast China
Under the RCP 8.5 scenario, when the global temperature increased by 1.5℃, the annual average total grain production exceeded 60 million tons (Figure 8b). Compared with the reference period, grain production displayed a decreasing trend in the south and an increasing trend in the north. Grain production in the eastern Inner Mongolia black soil sub-region, the northern Songnen black soil sub-region, and the western Sanjiang black soil sub-region increased substantially. The grain production risk areas were mainly distributed in the southern edge of the Songnen black soil sub-region, where the maximum grain production reduction was close to 5% (Figure 8d). When the global temperature increased by 2.0℃, the annual average total grain production exceeded 67 million tons, which was about 7% and 24% higher than the production under a temperature rise of 1.5℃ and the reference period, respectively. The spatial distribution of the grain output was basically consistent with the current period (Figure 8c). Additionally, the decrease in the south and increase in the north in the grain production pattern became more obvious. The area of increase in grain production in the eastern Inner Mongolia black soil sub-region, the north of the Songnen black soil sub-region, and the west of the Sanjiang black soil sub-region expanded substantially. There was a high risk to grain production in the southern edge of the Songnen black soil sub-region, with the maximum reduction in grain production close to 10%. The medium risk area extended to most areas south of the Songhua River (Figure 8e).
Under the future climate change scenarios, the north of China displayed a warming and wetting trend, while the south displayed a warming and drying trend (Gao et al., 2020). Northeast China had a warming and wetting trend, with the mismatch of water and heat resources potentially having adverse effects on agricultural production (Chu et al., 2017). In the reference period, the drought risk was high in the middle of the region and low in the east and west. The areas with high risk-index values were mainly distributed in the west of the Songnen black soil sub-region and the southeast of the eastern Inner Mongolia black soil sub-region. The second highest drought risk occurred to the east of the Songnen black soil sub-region, while the lowest drought risk index values occurred in the Sanjiang black soil sub-region and the north of the eastern Inner Mongolia black soil sub-region (Figure 9a).
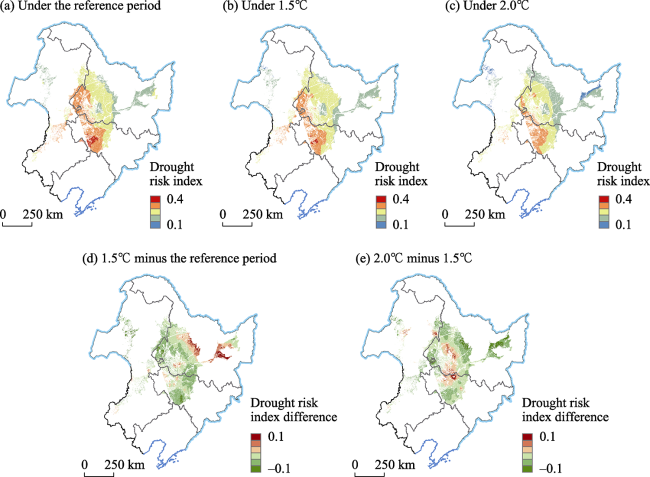
Figure 9 Spatial distribution of drought hazard (a, b, c) and its variation (d, e) in the black soil region of northeast China
Under the RCP 8.5 scenario, when the global temperature increased by 1.5 ℃, the distribution of the drought risk index in the northeast black soil region was basically consistent with that of the reference period (Figure 9b), but the risk index of the central and western parts of the Songnen black soil sub-region increased greatly, and the risk index in the southwest and northwest parts of the Songnen black soil sub-region and the southeastern part of the eastern Inner Mongolia black soil sub-region decreased (Figure 9d). When the global temperature increased by 2.0℃, the overall distribution of the drought risk index in the northeast black soil region was basically the same as that in the previous two periods (Figure 9c). Compared with the risk under the 1.5℃ temperature rise, when the global temperature increased by 2.0℃, the risk index values in the central part of the Songnen black soil sub-region and the north of the eastern Inner Mongolia black soil sub-region increased significantly, whereas the risk index values for the central and western parts of the Songnen black soil sub-region and the northeast of the Sanjiang and Songnen black soil sub-regions decreased substantially (Figure 9e).

4 Discussion

4.1 Characteristics of the crop response to climate change

From 2000 to 2017, the average temperature in the black soil area of northeast China fluctuated sharply, with a stagnation in the warming phenomenon that was relatively consistent with the global change, and then the temperature rose again rapidly, at a rate above the average level (0.10℃/a) of the northwest region from 2012 to 2019 (Li et al., 2020). The annual precipitation in this area decreased significantly after 2012, and the warming and drying trend should be a serious concern. With the warming and drying of the climate, about 30% of the whole area experienced a significant delay to the SOS (p < 0.10), while only 8.01% of the whole area experienced a significant advance in the SOS. Some studies have shown that the start of the vegetation growth season in the northern hemisphere was only 0.2 days earlier from 2000 to 2008, which was about 92.31% less than that in 1982-1999 (Jeong et al., 2011), and the beginning of the winter wheat growth season in north China was obviously delayed from 1999 to 2013. The delay was about 4.3 days/10a (Liu et al., 2017), which was consistent with our results. The SOS in most areas in the north and south of the northeast black soil region was positively correlated with precipitation in the previous months, and negatively correlated with the average temperature and maximum/minimum temperature in the previous months, which was related to the hydrothermal situation and its variation. The average temperature in northeast China is relatively low, and the precipitation decreased over an arc-shaped area from the northwest to southeast. Precipitation in eastern Inner Mongolia, western Jilin, and southwest Heilongjiang is very scarce (Wu et al., 2021). The northern and southern parts of the region are cold but have relatively abundant precipitation. In these areas the temperature rise in the early stage promoted an early SOS, while the increase in precipitation in this stage resulted in a decrease in sunshine intensity and temperature to a certain extent, which led to a growth delay (Shen et al., 2015). In contrast, in eastern Inner Mongolia, western Jilin, and southwest Heilongjiang, where the precipitation is relatively low, early warming may cause drought and inhibit crop growth (Piao et al., 2015). From 2000 to 2017, there was an advance in the EOS, in 58.36% of the whole area, in the black soil region. This finding differed from the results of previous studies and may be related to the study period (Yang et al., 2017a). Yang et al. (2015) reported that, compared with the 1980s, the delaying trend in the EOS in northern China in the 2000s had weakened, and some regions displayed an advancing trend. The relationships between the EOS and precipitation and temperature were generally the opposite, which also reflected the interactive effect of water and temperature on crop growth in the climate change sensitive area. The positive correlation between the EOS and minimum temperature in the north of the black soil area may be related to low temperature stress (Yang et al., 2017b).
Climate change plays an important role in crop production. Previous studies have reported that, compared with the 1980s, the contribution rate of climate change to the rice yield in Heilongjiang Province in the 1990s was 23.2%-28.8% (Fang et al., 2004), and for the corn yield in the Songnen Plain it was 26.78% (Wang et al., 2007). In the North China Plain, the overall contribution rate of climate variables to the corn yield in the past 30 years was about 15%-30% (Xiao and Tao, 2016). Our results found that the average ability of climate change to predict agricultural production in the black soil region of northeast China was about 36.31%, which was relatively consistent with these studies. The differences may be related to the study period and regional scope. As important points in the vegetation growth period, the SOS and EOS are not only affected by climate change but also have an important effect on vegetation physiological processes and photosynthetic production capacity (Wang et al., 2020). The combined consideration of climate change and crop phenology can effectively improve the ability to predict crop productivity. The predictive ability of the combination of both factors increased by 70.23% and the predictive area expanded by 85.04% compared with that of climate change in the growing season period, which was a useful approach to establish a large-scale crop yield estimation model.

4.2 Risk prediction for grain production and coping strategies

In recent decades, with the variations in the regional climate and resource conditions, the planting area and output of the major grain crops, such as rice, wheat, and corn, in the black soil area of northeast China have shown an increasing trend (Li et al., 2016; Hu et al., 2019). Based on the perspective of climate change—food production—future risk, we adopted the gradual climate change risk assessment method (Wu et al., 2019) and introduced the δ interpolation method to correct the simulated grain production. The use of this method comprehensively identified the grain production variation characteristics under different temperature rises. Compared with the approaches taken in previous studies, this method had a clear objectives, high reliability, and strong operability characteristics. In addition, a joint consideration of the 1.5 and 2.0℃ global warming targets was considered instructive to identify the possible risks faced by grain production in this region (Guo et al., 2017; Pu et al., 2020). The planting area of rice, wheat, corn, and other major grain crops in the northeast black soil region seemed uneven. Rice planting was mainly concentrated in the middle and east of the Songnen and Sanjiang black soil sub-regions. Wheat was mainly planted in the north of the Songnen and eastern Inner Mongolia black soil sub-regions. The planting area of corn basically covered the northeast black soil region. Under the warming and wetting variation, the rice and wheat outputs were likely to be stable or to increase slightly, but the corn yield will decrease with the temperature rise, especially in the Songnen black soil sub-region where corn is planted intensively. Climate change and extreme events may have a more adverse impact on corn production, and further strengthening agricultural climate resources assessment, constructing agricultural infrastructure, and vigorously developing resilient agriculture to cope with future climate change will be required.
Generally, based on multiple sources of data, including climate data, remote sensing products, and statistical yearbooks, this study comprehensively investigated the phenological response characteristics and potential risks of crop production, but there were some uncertainties. First, although land use masking was used to eliminate the interference of land use change as much as possible, the potential impact of land use changes and mixed pixels could not be avoided. Second, although the EVI product with a high spatio-temporal resolution had certain advantages in accurately describing crop phenological characteristics in the black soil region of northeast China, the length of these time series was still limited. In addition, the global climate and crop models would also result in some uncertainty in grain prediction estimation. Multi-mode ensemble research should be conducted and the impact of crop varieties, planting patterns, irrigation, fertilization, and agricultural technology and management should be comprehensively investigated to develop climate change adaptation measures.

5 Conclusions

Based on the whole chain of climate change—phenological response—productivity dynamics—risk assessment, the cascade effect of climate change on agricultural production and the future grain production risk in the black soil region of northeast China were systematically investigated. With global climate change, precipitation in this region significantly increased from 2000 to 2017, but the average annual temperature revealed a stagnation in the warming phenomenon that was consistent with the global data from 2000 to 2011. There was a widespread advance in the SOS and the EOS was delayed. The SOS was positively correlated with precipitation, and negatively correlated with the average temperature in the previous months, but the lag time for temperature was much longer. The EOS was more closely related to climate change in previous months, and the relationship had a spatial differentiation from south to north. The predictive ability of climate change alone, in the period corresponding to crop production, was very limited and the combined consideration of climate change and phenological variation effectively improved the predictive ability, which may be useful for crop yield predictions. Under the RCP8.5 scenario, the total grain productivity displayed an upward trend, but the risk to grain production increased in the south and decreased in the north, and risk area expanded. When the global temperature rise was 2.0℃, the maximum reduction in grain productivity in the south of the Songnen black soil sub-region was close to 10%. There is an urgent need to develop regional climate change adaptation measures to ensure food production security.
[1]
Ari G, Bao Y B, Asi H et al., 2021. Impact of global warming on meteorological drought: A case study of the Songliao Plain, China. Theoretical and Applied Climatology, 146: 1315-1334.

DOI

[2]
Arnell N W, Lowe J A, Challinor A J et al., 2019. Global and regional impacts of climate change at different levels of global temperature increase. Climatic Change, 155(3): 377-391.

DOI

[3]
Byers E, Gidden M, Leclère D et al., 2018. Global exposure and vulnerability to multi-sector development and climate change hotspots. Environmental Research Letters, 13(5): 055012.

DOI

[4]
Chen J, Liu Y J, Pan T et al., 2020. Global socioeconomic exposure of heat extremes under climate change. Journal of Cleaner Production, 277: 123275.

DOI

[5]
Chu Z, Guo J P, Zhao J F, 2017. Impacts of future climate change on agroclimatic resources in Northeast China. Journal of Geographical Sciences, 27(9): 1044-1058.

DOI

[6]
Delincé J, Ciaian P, Witzke H P, 2015. Economic impacts of climate change on agriculture: The AgMIP approach. Journal of Applied Remote Sensing, 9(1): 097099.

DOI

[7]
Deng G, Wang A S, Zhou Y S et al., 2002. Geographical distribution of China’s grain yield risk area. Journal of Natural Resources, 17(2): 210-215. (in Chinese)

[8]
Fang X Q, Wang Y, Xu T et al., 2004. Contribution of climate warming to rice yield in Heilongjiang Province. Acta Geographica Sinica, 59(6): 820-828. (in Chinese)

DOI

[9]
Fujimori S, Hasegawa T, Krey V et al., 2019. A multi-model assessment of food security implications of climate change mitigation. Nature Sustainability, 2(5): 386-396.

DOI

[10]
Gao J B, Liu L L, Wu S H, 2020. Hazards of extreme events in China under different global warming targets. Big Earth Data, 4(2): 153-174.

DOI

[11]
Guo E L, Liu X P, Zhang J Q et al., 2017. Assessing spatiotemporal variation of drought and its impact on maize yield in Northeast China. Journal of Hydrology, (553): 231-247.

[12]
Guo L H, Gao J B, Hao C Y et al., 2019. Winter wheat green-up date variation and its diverse response on the hydrothermal conditions over the North China Plain, using MODIS time-series data. Remote Sensing, 11(13): 1593.

DOI

[13]
Hay L E, Wilby R L, Leavesley G H, 2000. A comparison of delta change and downscaled GCM scenarios for three mountainous basins in the United States. Journal of the American Water Resources Association, 36(2): 387-397.

DOI

[14]
He B, Wu J J, Lu A F et al., 2013. Quantitative assessment and spatial characteristic analysis of agricultural drought risk in China. Natural Hazards, 66(2): 155-166.

DOI

[15]
Hou P, Liu Y E, Liu W M et al., 2021. Quantifying maize grain yield losses caused by climate change based on extensive field data across China. Resources, Conservation and Recycling, 174: 105811.

DOI

[16]
Hu Y N, Fan L L, Liu Z H et al., 2019. Rice production and climate change in Northeast China: Evidence of adaptation through land use shifts. Environmental Research Letters, 14(2): 024014.

DOI

[17]
Jeong S J, Ho C H, Gim H J et al., 2011. Phenology shifts at start vs. end of growing season in temperate vegetation over the Northern Hemisphere for the period 1982-2008. Global Change Biology, 17(7): 2385-2399.

DOI

[18]
Jiang R, He W T, Zhou W et al., 2019. Exploring management strategies to improve maize yield and nitrogen use efficiency in northeast China using the DNDC and DSSAT models. Computers and Electronics in Agriculture, 166: 104988.

DOI

[19]
Kukal M S, Irmak S, 2018. Climate-driven crop yield and yield variability and climate change impacts on the U.S. Great Plains agricultural production. Scientific Reports, 8: 3450.

DOI PMID

[20]
Lam H M, Remais J, Fung M C et al., 2013. Food supply and food safety issues in China. The Lancet, 381(9882): 2044-2053.

DOI

[21]
Leng G Y, Hall J, 2019. Crop yield sensitivity of global major agricultural countries to droughts and the projected changes in the future. Science of The Total Environment, 654: 811-821.

DOI

[22]
Li H, Feng W T, He X H et al., 2017. Chemical fertilizers could be completely replaced by manure to maintain high maize yield and soil organic carbon (SOC) when SOC reaches a threshold in the Northeast China Plain. Journal of Integrative Agriculture, 16(4): 937-946.

DOI

[23]
Li Z, Ding Y J, Chen A J et al., 2020. Characteristics of warming hiatus of the climate change in Northwest China from 1960 to 2019. Acta Geographica Sinica, 75(9): 1845-1859. (in Chinese)

DOI

[24]
Li Z G, Tan J Y, Tang P Q et al., 2016. Spatial distribution of maize in response to climate change in northeast China during 1980-2010. Journal of Geographical Sciences, 26(1): 3-14.

DOI

[25]
Li Z G, Tang H J, Yang P et al., 2011. Identification and application of seasonality parameters of crop growing season in Northeast China based on NDVI time series data. Acta Scientiarum Naturalium Universitatis Pekinensis, 47(5): 882-892. (in Chinese)

[26]
Lin Y M, Feng Z M, Wu W X et al., 2017. Potential impacts of climate change and adaptation on maize in Northeast China. Agronomy Journal, 109(4): 1476-1490.

DOI

[27]
Lin Y M, Wu W X, Ge Q S, 2015. CERES-Maize model-based simulation of climate change impacts on maize yields and potential adaptive measures in Heilongjiang Province, China. Journal of the Science of Food and Agriculture, 95(14): 2838-2849.

DOI PMID

[28]
Liu B, Asseng S, Muller C et al., 2016. Similar estimates of temperature impacts on global wheat yield by three independent methods. Nature Climate Change, 6(12): 1130.

DOI

[29]
Liu B, Martre P, Ewert F et al., 2018. Global wheat production with 1.5 and 2.0℃ above pre-industrial warming. Global Change Biology, 25(4): 1428-1444.

DOI

[30]
Liu B Y, Zhang G L, Xie Y et al., 2021. Delineating the black soil region and typical black soil region of northeastern China. Chinese Science Bulletin, 66(1): 96-106. (in Chinese)

[31]
Liu J, Wang B, Cane M A et al., 2013. Divergent global precipitation changes induced by natural versus anthropogenic forcing. Nature, 493(7434): 656-659.

DOI

[32]
Liu M H, Xu X, Jiang Y et al., 2020. Responses of crop growth and water productivity to climate change and agricultural water-saving in arid region. Science of The Total Environment, 703: 134621.

DOI

[33]
Liu Z J, Wu C Y, Liu Y S et al., 2017. Spring green-up date derived from GIMMS3g and SPOT-VGT NDVI of winter wheat cropland in the North China Plain. ISPRS Journal of Photogrammetry and Remote Sensing, (130): 81-91.

[34]
Liu Z J, Yang X G, Wang W F et al., 2009. Characteristics of agricultural climate resources in three provinces of Northeast China under global climate change. Chinese Journal of Applied Ecology, 20(9): 2199-2206. (in Chinese)

[35]
Luo Y C, Zhang Z, Li Z Y et al., 2020. Identifying the spatiotemporal changes of annual harvesting areas for three staple crops in China by integrating multi-data sources. Environmental Research Letters, 15(7): 074003.

DOI

[36]
Lv S, Yang X G, Lin X M et al., 2015. Yield gap simulations using ten maize cultivars commonly planted in Northeast China during the past five decades. Agricultural and Forest Meteorology, 205: 1-10.

DOI

[37]
Lv Y J, Wang Y J, Wang L C et al., 2019. Straw return with reduced nitrogen fertilizer maintained maize high yield in Northeast China. Agronomy, 9(5): 229.

DOI

[38]
Osborne T, Rose G, Wheeler T, 2013. Variation in the global-scale impacts of climate change on crop productivity due to climate model uncertainty and adaptation. Agricultural and Forest Meteorology, 170: 183-194.

DOI

[39]
Piao J L, Chen W, Chen S F et al., 2021. Mean states and future projections of precipitation over the monsoon transitional zone in China in CMIP5 and CMIP6 models. Climatic Change, 169(3): 35.

DOI

[40]
Piao S L, Tan J G, Chen A P et al., 2015. Leaf onset in the northern hemisphere triggered by daytime temperature. Nature Communications, (6): 6911.

[41]
Pu L M, Zhang S W, Yang J C et al., 2020. Assessing the impact of climate changes on the potential yields of maize and paddy rice in Northeast China by 2050. Theoretical and Applied Climatology, 140(1/2): 167-182.

DOI

[42]
Ray D K, West P C, Clark M et al., 2019. Climate change has likely already affected global food production. Plos One, 14(5): e0217148.

DOI

[43]
Rosenzweig C, Elliott J, Deryng D et al., 2013. Assessing agricultural risks of climate change in the 21st century in a global gridded crop model intercomparison. Proceedings of the National Academy of Sciences of the United States of America, 111(9): 3268-3273.

[44]
Schleussner C F, Lissner T K, Fischer E M et al., 2016. Differential climate impacts for policy-relevant limits to global warming: The case of 1.5℃ and 2℃. Earth System Dynamics, 7(2): 327-351.

DOI

[45]
Shen M G, Piao S L, Cong N et al., 2015. Precipitation impacts on vegetation spring phenology on the Tibetan Plateau. Global Change Biology, 21(10): 3647-3656.

DOI PMID

[46]
Su Y, Gabrielle B, Makowski D, 2021. The impact of climate change on the productivity of conservation agriculture. Nature Climate Change, 11(7): 628-633.

DOI

[47]
Sun T, Li Z Z, 2019. Alfalfa-corn rotation and row placement affects yield, water use, and economic returns in Northeast China. Field Crops Research, 241: 107558.

DOI

[48]
Wang X Y, Zhou Y K, Wen R H et al., 2020. Mapping spatiotemporal changes in vegetation growth peak and the response to climate and spring phenology over Northeast China. Remote Sensing, 12(23): 3977.

DOI

[49]
Wang Z M, Song K S, Li X Y et al., 2007. Effects of climate change on yield of maize in maize zone of Songnen Plain in the past 40 years. Journal of Arid Land Resources and Environment, 21(9): 112-117. (in Chinese)

[50]
Wu C Y, Hou X H, Peng D L et al., 2016. Land surface phenology of China’s temperate ecosystems over 1999-2013: Spatial-temporal patterns, interaction effects, covariation with climate and implications for productivity. Agricultural and Forest Meteorology, (216): 177-187.

[51]
Wu J H, Sheng Z L, Du J Q et al., 2021. Spatiotemporal change patterns of temperature and precipitation in Northeast China from 1956 to 2017. Research of Soil and Water Conservation, 28(3): 340-347, 415. (in Chinese)

[52]
Wu S H, Liu L L, Gao J B et al., 2019. Integrate risk from climate change in China under global warming of 1.5 and 2.0°C. Earth’s Future, 7(12): 1307-1322.

DOI

[53]
Wu S H, Liu L L, Liu Y H et al., 2018. Geographical patterns and environmental change risks in terrestrial areas of the Belt and Road. Acta Geographica Sinica, 73(7): 1214-1225. (in Chinese)

DOI

[54]
Xiao D P, Tao F L, 2016. Contributions of cultivar shift, management practice and climate change to maize yield in North China Plain in 1981-2009. International Journal of Biometeorology, 60(7): 1111-1122.

DOI PMID

[55]
Xiao D P, Zhang Y, Bai H Z et al., 2021. Trends and climate response in the phenology of crops in Northeast China. Frontiers in Earth Science, (9): 811621.

[56]
Xiong W, Asseng S, Hoogenboom G et al., 2020. Different uncertainty distribution between high and low latitudes in modelling warming impacts on wheat. Nature Food, 1(1): 63-69.

DOI

[57]
Xiong W, Holman I, Lin E et al., 2012. Untangling relative contributions of recent climate and CO2 trends to national cereal production in China. Environmental Research Letters, 7(4): 044014.

DOI

[58]
Xu X Z, Xu Y, Chen S C et al., 2010. Soil loss and conservation in the black soil region of Northeast China: A retrospective study. Environmental Science & Policy, 13(8): 793-800.

[59]
Yang B, He M H, Shishov V et al., 2017a. New perspective on spring vegetation phenology and global climate change based on Tibetan Plateau tree-ring data. Proceedings of the National Academy of Sciences of the United States of America, 114(27): 6966-6971.

DOI PMID

[60]
Yang Y T, Guan H D, Shen M G et al., 2015. Changes in autumn vegetation dormancy onset date and the climate controls across temperate ecosystems in China from 1982 to 2010. Global Change Biology, 21(2): 652-665.

DOI PMID

[61]
Yang Z Y, Shen M G, Jia S G et al., 2017b. Asymmetric responses of the end of growing season to daily maximum and minimum temperatures on the Tibetan Plateau. Journal of Geophysical Research: Atmospheres, 122 (24): 13278-13287.

[62]
You N S, Dong J W, Huang J X et al., 2021. The 10-m crop type maps in Northeast China during 2017-2019. Scientific Data, 8(1): 1-11.

DOI

[63]
Zhang H, Zhou G S, Liu D L et al., 2019. Climate-associated rice yield change in the Northeast China Plain: A simulation analysis based on CMIP5 multi-model ensemble projection. Science of The Total Environment, 666: 126-138.

DOI

[64]
Zhang Y, Xiao X M, Wu X C et al., 2017. A global moderate resolution dataset of gross primary production of vegetation for 2000-2016. Scientific Data, (4): 170165.

[65]
Zhang Y, Zhao Y X, Sun Q, 2021. Increasing maize yields in Northeast China are more closely associated with changes in crop timing than with climate warming. Environmental Research Letters, 16(5): 054052.

DOI

[66]
Zhao C, Liu B, Piao S L et al., 2017. Temperature increase reduces global yields of major crops in four independent estimates. Proceedings of the National Academy of Sciences of the United States of America, 114(35): 9326-9331.

DOI PMID

Outlines

/