Imbalance of inter-provincial forest carbon sequestration rate from 2010 to 2060 in China and its regulation strategy

  • CAI Weixiang , 1, 2 ,
  • XU Li 2 ,
  • LI Mingxu 2 ,
  • SUN Osbert Jianxin 1 ,
  • HE Nianpeng 2, 3, 4
Expand
  • 1. School of Ecology and Nature Conservation, Beijing Forestry University, Beijing 100083, China
  • 2. Key Laboratory of Ecosystem Network Observation and Modeling, Institute of Geographic Sciences and Natural Resources Research, CAS, Beijing 100101, China
  • 3. University of Chinese Academy of Sciences, Beijing 100049, China
  • 4. Center for Ecological Research, Northeast Forestry University, Harbin 150040, China
*He Nianpeng, PhD and Professor, E-mail:

Cai Weixiang, Master, specialized in ecosystem carbon cycles and regulatory mechanisms. E-mail:

Received date: 2021-11-15

  Accepted date: 2022-04-21

  Online published: 2023-01-16

Supported by

National Natural Science Foundation of China(42141004)

National Natural Science Foundation of China(32171544)

National Natural Science Foundation of China(31988102)

Copyright

© 2023

Abstract

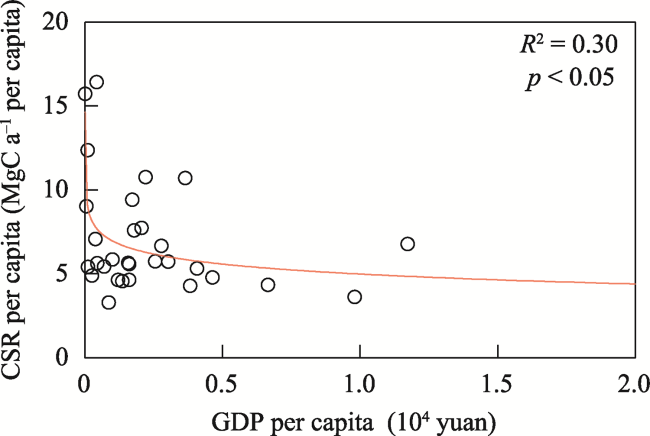
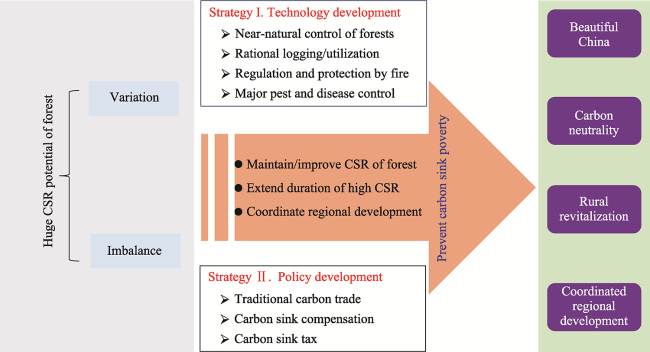
Forest ecosystem, as a predominant component of terrestrial ecosystems in view of carbon sinks, has a high potential for carbon sequestration. Accurately estimating the carbon sequestration rate in forest ecosystems at provincial level, is a prerequisite and basis for scientifically formulating the technical approaches of carbon neutrality and the associated regulatory policies in China. However, few researches on future carbon sequestration rates (CSRs) for Chinese forest ecosystems for provincial-level regions (hereafter province) have been reported, especially for forest soils. In this study, we quantitatively assessed the carbon sequestration rates of existing forest ecosystems of all the provinces from 2010 to 2060 using the Forest Carbon Sequestration model (FCS), in combination with large quantities of field-measured data in China under three future climate scenarios (RCP2.6, RCP4.5, and RCP8.5). Results showed that CSRs across provinces varied from 0.01 TgC a-1 to 36.74 TgC a-1, with a mean of 10.09 ± 0.43 TgC a-1. Inter-provincial differences have been observed in forest CSRs. Regarding the spatial variations in CSRs on a unit area basis within provinces, the eastern region provinces have a larger capacity for sequestration than the western region, while the western region has greater CSR per unit GDP and per capita. Moreover, there are significant negative correlations between the CSRs per capita in each province and the corresponding GDP per capita, under the assumption that GDP per capita is constant in the future across provinces. In summary, there is a significant regional imbalance in CSR among provinces. Special technological and policy interventions are required to realize carbon sink potential sustainably. An overlap in China’s poorer areas and areas with stronger carbon sinks has indicated that existing policies to support traditional carbon trading are insufficient. Regulatory measures such as “regional carbon compensation” must be adopted urgently in line with the Chinese characteristics, so that people in western or underdeveloped regions can consciously strengthen forest protection and enhance forest carbon sinks through coordinated regional development while ensuring that China’s forests play a greater role in carbon neutrality strategies.

Cite this article

CAI Weixiang , XU Li , LI Mingxu , SUN Osbert Jianxin , HE Nianpeng . Imbalance of inter-provincial forest carbon sequestration rate from 2010 to 2060 in China and its regulation strategy[J]. Journal of Geographical Sciences, 2023 , 33(1) : 3 -17 . DOI: 10.1007/s11442-023-2071-4

1 Introduction

Forests store 45% of the terrestrial carbon, playing an important role in the carbon cycle of terrestrial ecosystems (Bonan, 2008; Fang et al., 2014; Wen and He, 2016; He et al., 2017). Therefore, accurate estimates the temporal and spatial distribution and dynamics of forest carbon sinks under climate change have become increasingly important for the scientific exploration of Earth systems, along with biological conservation and natural resource management (Luo et al., 2020).
In 2020, a new national strategy was launched in China to reach its peak total CO2 emissions before 2030 and achieve carbon neutrality before 2060 to combat global climate change. To achieve carbon neutrality, it is important for industries to reduce emissions. It is important to improve carbon sinks in forests, grasslands and croplands by strengthening spatial planning and management of land use, as well as by effectively harnessing the carbon sequestration capacity of these ecosystems. According to the ninth national forest inventory, China’s forest covering 22.96% of its land area, 33% of which are young forests (National Forestry and Grassland Administration, 2019). Earlier studies have indicated that China’s forest vegetation has great potential for sustainable carbon sequestration from 2010 to 2050 (Xu et al., 2010; Ma and Wang, 2011; Hu et al., 2015; He et al., 2017; Tang et al., 2018; Yao et al., 2018; He et al., 2019; Wang et al., 2020). Besides quantifying the carbon sequestration capacity of forest ecosystems at the national scale, managers also need to obtain scientific information from each province regarding its forests’ spatio-temporal dynamics. Such information could aid in carbon reduction and in the implementation of carbon neutrality action guidelines more effectively (Ma and Wang, 2011). Firstly, assessing the carbon sequestration potential of forest ecosystems enables provinces to understand their own carbon sink situation, making it easier for them to draft appropriate afforestation/reforestation and carbon reduction policies. Secondly, it also provides an opportunity for inter-provincial coordination, and to make carbon sink compensation policies based on the differences and imbalances in carbon sequestration potential among provinces. However, previous studies focused only on one or a few provinces (Chen et al., 2018; Chen et al., 2019; Wu et al., 2020), and the exploration of inter-provincial forest CSRs at the national scale from 2010-2060 has not been reported.
In this study, we used a forest carbon sequestration (FCS) model based on a classical logistic equation to evaluate the CSRs of forest among provinces (Data for Hong Kong, Macao, and Taiwan were not included) in China under three future climate scenarios (RCP 2.6, 4.5, and 8.5). The main objectives of this study were to identify the: (1) CSRs of existing forests among provinces in China from 2010-2060; (2) regional difference and imbalance in the carbon sequestration potential of forest ecosystems among provinces. Through the quantitative analysis of inter-provincial forest ecosystem carbon sinks and their regional imbalance, we discuss forest sink enhancement at the level of technology and policy. We also discuss regional carbon sink integration and provide guidelines for national and provincial policymakers on forest protection, management, afforestation/reforestation and other strategies of carbon sink enhancement. Through this, we hope for the gradual integration of regional carbon sinks and sustainable development.

2 Materials and methods

2.1 Description of the model

Considering the complexity of forest ecosystem carbon cycle mechanism, and the data to support model building and validation, as well as initial model parameters need to be obtained from a large amount of measured data. Most forest carbon cycle models are parameterized or validated by gross primary productivity (GPP), net primary productivity (NPP) or net ecosystem productivity (NEP) from flux observations. Forest age is rarely taken into account, resulting in fewer climate-driven models being able to predict forest carbon sequestration rates (Cao and Woodward, 1998).
Here, we used a forest carbon sequestration (FCS) model on the basis of a classical logistic equation between forest age and biomass, which is parameterized and validated by large volumes of vegetation data from field surveys in China (He et al., 2017). The FCS model was established by measuring carbon sink data and forest age from more than 3300 sample plots of the Chinese Academy of Sciences Carbon Special Project as input parameters. The model was validated by data from 78 forest successions in China and combined with important factors such as temperature, precipitation and forest age. The construction, validation and predictions of the FCS model have been published in previous studies (He et al., 2017; Yan et al., 2020; Cai et al., 2022), making it possible to assess the carbon sequestration of forest ecosystems or afforestation in China rapidly and accurately. The model’s construction and operation process are briefly described below. A detailed description can be found in previous studies (He et al., 2017).

2.2 Vegetation and soil carbon cycles

With forest development, forest biomass gradually reaches a relative equilibrium state. The relationship between vegetation biomass and forest age can be portrayed using a logistic growth equation (Figure 1) (Xu et al., 2010). Vegetation biomass can be calculated by (1):
${{B}_{t}}=\frac{{{B}_{\max }}}{1+\left( \frac{{{B}_{\max }}}{{{B}_{{{t}_{0}}}}}-1 \right)\cdot {{e}^{-{{v}_{0}}\cdot (t-{{t}_{0}})}}}$
where Bt is the forest vegetation biomass (Mg ha-1); V0 is the intrinsic growth rate, representing the maximum growth rate (%) when vegetative growth is not limited by the environment, nutrients, or disturbances; Bmax is the maximum vegetation biomass under the mature forest scenario (Mg ha-1); and t is the forest age (a).
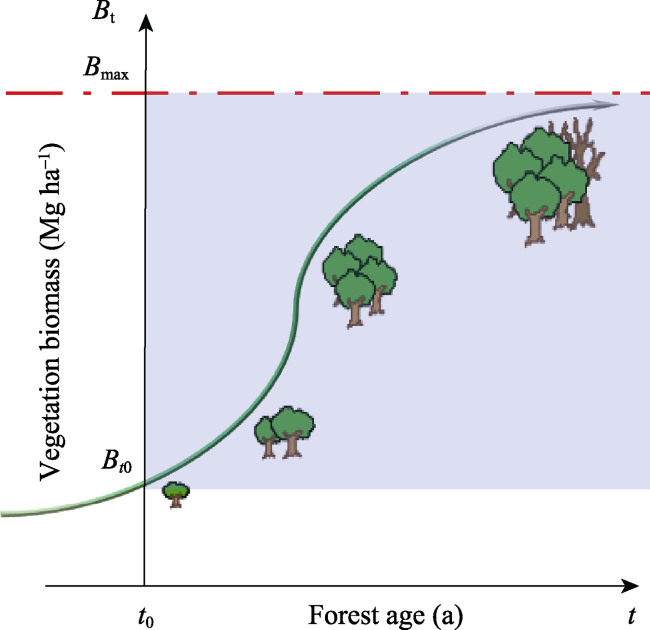
Figure 1 The secondary succession theory (Foundation of FCS model) presented the relationship between vegetation biomass and forest age (He et al., 2017). Bt, vegetation biomass (Mg ha-1); Bmax, maximum vegetation biomass; t, forest age (a); and Bto, vegetation biomass at t = t0.
Annual variation in soil carbon stocks is calculated by the annual input of organic matter minus the annual decomposition, which is the classical double pool of soil carbon cycle. When forest factors are relatively stable, the humification and mineralization processes will tend to balance the SOC level, as shown in (2):
${{C}_{\text{t}}}=\frac{{{I}_{t}}}{{{k}_{2}}}-\left( \frac{{{I}_{t}}}{{{k}_{2}}}-{{C}_{{{t}_{0}}}} \right)\cdot \exp (-{{k}_{2}}\cdot (t-{{t}_{0}})$
where Ct is the SOC density (MgC ha-1); It is the annual input of SOC (Mg ha-1 a-1); It = h (k1 Lt), Lt is the litter content (Mg ha-1); k1 is the litter decomposition coefficient; k2 is the SOC decomposition rate (a-1); and h is the decay coefficient (0.3) (Foley, 1995).

2.3 Existing forest data

The main parameters of the FCS model are the initial vegetation biomass (B0), stand age (t), mean annual temperature (MAT, ℃), and mean annual precipitation (MAP, mm). The data for the existing forest vegetation biomass were obtained from the field survey of the “Strategic Priority Research Program of the Chinese Academy of Sciences” (XDA05050000), including the initial vegetation biomass, forest age, litter, and 0-20 cm SOC content in 3365 forest sample plots in China, which are the same as the special features of Proceedings of the National Academy of Sciences of the USA in 2018 (Tang et al., 2018) They included deciduous broadleaf forests (DBF, 806 plots), deciduous needle-leaved forests (DNF, 197 plots), evergreen broadleaf forests (EBF, 620 plots), evergreen needle-leaved forests (ENF, 1461 plots), and mixed needle-leaved and broadleaf forests (NBF, 281 plots). The plots were each 0.1 hm2, and vegetation biomass was calculated by the relevant allometric equation using diameter at breast height and tree height (ECSP, 2015).
Climate data, including the mean annual temperature (MAT, ℃) and mean annual precipitation (MAP, mm), were obtained from the National Climate Center (http://ncc.cma.gov.cn/cn/), and simulated using the Regional Climate Model system (RegCM 4.0).The data was then output (spatial resolution of 1° × 1°) through one-way nesting of the Beijing Climate Center_Climate System Model Version 1.1 (BCC_CSM1.1) (Gao et al., 2012).

2.4 Supplementary data

Population and gross domestic product (GDP) per capita data for each provincial-level region (Data for Hong Kong, Macao, and Taiwan were not included) were derived from China Statistical Yearbook 2020 (http:/www.stats.gov.cn/tjsj/ndsj/), and the CSR per capita and CSR per economic was calculated for each provincial-level region (Data for Hong Kong, Macao, and Taiwan were not included).

2.5 Statistical analysis

A coefficient of 0.5 had been used to transfer biomass to carbon density (Yu et al., 2014). First, the tool ‘Extract Multi Values to Points’ in ArcMap was used to extract MAT and MAP of each site under future climate scenarios, and the future carbon sequestration capacity of forest ecosystems in each provincial-level region (hereafter province) of China was predicted by FCS model. The changes in carbon density or CSR of vegetation and soil were calculated for every 10 from 2010-2060. The results were represented as averages of three future climate scenarios. Meanwhile, in order to meet the targets of carbon peaking in 2030 and carbon neutrality in 2060, the period 2010-2030 and 2030-2060 were used in the data processing for the analysis.
The spatial distributions of the forests and their carbon densities were mapped using ArcMap 10.2 (ESRI, Redlands, CA, USA). The data were analyzed and plotted on graphs using SPSS 25.0 (IBM Corp., Chicago, IL, USA) and Origin 2018 (Origin Lab, Northampton, MA, USA).

3 Results

3.1 CSR in Chinese forests by province from 2010 to 2060

Forest ecosystems in different Chinese provinces are predicted to have the capacity to sequester carbon from 2010-2060 under different climate scenarios, with keep the existing forest area constant. The vegetation CSR varied between <0.01 TgC a-1 (Shanghai) and 25.67 ± 0.91 TgC a-1 (Heilongjiang Province) (Table 1). Soil CSR varied between <0.01 TgC a-1 (Shanghai) and 15.36 ± 0.94 TgC a-1 (Yunnan Province) (Table 2). Overall, the CSRs in forest ecosystems over the next 50 years were the largest in Heilongjiang Province (36.74 ± 1.35 TgC a-1) and the smallest in Shanghai (<0.01 TgC a-1). The carbon sequestration potential of forest ecosystems in most provinces varied significantly during the period, which caused inter-provincial differences in CSRs (Table 3).
Table 1 Annual changes of vegetation carbon sequestration rate in Chinese forests by provincial-level region from 2010 to 2060
Provincial-
level region
Forest area
(104 km2)
CSR of forest vegetation (TgC a-1)
2010-2020 2020-2030 2030-2040 2040-2050 2050-2060 Mean±SD
Anhui 3.12 4.96±0.22a 4.79±0.30a 3.39±0.57b 2.53±0.55b 1.24±0.78c 3.38±0.11
Beijing 0.44 0.73±0.02ab 0.83±0.04a 0.66±0.08b 0.51±0.08c 0.21±0.1d 0.59±0.01
Chongqing 3.46 2.58±0.07ab 2.95±0.20a 2.92±0.23a 2.33±0.11b 1.47±0.41c 2.45±0.07
Fujian 8.33 12.32±0.58a 11.36±0.79a 8.07±1.44b 6.34±1.43bc 4.80±2.06c 8.58±0.26
Gansu 2.1 0.64±0.04a 0.73±0.13a 0.77±0.21a 0.83±0.16a 1.01±0.37a 0.79±0.05
Guangdong 10.67 11.82±0.35a 14.23±0.92b 12.19±0.97a 10.08±1.04a 6.26±1.8c 10.91±0.29
Guangxi 12.58 10.76±0.21a 11.31±0.84a 9.8±1.00a 7.58±0.36b 6.94±1.46b 9.28±0.29
Guizhou 6.27 0.81±0.06a 1.63±0.24ab 2.15±0.37b 1.76±0.17b 1.25±0.98ab 1.52±0.17
Hainan 0.92 0.65±0.05a 0.74±0.04b 0.62±0.05a 0.51±0.02c 0.42±0.07c 0.59±0.03
Hebei 3.97 6.41±0.25ab 7.36±0.40b 6.27±0.73ab 5.02±0.92b 2.70±1.09c 5.55±0.12
Heilongjiang 19.77 34.89±0.49a 34.04±0.96a 27.11±2.15b 19.42±1.80c 12.87±3.32d 25.67±0.91
Henan 2.07 2.98±0.06a 3.10±0.19a 2.36±0.20b 1.73±0.15c 0.25±0.36d 2.08±0.06
Hubei 6.21 8.62±0.09a 7.93±0.62a 5.51±0.52b 3.87±0.20c 4.29±0.71c 6.04±0.18
Hunan 8.87 9.73±0.10ab 11.75±0.64c 10.70±0.71bc 9.56±0.83ab 8.98±1.17a 10.15±0.15
Inner Mongolia 16.26 18.75±0.93ab 22.19±1.54b 20.17±2.69ab 18.36±3.99ab 16.00±4.22b 19.09±0.40
Jiangsu 0.31 0.50±0.02a 0.48±0.02a 0.43±0.03b 0.30±0.03c 0.42±0.01b 0.43±0.00
Jiangxi 9.78 10.45±0.37a 12.29±0.68a 10.80±1.24a 9.88±1.46a 6.31±1.98b 9.94±0.25
Jilin 8.33 15.93±0.24a 15.87±0.44a 12.77±0.67b 8.41±0.71c 5.56±1.32d 11.71±0.40
Liaoning 5.57 8.12±0.06a 9.72±0.26a 9.51±0.80a 8.60±1.41a 6.16±1.27b 8.42±0.18
Ningxia 0.07 0.03±0.00a 0.03±0.00a 0.04±0.01a 0.03±0.01a 0.04±0.02a 0.03±0.00
Qinghai 0.29 0.05±0.00a 0.07±0.03ab 0.10±0.04ab 0.14±0.04b 0.14±0.05b 0.10±0.01
Shaanxi 5.92 6.23±0.12a 6.28±0.37a 5.41±0.43b 4.12±0.18c 2.48±0.65d 4.91±0.13
Shandong 1.83 2.21±0.10a 2.86±0.19a 2.86±0.36a 2.79±0.57a 2.27±0.58a 2.60±0.04
Shanghai 1.31×10⁻⁴ <0.01a <0.01a <0.01a <0.01a <0.01a <0.01
Shanxi 2.49 2.56±0.06a 3.55±0.25b 3.19±0.28b 2.66±0.25a 1.82±0.38c 2.76±0.05
Sichuan 14.11 2.65±0.04a 3.45±1.21ab 5.63±2.13ab 6.92±1.54b 6.59±3.31b 5.05±0.45
Tianjin 0.03 0.04±0.00ab 0.05±0.00b 0.05±0.01b 0.05±0.01ab 0.03±0.01a 0.05±0.00
Xizang 8.49 2.39±0.27a 3.01±0.76ab 4.10±1.32ab 4.90±1.56b 4.26±1.05ab 3.73±0.07
Xinjiang 2.48 0.22±0.02a 0.28±0.10a 0.40±0.10a 0.34±0.28a 0.60±0.69a 0.37±0.14
Yunnan 18.99 7.14±0.13a 6.84±2.74a 9.58±3.99a 7.23±2.93a 4.91±2.03b 7.14±0.10
Zhejiang 6.06 8.14±0.43a 8.47±0.66a 6.75±1.13ab 5.57±1.26bc 3.62±1.57c 6.51±0.18
Total 189.79 193.32±3.35 208.2±11.48 184.27±21.62 152.39±20.79 113.91±30.45 170.42±4.52

Change in carbon sequestration rate was presented as mean ± 1 standard deviation on invariable forest area and three climate scenarios (RCP2.6, RCP4.5, and RCP8.5), and the same small letters indicate no significant difference in carbon sequestration rates among different periods at p = 0.05 level.

Table 2 Annual changes of soil carbon sequestration rate in Chinese forests by provincial-level region from 2010 to 2060
Provincial-
level region
Forest area
(104 km2)
CSR of forest soil (TgC a-1)
2010-2020 2020-2030 2030-2040 2040-2050 2050-2060 Mean±SD
Anhui 3.12 2.45±0.05ab 3.62±0.12c 3.48±0.22c 2.92±0.43b 2.05±0.30a 2.90±0.03
Beijing 0.44 0.05±0.00a 0.36±0.02c 0.45±0.03d 0.42±0.07cd 0.26±0.04b 0.31±0.01
Chongqing 3.46 2.13±0.03a 3.06±0.09b 3.64±0.11c 3.6±0.19c 3.13±0.16b 3.11±0.01
Fujian 8.33 4.06±0.14a 7.18±0.30b 7.21±0.53b 6.29±1.17b 4.70±0.78a 5.89±0.08
Gansu 2.1 1.21±0.04a 1.46±0.10ab 1.45±0.13ab 1.55±0.21b 1.73±0.19b 1.48±0.01
Guangdong 10.67 4.89±0.08a 9.47±0.29bc 10.74±0.35d 10.21±1.09cd 8.57±0.43b 8.78±0.10
Guangxi 12.58 5.91±0.09a 9.87±0.34b 11.33±0.44d 10.99±0.63cd 10.28±0.48bc 9.67±0.07
Guizhou 6.27 3.91±0.09a 4.36±0.17a 4.44±0.18a 4.34±0.39a 4.33±0.42a 4.28±0.02
Hainan 0.92 0.90±0.00a 0.95±0.02b 0.95±0.02b 0.87±0.03a 0.76±0.03c 0.89±0.00
Hebei 3.97 1.13±0.06a 3.79±0.16bc 4.68±0.29d 4.46±0.68cd 3.22±0.44b 3.46±0.05
Heilongjiang 19.77 1.18±0.53a 13.32±0.70b 16.56±1.25c 14.14±1.44b 10.18±0.83d 11.08±0.47
Henan 2.07 1.61±0.01a 2.46±0.06b 2.49±0.08b 2.16±0.18c 1.72±0.12a 2.09±0.01
Hubei 6.21 5.60±0.03a 7.54±0.21b 7.11±0.18c 5.93±0.31a 4.35±0.08d 6.11±0.04
Hunan 8.87 2.92±0.03a 7.22±0.23b 9.05±0.28cd 9.45±0.82c 8.57±0.31d 7.44±0.10
Inner Mongolia 16.26 1.33±0.24a 9.6±0.49b 13.58±1.07c 14.78±2.90c 14.07±1.84c 10.67±0.22
Jiangsu 0.31 0.11±0.01a 0.27±0.00b 0.33±0.01c 0.29±0.02b 0.38±0.01d 0.28±0.00
Jiangxi 9.78 6.61±0.09a 9.69±0.26b 10.48±0.50b 10.33±1.21b 7.88±0.75c 9.00±0.11
Jilin 8.33 2.74±0.06a 7.75±0.13b 8.78±0.30c 6.82±0.63d 4.77±0.28e 6.17±0.12
Liaoning 5.57 2.55±0.02a 3.70±0.07b 5.76±0.37cd 6.28±0.95c 5.15±0.47d 4.69±0.08
Ningxia 0.07 0.01±0.00a 0.03±0.00b 0.04±0.00c 0.04±0.01cd 0.05±0.01d 0.03±0.00
Qinghai 0.29 <0.01a 0.02±0.01a 0.04±0.02a 0.09±0.04b 0.10±0.02b 0.05±0.00
Shaanxi 5.92 4.14±0.03a 6.16±0.14b 6.85±0.19c 6.45±0.27b 5.46±0.25d 5.81±0.01
Shandong 1.83 0.17±0.03a 0.35±0.06a 1.48±0.15b 1.90±0.41b 1.68±0.27b 1.12±0.03
Shanghai 1.31×10⁻⁴ <0.01a <0.01a <0.01a <0.01a <0.01a <0.01
Shanxi 2.49 1.06±0.01a 2.32±0.09b 2.78±0.12c 2.72±0.25c 2.40±0.12b 2.26±0.02
Sichuan 14.11 6.51±0.20a 7.15±0.76a 8.09±1.18ab 9.84±1.69b 9.90±1.78b 8.30±0.08
Tianjin 0.03 0.01±0.00a 0.03±0.00b 0.04±0.00c 0.04±0.01c 0.03±0.01bc 0.03±0.00
Xizang 8.49 2.53±0.06a 2.66±0.36a 3.43±0.64a 4.84±1.08b 4.93±0.56b 3.68±0.08
Xinjiang 2.48 0.74±0.04a 1.65±0.02b 1.58±0.08b 1.36±0.34ab 1.52±0.84b 1.37±0.20
Yunnan 18.99 18.72±4.64a 16.63±2.08ab 15.08±1.95ab 14.56±2.66ab 11.8±1.10b 15.36±0.94
Zhejiang 6.06 5.46±0.11a 7.37±0.24b 7.39±0.47b 6.60±0.92b 4.93±0.69a 6.35±0.05
Total 189.79 90.64±4.20 150.03±5.32 169.32±9.25 164.30±19.38 138.90±9.99 142.64±0.54

Change in carbon sequestration rate was presented as mean ± 1 standard deviation on invariable forest area and three climate scenarios (RCP2.6, RCP4.5, and RCP8.5), and the same small letters indicate no significant difference in carbon sequestration rates among different periods at p = 0.05 level.

Table 3 Annual changes of ecosystem carbon sequestration rate in Chinese forests by provincial-level region from 2010 to 2060
Provincial-
level region
Forest area
(104 km2)
CSR of forest ecosystem (TgC a-1)
2010-2020 2020-2030 2030-2040 2040-2050 2050-2060 Mean±SD
Anhui 3.12 7.41±0.28ab 8.41±0.41b 6.87±0.79a 5.44±0.98c 3.28±1.08d 6.28±0.11
Beijing 0.44 0.78±0.02a 1.19±0.05b 1.11±0.11bc 0.93±0.15ac 0.47±0.14d 0.90±0.01
Chongqing 3.46 4.71±0.10a 6.02±0.29b 6.56±0.34b 5.93±0.29b 4.60±0.57a 5.56±0.07
Fujian 8.33 16.38±0.71ab 18.55±1.07b 15.28±1.97ab 12.63±2.61bc 9.49±2.83c 14.47±0.23
Gansu 2.1 1.85±0.08a 2.19±0.23ab 2.21±0.34ab 2.38±0.36ab 2.74±0.56b 2.27±0.05
Guangdong 10.67 16.71±0.43a 23.69±1.21b 22.93±1.32bc 20.3±2.13c 14.83±2.23a 19.69±0.22
Guangxi 12.58 16.66±0.29a 21.17±1.17b 21.13±1.43b 18.57±0.95a 17.22±1.93a 18.95±0.27
Guizhou 6.27 4.72±0.15a 5.99±0.40ab 6.59±0.55b 6.11±0.55ab 5.58±1.39ab 5.80±0.17
Hainan 0.92 1.54±0.05a 1.69±0.05b 1.58±0.07ab 1.38±0.05c 1.18±0.09d 1.48±0.03
Hebei 3.97 7.54±0.31ab 11.15±0.56c 10.95±1.02c 9.48±1.61bc 5.91±1.53a 9.01±0.12
Heilongjiang 19.77 36.07±0.63a 47.36±1.66b 43.67±3.39b 33.57±3.22a 23.05±4.11c 36.74±1.35
Henan 2.07 4.59±0.07a 5.56±0.25b 4.85±0.28a 3.89±0.32c 1.97±0.47d 4.17±0.06
Hubei 6.21 14.23±0.11a 15.47±0.84b 12.61±0.69c 9.80±0.50d 8.64±0.77e 12.15±0.16
Hunan 8.87 12.65±0.12a 18.97±0.87b 19.75±0.98b 19.02±1.65b 17.55±1.42b 17.59±0.10
Inner
Mongolia
16.26 20.08±1.16a 31.79±2.02b 33.74±3.76b 33.15±6.89b 30.07±6.03b 29.77±0.42
Jiangsu 0.31 0.61±0.03a 0.76±0.02b 0.76±0.04b 0.59±0.05a 0.80±0.00b 0.70±0.00
Jiangxi 9.78 17.06±0.46ab 21.97±0.94c 21.28±1.74c 20.21±2.68bc 14.19±2.72a 18.94±0.24
Jilin 8.33 18.67±0.30a 23.62±0.57b 21.55±0.96c 15.23±1.34d 10.32±1.58e 17.88±0.48
Liaoning 5.57 10.68±0.07a 13.42±0.32bc 15.27±1.17c 14.87±2.36c 11.32±1.73a 13.11±0.21
Ningxia 0.07 0.04±0.00a 0.06±0.01ab 0.08±0.01bc 0.08±0.01bc 0.09±0.03c 0.07±0.00
Qinghai 0.29 0.05±0.01a 0.09±0.04a 0.13±0.06ab 0.23±0.08b 0.24±0.07b 0.15±0.01
Shaanxi 5.92 10.37±0.15a 12.44±0.51b 12.26±0.62b 10.57±0.43a 7.94±0.89c 10.72±0.13
Shandong 1.83 2.38±0.12a 3.21±0.25ab 4.33±0.51bc 4.7±0.97bc 3.95±0.84c 3.71±0.05
Shanghai 1.31×10⁻⁴ <0.01a <0.01a <0.01a <0.01a <0.01a <0.01
Shanxi 2.49 3.61±0.07a 5.87±0.33b 5.98±0.39b 5.38±0.50b 4.21±0.48a 5.01±0.03
Sichuan 14.11 9.17±0.16a 10.60±1.97ab 13.72±3.30ab 16.76±3.17b 16.50±5.09b 13.35±0.48
Tianjin 0.03 0.05±0.00a 0.08±0.01b 0.09±0.01b 0.09±0.02b 0.07±0.02ab 0.08±0.00
Xizang 8.49 4.92±0.34a 5.67±1.12a 7.52±1.96ab 9.74±2.58b 9.19±1.57b 7.41±0.03
Xinjiang 2.48 0.96±0.04a 1.93±0.12a 1.98±0.18a 1.71±0.62a 2.12±1.53a 1.74±0.34
Yunnan 18.99 25.86±4.71a 23.47±3.78a 24.66±5.67a 21.80±5.59a 16.72±3.09b 22.50±0.99
Zhejiang 6.06 13.60±0.54ab 15.84±0.89b 14.14±1.60ab 12.17±2.18a 8.55±2.26c 12.86±0.19
Total 189.79 283.96±3.39 358.23±16.67 353.59±30.73 316.69±40.12 252.81±40.39 313.06±4.72

Change in carbon sequestration rate was presented as mean ± 1 standard deviation on invariable forest area and three climate scenarios (RCP2.6, RCP4.5, and RCP8.5), and the same small letters indicate no significant difference in carbon sequestration rates among different periods at p = 0.05 level.

3.2 Changes in CSR per unit area of forests among provinces

Compared with the 2030-2060 period, CSR per unit area of the forest ecosystem in Chinese provinces larger varied from 2010-2030 (Figure 2). The provinces in the northwest (Xinjiang, Tibet, Qinghai) and southwest (Yunnan and Guizhou) had smaller changes in forest CSR per unit area (0.32-2.15 MgC ha-1 a-1), while the provinces in the eastern region are larger (Jiangsu and Anhui) (3.05-3.83 MgC ha-1 a-1). The result revealed that the per capita CSR of provinces varied from 0.01-1.50 MgC a-1 per capita in the 2010-2030 period, and from 0.01-2.52 MgC a-1 per capita in the 2030-2060 period (Figure 3), with significant differences among provinces.
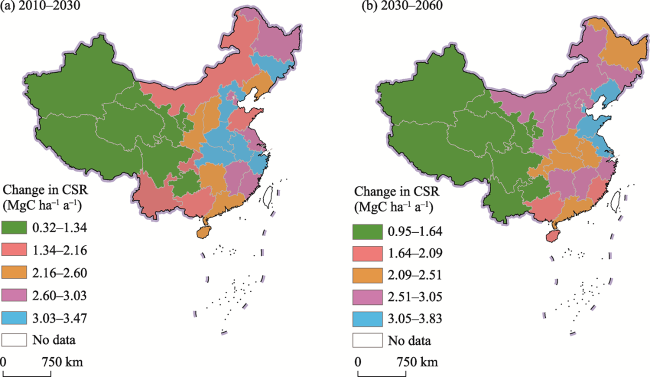
Figure 2 Changes in carbon sequestration rates (CSR) per unit area of forest by province at different periods. Panel a is the period of 2010-2030 and panel b is 2030-2060. Note: This figure has been prepared based on the standard map provided by the Ministry of Natural Resources of the People’s Republic of China, which can be found on the service website (GS (2019)1698). The base map was not modified.
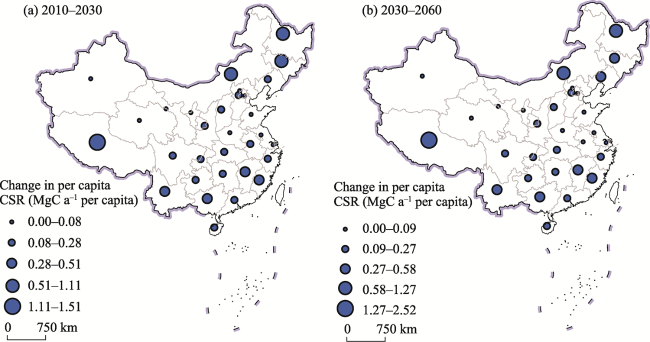
Figure 3 Annual changes in per capita carbon sequestration rate (CSR) among provinces from 2010-2030 (a) and 2030-2060 (b). Note: This figure has been prepared based on the standard map provided by the Ministry of Natural Resources of the People’s Republic of China, which can be found on the service website (GS (2019)1698). The base map was not modified.
Overall, provinces such as Tibet, Inner Mongolia, Heilongjiang and Jilin showed higher CSRs per unit of economic whereas the more economically developed cities on the eastern coast have lower CSRs (Figure 4).
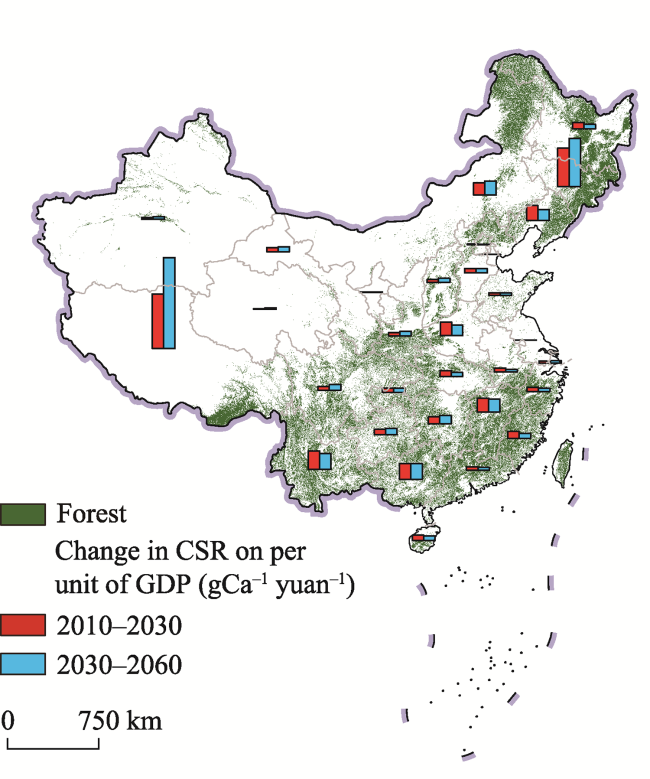
Figure 4 Changes in forest carbon sequestration rate (CSR) on per unit of GDP among provinces. Note: This figure has been prepared based on the standard map provided by the Ministry of Natural Resources of the People’s Republic of China, which can be found on the service website (GS (2019)1698). The base map was not modified.
There are significant negative correlations between the CSR per capita of each province and its GDP per capita. Provinces such as Heilongjiang and Inner Mongolia have a higher CSR per capita, while more developed ones (such as Beijing, Shanghai, Jiangsu and Tianjin) are lower (Figure 5).
Figure 5 Relationship between per capita forest carbon sequestration rate and GDP per capita at provincial level in China

4 Discussion

4.1 Significant differences in forest carbon sequestration potential among provinces

During the 2010-2060 period, results show a large regional imbalance in the CSR between provinces in China, with the CSR of forest vegetation varying between 0.01 and 25.67 TgC a-1 and that of soil varying 0.01-15.36 TgC a-1 among provinces. The CSR in forest ecosystems was the largest in Heilongjiang Province (36.74 ± 1.35 TgC a-1) and the smallest in Shanghai (<0.01 TgC a-1). This is closely related to economic development and climatic conditions in each province. Economic development inevitably comes at the risk of damaging current forests, while climatic conditions determine whether forests are suitable for growth.
The results estimating the CSR of forest vegetation at the national scale differed significantly from earlier studies (Xu et al., 2010; Pan et al., 2011; Fang et al., 2014; Hu et al., 2015), but were similar to the results of recent studies (Tang et al., 2018; Yao et al., 2018). Varying data sources and methodologies are important reasons for the differences. None of the earlier studies at the national scale have systematically estimated CSRs of forest ecosystems in Chinese provinces under future climate scenarios, especially for soil. More importantly, most earlier studies estimated forest CSR at the national scale without providing inter-provincial data clearly (Xu et al., 2017; 2018a; 2018b; 2019), which made it impossible for us to compare between provinces. Regarding methodology, the FCS model was based on a classical logistic equation to establish the relationship between forest age and biomass, and was parameterized and validated using numerous field measurements in China, which could better simulate the changes in CSR during the natural succession of forest ecosystems (He et al., 2017; Yan et al., 2020; Cai et al., 2022). Meanwhile, the FCS model also considered the influence of future climate change on forest ecosystems by incorporating data under different future climate scenarios. However, the model only uses mean annual climate parameters, and is not sensitive to the overall response of climate data. As for the data source, the forest sample plots were obtained from a large number of field surveys conducted by the “Climate Change: Carbon Budget and Relevant Issues” of the Chinese Academy of Sciences, which were carried out in strict accordance with field survey specifications and were highly representative (ECSP, 2015). However, there are some uncertainties in this study; the definition of mature forest age is a widely debated scientific issue and we set the age of mature forest stands at 100 a (Liu et al., 2014), which may have allowed the carbon sequestration potential of forests to have been over or underestimated in some provinces. Although previous studies have shown that forests mature at 100-400 a (Guariguata and Ostertag, 2001), some studies showed that defining the mature forest across regions is difficult due to differences in species, forest type and climate (Martin et al., 2016). Theoretically, FCS model can be used to carry out more systematic simulations on basis of different forest types and species, but there are still uncertainties in the spatial data products available at the national scale for these parameters, which need to be improved and refined in future studies. As the economy and public awareness develop, forest area may increase from largescale afforestation/reforestation and ecological restoration or decrease in response to social development demands, but we assume that the existing forest area in each region will remain unchanged for the next 50 a, which may lead to underestimation of the results.

4.2 Strengthening regional regulation to improve the carbon sequestration potential of forests among provinces

Forests in different Chinese provinces, especially Heilongjiang, Sichuan and Yunnan, have great potential for carbon sequestration over the next 50 years. However, to maintain and increase the carbon sequestration potential of the provinces’ forests, long-term effective forest management techniques and new socio-economic policies are needed.
In general, forest management practices to conserve and sequester C can be grouped into three major categories: (i) maintaining existing C pools (e.g., slowing deforestation and forest degradation), (ii) expanding existing C sinks and pools (e.g., increasing C density by modifying forest structure and growth processes), (iii) creating new C sinks and pools by expanding tree and forest cover (afforestation and reforestation) (Peng et al., 2008). As the CSR of forests may vary among provinces (Tables 1-3), strengthening the research and development of technologies with the function of enhancing forest carbon sinks according to its characteristics is urgent. When the CSR of forests is low, appropriate technical measures such as forest soil fertilization, soil improvement, forest thinning, and rational forest harvesting (Figure 6) can be used to not only increase CSR but also lengthen such periods. In addition to clarifying the principles and approaches for improving the capacity of forest carbon sinks, it is important to quantitatively assess the sustainability and consistency of forest carbon sinks, which is the new requirement for sink enhancement technologies for carbon neutrality. Carbon neutrality is a long-term goal; temporary and effective sink enhancement measures should be promoted with caution, because inappropriate forest management practices and short-term sink enhancement measures may also reduce the carbon sink of forests or even convert them to carbon sources (Hyvonen et al., 2007). Meanwhile, carbon neutrality should be integrated with the improvement of ecosystem quality. The development and promotion of carbon sink enhancement technologies that may cause damage to ecosystem quality should be treated with caution.
Figure 6 Requirement for developing a combination of technologies and novel policies to enhance forest carbon sequestration in a new era. CSR, carbon sequestration rate
Through natural restoration and growth, forest ecosystems can not only improve the ecological environment and forest health, but also achieve the long-term forest carbon sink, which is highly desirable (Jin et al., 2020). However, we must pay great attention to their long-term sustainability, disturbance factors and potential risks. Forest management strategies must be developed for each province according to local conditions. Clay et al. (2019) observed that reasonable harvesting and appropriate fires would increase the carbon sequestration capacity of forests, while excessive logging and extreme fires would do the opposite. A study on Pinus sylvestris found that heavy intercutting reduces photosynthesis as well as biomass and soil carbon fluxes, thereby reducing the positive effect of fertilizer application on carbon sink potential, so the interaction between intercutting measures and fertilizer application can be used rationally and is important in guiding management to increase forest carbon sink (Jörgensen et al., 2021). Moreover, forest fire policies should be revisited to optimize the fire-disturbing properties of long-term carbon sinks. Moreover, low-intensity fires must be actively employed to improve forest structure, enhance forest productivity, and boost carbon sequestration (Wright et al., 2020). Extensive outbreaks of pests and diseases also have a significant impact on the structure and quality of forest ecosystems, which can greatly threaten the long-term carbon sink of forest ecosystems (Hyvonen et al., 2007). Biological protection should be fully utilized and strengthened to avoid the loss of carbon sinks caused by pests and diseases as far as possible. In conclusion, to realize the carbon sequestration potential of forests in each province from 2020-2060 (or even longer), we must attach importance to the harmonious development of human beings and nature and actively promote forest conservation. We must follow the two-pronged approach of “increasing” and “preserving” sinks while also adopting scientific and reasonable long-term forest management measures that are appropriate to each province.
Most of the regions with high contributions to carbon neutrality are economically underdeveloped or less economically developed provinces. Therefore, we must not expect to rely on traditional carbon trade (e.g., Clean Development Mechanism, CDM) to make up for the huge imbalance in the inter-provincial carbon sinks. Firstly, compared with the European Union (EU) and other countries, China’s carbon trade market is not perfect and its policies are less flexible. Secondly, there are strong regional differences in China’s naturals, society and economy, which are completely different from those of developed countries in Europe and the US. Thirdly, the carbon trade only captures a small portion of carbon compared to ecosystem carbon sinks; it is therefore difficult to reflect its contribution to carbon neutrality targets. Besides strengthening the carbon trade system, we should also take special measures such as carbon sink compensation or an eco-environmental compensation tax to address the regional imbalance of carbon sinks (Figure 6). It must be ensured that people in western regions or underdeveloped provinces are willing to establish long-term forest carbon sinks, consciously protect and enhance them, and prevent the development of these provinces to achieve the national ecosystem carbon sink target. This will result in poverty in these areas due to the long-term protection of forest carbon sinks and the restriction of economic development. Once the phenomenon of “carbon sink poverty” emerges, it will reduce the subjective willingness of people in the region to protect forests and carbon sinks, making it difficult to realize the long-term carbon sequestration potential of forest ecosystems and affect the national strategic goal of carbon neutrality (Tong et al., 2020). In conclusion, the national and local governments should focus on the regional imbalance based on the CSR per capita, economic development level, climate and soil characteristics. Novel measures such as national carbon trading markets and inter-regional carbon sink compensation in policy making should be optimized. We recommend choosing a pair or pairs of provinces and cities with low GDP but high forest CSRs and high GDP but low forest CSRs, and compensating in both directions for common development. We also recommend providing effective development support to economically underdeveloped provinces and increasing the carbon sequestration potential of the forest ecosystems so that they can make greater contributions to achieving carbon neutrality. This will promote synergy among several strategic objectives such as national rural revitalization, coordinated regional development and common prosperity to help achieve the country’s double hundred goals.

5 Conclusion

Chinese forest ecosystems have a huge carbon sequestration potential over the next 50 a, and the range of forest CSRs among provinces is 0.01-36.74 TgC a-1, with a large imbalance in the forest ecosystem CSR among provinces. The forest CSR per unit area in each province is greater in the east than in the west, while the CSR per unit GDP and the CSR per capita are larger in the west. There is a significant negative correlation between the CSR per capita in each province and its GDP per capita. To enhance the long-term carbon sequestration capacity of forest ecosystems, it is necessary to adopt appropriate forest management measures such as selective logging, thinning, rationalization of stand structure, and prevention of pests and fires, thus realizing the sustainable development of forest carbon sinks in each province. Besides traditional carbon trade, it is also necessary for the country to combine regional forest carbon sequestration potential with regional economic development and policy formulation. Strong compensation and supporting regulatory policies will ensure that people in western regions or underdeveloped provinces will consciously generate, protect and enhance forest carbon sinks. In short, there is an urgent need in the new era to study and build a system that combines forest carbon sequestration technologies and policies to ensure that they meet the national strategic goal of carbon neutrality by 2060, while also synergizing with the national strategic goals of rural revitalization, coordinated regional development and common prosperity.
[1]
Bonan G B, 2008. Forests and climate change: Forcings, feedbacks, and the climate benefits of forests. Science, 320(5882): 1444-1449. https://doi.org/10.1126/science.1155121.

DOI PMID

[2]
Cai W X, He N P, Li M X et al., 2022. Carbon sequestration of Chinese forests from 2010 to 2060: Spatiotemporal dynamics and its regulatory strategies. Science Bulletin, 67(8): 836-843. https://doi.org/10.1016/j.scib.2021.12.012.

DOI

[3]
Cao M K, Woodward F I, 1998. Net primary and ecosystem production and carbon stocks of terrestrial ecosystems and their responses to climate change. Global Change Biology, 4(2): 185-198. https://doi.org/10.1046/j.1365-2486.1998.00125.x.

DOI

[4]
Chen Keyu, Zi Hongbiao, Ade Luji et al., 2018. Current stocks and potential of carbon sequestration of the forest tree layer in Qinghai Province, China. Chinese Journal of Plant Ecology, 42(8): 831-840. https://doi.org/10.17521/cjpe.2018.0058. (in Chinese)

DOI

[5]
Chen L C, Guan X, Li H M et al., 2019. Spatiotemporal patterns of carbon storage in forest ecosystems in Hunan Province, China. Forest Ecology and Management, 432: 656-666. https://doi.org/10.1016/j.foreco.2018.09.059.

DOI

[6]
Clay L, Motallebi M, Song B, 2019. An analysis of common forest management practices for carbon sequestration in south Carolina. Forests, 10(11): 949. https://doi.org/10.3390/f10110949.

DOI

[7]
ECSP, 2015. Observation and Investigation for Carbon Sequestration in Terrestrial Ecosystems by Technical Manual Writing Group of Ecosystem Carbon Sequestration Project. Beijing: Science Press.

[8]
Fang J Y, Chen A P, Peng C H et al., 2001. Changes in forest biomass carbon storage in China between 1949 and 1998. Science, 292(5525): 2320-2322. https://doi.org/10.1126/science.1058629.

DOI PMID

[9]
Fang J Y, Guo Z D, Hu H F et al., 2014. Forest biomass carbon sinks in East Asia, with special reference to the relative contributions of forest expansion and forest growth. Global Change Biology, 20(6): 2019-2030. https://doi.org/10.1111/gcb.12512.

DOI PMID

[10]
Foley J A, 1995. An equilibrium model of the terrestrial carbon budget. Tellus B: Chemical and Physical Meteorology, 47(3): 310-319. https://doi.org/10.3402/tellusb.v47i3.16050.

DOI

[11]
Gao X J, Shi Y, Zhang D F et al., 2012. Climate change in China in the 21st century as simulated by a high resolution regional climate model. Chinese Science Bulletin, 57(10): 1188-1195. https://doi.org/10.1007/s11434-011-4935-8.

DOI

[12]
Guariguata M R, Ostertag R, 2001. Neotropical secondary forest succession: Changes in structural and functional characteristics. Forest Ecology and Management, 148(1-3): 185-206. https://doi.org/10.1016/S0378-1127(00)00535-1.

DOI

[13]
He H L, Wang S Q, Zhang L et al., 2019. Altered trends in carbon uptake in China’s terrestrial ecosystems under the enhanced summer monsoon and warming hiatus. National Science Review, 6(3): 505-514. https://doi.org/10.1093/nsr/nwz021.

DOI

[14]
He N P, Wen D, Zhu J X et al., 2017. Vegetation carbon sequestration in Chinese forests from 2010 to 2050. Global Change Biology, 23(4): 1575-1584. https://doi.org/10.1111/gcb.13479.

DOI PMID

[15]
Hu H F, Wang S P, Guo Z D et al., 2015. The stage-classified matrix models project a significant increase in biomass carbon stocks in China’s forests between 2005 and 2050. Scientific Reports, 5(1): 11203. https://doi.org/10.1038/srep11203.

DOI

[16]
Hyvönen R, Ågren G I, Linder S et al., 2007. The likely impact of elevated [CO2], nitrogen deposition, increased temperature and management on carbon sequestration in temperate and boreal forest ecosystems: A literature review. New Phytologist, 173(3): 463-480. https://doi.org/10.1111/j.1469-8137.2007.01967.x.

DOI PMID

[17]
Jin L, Yi Y Y, Xu J T, 2020. Forest carbon sequestration and China’s potential: The rise of a nature-based solution for climate change mitigation. China Economic Journal, 13(2): 200-222. https://doi.org/10.1080/17538963.2020.1754606.

DOI

[18]
Jörgensen K, Granath G, Lindahl B D et al., 2021. Forest management to increase carbon sequestration in boreal pinus sylvestris forests. Plant and Soil, 466(1/2): 165-178. https://doi.org/10.3390/f10110949.

DOI

[19]
Liu Y C, Yu G R, Wang Q F et al., 2014. Carbon carry capacity and carbon sequestration potential in China based on an integrated analysis of mature forest biomass. Science China Life Sciences, 57(12): 1218-1229. https://doi.org/10.1007/s11427-014-4776-1.

DOI PMID

[20]
Luo W X, Kim H S, Zhao X H et al., 2020. New forest biomass carbon stock estimates in northeast Asia based on multisource data. Global Change Biology, 26(12): 7045-7066. https://doi.org/10.1111/gcb.15376.

DOI

[21]
Ma X Z, Wang Z, 2011. Estimation of provincial forest carbon sink capacities in Chinese mainland. Chinese Science Bulletin, 56(9): 883-889. https://doi.org/10.1007/s11434-011-4402-6.

DOI

[22]
Martin P, Jung M, Brearley F Q et al., 2016. Can we set a global threshold age to define mature forests? PeerJ, 4(6): e1595. https://doi.org/10.7717/peerj.1595.

DOI

[23]
National Forestry and Grassland Administration, 2019. The Main Results of the Ninth National Forest Resource Inventory (2014-2018). Beijing: China Forestry Publishing House. (in Chinese)

[24]
Pan Y D, Birdsey R A, Fang J Y et al., 2011. A large and persistent carbon sink in the world’s forests. Science, 333(6045): 988-993. https://doi.org/10.1126/science.1201609.

DOI

[25]
Peng Y Y, Thomas S C, Tian D, 2008. Forest management and soil respiration: Implications for carbon sequestration. Environmental Reviews, 16(NA): 93-111. https://doi.org/10.1139/A08-003.

[26]
Tang X L, Zhao X, Bai Y F et al., 2018. Carbon pools in China’s terrestrial ecosystems: New estimates based on an intensive field survey. Proceedings of the National Academy of Sciences, 115(16): 4021-4026. https://doi.org/10.1073/pnas.1700291115.

DOI

[27]
Tong X W, Brandt M, Yue Y M et al., 2020. Forest management in southern China generates short term extensive carbon sequestration. Nature Communications, 11(1): 129. https://doi.org/10.1038/s41467-019-13798-8.

DOI PMID

[28]
Wang J, Feng L, Palmer P I et al., 2020. Large Chinese land carbon sink estimated from atmospheric carbon dioxide data. Nature, 586(7831): 720-723. https://doi.org/10.1038/s41586-020-2849-9.

DOI

[29]
Wen D, He N P, 2016. Forest carbon storage along the north-south transect of eastern China: Spatial patterns, allocation, and influencing factors. Ecological Indicators, 61: 960-967. https://doi.org/10.1016/j.ecolind.2015.10.054.

DOI

[30]
Wright J, Delamater D, Simha A et al., 2020. Changes in prescribed fire frequency alter ecosystem carbon dynamics. Ecosystems, 24(3): 640-651. https://doi.org/10.1007/s10021-020-00540-5.

DOI

[31]
Wu Mingyan, Dong Guang, Wang Yiji et al., 2020. Estimation of forest aboveground carbon storage in Sichuan Miyaluo Nature Reserve based on remote sensing, Acta Ecologica Sinica, 40(2): 621-628. https://doi.org/10.5846/stxb201807281610. (in Chinese)

[32]
Xu B, Guo Z D, Piao S L et al., 2010. Biomass carbon stocks in China’s forests between 2000 and 2050: A prediction based on forest biomass-age relationships. Science China Life Sciences, 53(7): 776-783. https://doi.org/10.1007/s11427-010-4030-4.

DOI

[33]
Xu L, Wen D, Zhu J X et al., 2017. Regional variation in carbon sequestration potential of forest ecosystems in China. Chinese Geographical Science, 27(3): 337-350. https://doi.org/10.1007/s11769-017-0870-1.

DOI

[34]
Xu L, Yu G R, He N P et al., 2018. Carbon storage in China’s terrestrial ecosystems: A synthesis. Scientific Reports, 8(1): 2806. https://doi.org/10.1038/s41598-018-20764-9.

DOI

[35]
Xu Li, Yu Guirui, He Nianpeng, 2018. Changes of soil organic carbon storage in Chinese terrestrial ecosystems from the 1980s to the 2010s. Acta Geographica Sinica, 73(11): 2150-2167. https://doi.org/10.11821/dlxb201811008. (in Chinese)

DOI

[36]
Xu L, Yu G R, He N P, 2019. Increased soil organic carbon storage in Chinese terrestrial ecosystems from the 1980s to the 2010s. Journal of Geographical Sciences, 29(1): 49-66. https://doi.org/10.1007/s11442-019-1583-4.

DOI

[37]
Yan P, Xiao C W, Xu L et al., 2020. Biomass energy in China’s terrestrial ecosystems: Insights into the nation's sustainable energy supply. Renewable and Sustainable Energy Reviews, 127: 109857. https://doi.org/10.1038/srep11203.

DOI

[38]
Yao Y T, Piao S L, Wang T, 2018. Future biomass carbon sequestration capacity of Chinese forests. Science Bulletin, 63(17): 1108-1117. https://doi.org/10.1016/j.scib.2018.07.015.

DOI

[39]
Yu D P, Wang X Y, Yin Y et al., 2014. Estimates of forest biomass carbon storage in liaoning province of northeast China: A review and assessment. PloS One, 9(2): e89572. https://doi.org/10.1371/journal.pone.0089572.

DOI

Outlines

/