Modelling the impacts of cropland displacement on potential cereal production with four levels of China’s administrative boundaries

  • YANG Bohan , 1 ,
  • SHENG Siyu 1 ,
  • KE Xinli 2 ,
  • DAI Xianhua 1 ,
  • LU Xinhai 1, 3
Expand
  • 1. College of Public Administration, Central China Normal University, Wuhan 430079, China
  • 2. College of Public Administration, Huazhong Agricultural University, Wuhan 430070, China
  • 3. College of Public Administration, Huazhong University of Science and Technology, Wuhan 430074, China
*Ke Xinli, PhD and Professor, specialized in land use change effect and optimal control. E-mail:

Yang Bohan, specialized in land system evolution and simulation. E-mail:

Received date: 2021-11-30

  Accepted date: 2022-08-25

  Online published: 2023-01-16

Supported by

National Natural Science Foundation of China(42101280)

Humanities and Social Science Fund of the Ministry of Education(20YJC630182)

Humanities and Social Science Fund of the Ministry of Education(18YJA790018)

Copyright

© 2023

Abstract

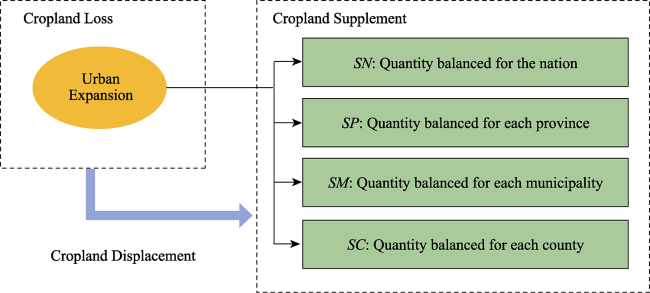
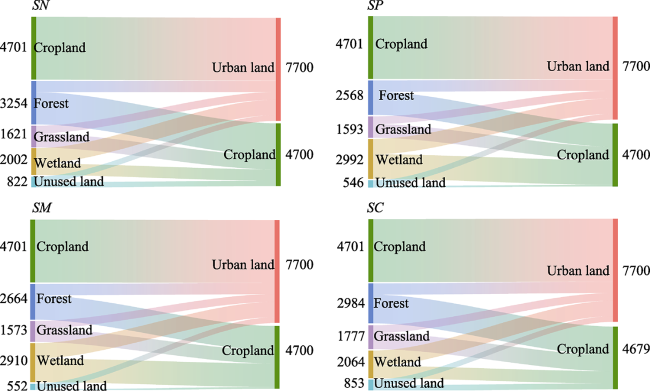
Cropland displacement, as an important characteristic of cropland change, places more emphasis on changes in spatial location than on quantity. The effects of cropland displacement on global and regional food production are of general concern in the context of urban expansion. Few studies have explored scale-effects, however, where cropland is displaced not only within, but also outside, the administrative boundary of a certain region. This study used a spatially explicit model (LANDSCAPE) to simulate the potential cropland displacement caused by urban land expansion from 2020 to 2040 at four scales of the Chinese administration system (national, provincial, municipal, and county levels). The corresponding changes in potential cereal production were then assessed by combining cereal productivity data. The results show that 4700 km2 of cropland will be occupied by urban expansion by 2040, and the same amount of cropland will be supplemented by forest, grassland, wetland, and unused land. The potential loss of cropland will result in the loss of 3.838×10⁶ tons of cereal production, and the additional cropland will bring 3.546×10⁶ tons, 3.831×10⁶ tons, 3.836×10⁶ tons, and 3.528×10⁶ tons of potential cereal production in SN (national scale), SP (provincial scale), SM (municipal scale), and SC (county scale), respectively. Both SN and SC are observed to make a huge difference in cereal productivity between the lost and the supplemented cropland. We suggest that China should focus on the spatial allocation of cropland during large-scale displacement, especially at the national level.

Cite this article

YANG Bohan , SHENG Siyu , KE Xinli , DAI Xianhua , LU Xinhai . Modelling the impacts of cropland displacement on potential cereal production with four levels of China’s administrative boundaries[J]. Journal of Geographical Sciences, 2023 , 33(1) : 18 -36 . DOI: 10.1007/s11442-023-2072-3

1 Introduction

The rapid development of global urbanization is continually increasing demand for construction land, thus inevitably causing losses of cropland around cities (Huang et al., 2020). Much new land has been claimed for cropland worldwide, however, in the context of global and regional food security (Lambin et al., 2013; Lark et al., 2015; Delzeit et al., 2017; Xia et al., 2018; Yu and Lu, 2018; Zabel et al., 2019; Tang et al., 2020). Fierce competition for land has resulted in significant changes of cropland location: cropland displacement (Meyfroidt et al., 2013; Pandey and Seto, 2015; van Vliet, 2019). Transitioning from natural habitat (forest, grassland, wetland, etc.) to cropland leads to a series of ecological environmental problems such as climate change (Meyfroidt et al., 2010; Li et al., 2012; Damien et al., 2017), reductions in biodiversity (Zhao et al., 2015; Kastner et al., 2021), and the loss of ecosystem services (Liu et al., 2014; Ke et al., 2018; Xia et al., 2018). Cropland displacement also creates an imbalance of land productivity between lost and new cropland (Jiang et al., 2011; Li et al., 2018; Bakr and Afifi, 2019). China’s explosive urban land expansion, as well as the consequent cropland displacement, pose challenges to national food security (Song and Liu, 2017; Xu et al., 2017; Wang et al., 2019). Cropland displacement and its effects have thus been widely discussed as issues in global land use change.
Cropland displacement is often in a clear direction. New cropland is generally derived from areas with cheaper and more abundant labor forces and resources, or areas with weaker environmental management agencies (Yu et al., 2013; Ordway et al., 2017; Li and Chen, 2019). Cropland is generally displaced to low-income countries in order to meet demand from high-income countries as regards urban development, food security, and relief from ecological environmental pressures (Weinzettel et al., 2013). Cropland displacement takes place not only between country and country, however, but also within a country (Yang et al., 2020). In China, cropland loss mainly occurs in the economically-developed eastern coastal areas, and is largely supplemented from the ecologically fragile areas located in the north and west (Qin et al., 2013; Zhao et al., 2015; Gao et al., 2019). It is cropland displacement, moreover, rather than net cropland change, that has become a more typical feature in regional cropland change (Fuchs et al., 2015). For example, Lark et al. (2015) tracked net cropland changes and total changes in the US from 2008 to 2012, and found that cropland displacement was nearly four times the net change. Displacement rather than net change also predominated in Chinese cropland change in 2000-2018 (Yang et al., 2020). With almost the same amount between lost and supplemented cropland, the barycenter of China’s cropland has shifted from southern China to the north and northwest (Zhao et al., 2015; Gao et al., 2019; Liu and Zhou, 2021).
As cropland is the basic resource required for food production, the effect of cropland displacement on crop production has been always an important issue. The global cropland area has been characterized since the 1980s by fluctuating growth, with increases of 1.60×10⁷ km2 and decreases of 1.07×10⁷ km2, with actual crop production ultimately increasing (Yao et al., 2017; Yu et al., 2019). Regionally, North America, South America, and Oceania witnessed fastest growth in cropland areas, and Asia, Europe, and Africa experienced the opposite (d’Amour et al., 2017; Yao et al., 2017; Yu et al., 2019). Cropland expansion does not always bring a return in the improvement of agricultural productivity. For example, cropland expansion in Southern America resulted in a strong decrease in net primary productivity (Liu et al., 2021). Between 2000 and 2018, the cropland area in China increased by 1.96×10⁵ km2 and lost 2.04×10⁵ km2; the total area remained largely unchanged, but the potential cereal production decreased (Xu et al., 2017; Yang et al., 2020). Specifically, cropland with high yields, such as the Huang-Huai-Hai Plain, was converted into construction land, and other land in the northeast and northwest was converted into cropland (Xu et al., 2017; Ning et al., 2018). The difference in quality between the new and previous cropland suggests that cropland displacement may potentially lead to a loss of cereal production (Liang et al., 2015; Song and Liu, 2017; Wang et al., 2021).
Many studies have predicted the effects of cropland displacement on agricultural production. van Vliet et al. (2017) assessed the amount of urban land taken from 2000 to 2040, using a land systems approach, and calculated the displacement of crop production between 2000 and 2040 as a consequence of urbanization in order to quantify its contribution to global cropland expansion. The spatially explicit model is also often used to simulate cropland displacement. Li and Chen (2019) developed a cellular automata model and found in a simulation that, under China’s cropland balance policy, cropland losses will reach between 2.3×10⁴ km2 and 10.3×10⁴ km2 from 2010 to 2050. Cropland losses were expected to occur mainly in eastern and coastal China between 2010 and 2050, and most of the new cropland would move to less developed inland areas. And the new cropland increased potential cereal production from 4.610×10⁶ tons to 18.780×10⁶ tons, only replacing 28%-31% of the potential losses in cereal production. Haney and Cohen (2015) used the Global Land Use Dynamics Model (GLUDM) to predict global cropland area dynamics between 2005 and 2050. Global cropland was expected to increase by 18%, mainly in the Central United States, Central Africa, South America, and East Asia. South Asia and Europe were expected to see a sharp fall, with agricultural production in Europe and eastern North America decreasing. Previous studies have projected cropland displacement and its effect on food production without considering differentiated cropland displacement strategies. A recent study utilizing historical observation indicated that cropland displacement in specific regions might have different effects on crop production according to top and subsidiary administrative jurisdictions (Yang et al., 2020).
Following the definition of cropland displacement by Yang et al. (2020), namely location change in which the lost cropland is supplemented equivalently elsewhere in the same period, this research used the Chinese mainland as a case study, simulated cropland displacement at four Chinese administrative levels from 2020 to 2040 by using the LANDSCAPE model, and assessed the corresponding changes in potential cereal production. We explored the effects of multiple strategies of cropland displacement on potential cereal production from a future perspective, and hope to offer support for decisions about cropland resource management and food security.

2 Data and methods

2.1 The LANDSCAPE model

This study used a spatially explicit land use model, LANDSCAPE (LAND System Cellular Automata model for Potential Effects), to simulate cropland displacement at four levels of China’s administrative boundaries for the period 2020-2040. The LANDSCAPE model was developed based on the Cellular Automata model to simulate land use changes in two key ways: a hierarchical allocation strategy and the ability to assign changes to multiple land use types. It considers conversion probabilities between various land use types and reveals the dynamic simulation and optimal configuration of land use changes using a hierarchical allocation strategy.
(1) Hierarchical allocation strategy: The LANDSCAPE model reflects the evolutionary characteristics of different land use types, dividing them into active and passive categories. Active land use types, such as construction land and cropland, refer to changes directly caused by human activities, including land use types with the direct demand of human production and life. Passive land use types, such as wetland, forest, and grassland, are not directly determined by human needs, but are affected by changes to active land use types.
(2) Conversion probability: The conversion probability of a grid cell is determined by its suitability and resistance. Suitability refers to the driving force of the grid cell converting one land use type to the others, and resistance refers to the difficulty of doing so. Great conversion probability indicates that the land use type in the grid cell is more likely to convert to the other land use types. When active land use types grow, passive types are occupied by active types according to their suitability and resistance. The conversion probability is calculated by:
$C{{P}_{l,tu}}=\frac{{{S}_{l,tu}}}{{{R}_{l,cu}}}$
where CPl,tu is the probability of location l converting to target land use type tu, Sl,tu is the suitability of location l for converting to target land use type tu, and Rl,cu represents the resistance of location l to converting from current land use type cu to other land use types. Sl,tu is determined by constraints on location, neighbors, biophysical, and socioeconomic characteristics. Rl,cu depends on the current land use type cu and its resistance coefficients. In this paper, the resistance coefficient is a relative value and the coefficients of each land use refer to previous studies, as shown in Table 1. The calculation formula for Sl,tu is:
${{S}_{l,tu}}=(1+{{(1+(-\ln r))}^{\alpha }})\times P{{G}_{l,tu}}\times Con({{C}_{l,tu}})\times {{\text{ }\!\!\Omega\!\!\text{ }}_{l,tu}}$
where r is a random number from 0-1, α is an integer from 1-10 to control the size of the random variable. PGl,tu, obtained using a support vector machine, represents the effects of biophysical and socio-economic parameters such as elevation, slope, GDP, and population density, and other parameters, and Con (Cl,tu) represents conversion constraints. In this study, rivers and nature reserves are prohibited from converting to other land use types, and urban land and rural settlements are limited in converting to cropland as it is very difficult to convert construction land to cropland. Ωl,tu is the neighbor conversion probability for each land use type. The parameters used in the model are shown in Figure 1.
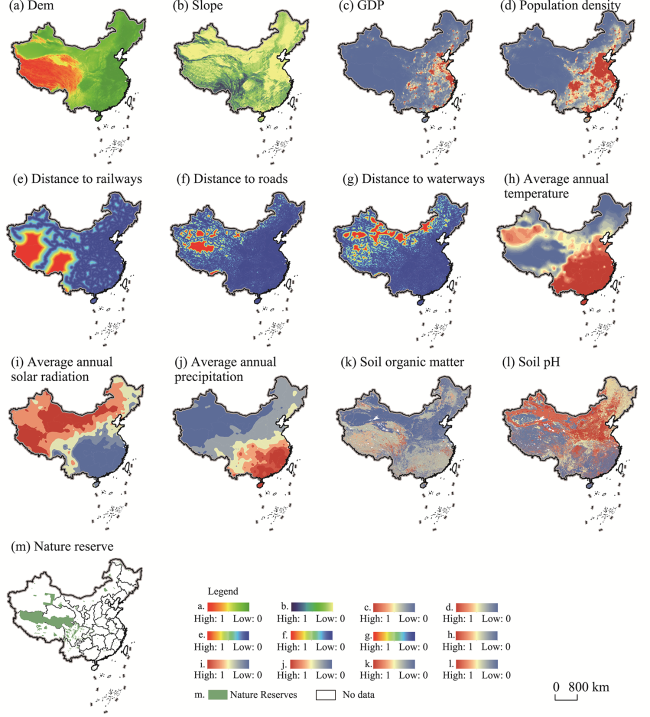
Figure 1 The parameters used for calculating conversion probability in China
Table 1 Resistances for each land use type
Land use type Cropland Forest Grassland River Wetland Urban land Rural settlement Unused land
Resistance 1 1.25 1.25 1.5 1.25 1.5 1.5 1

2.2 Model calibration

Land use change between 2010 and 2020 was simulated to calibrate model parameters. Simulation accuracy can be evaluated by comparing the differences between the simulated and the observed land use maps for the year 2020. This study used the Kappa Simulation Index to evaluate the simulation accuracy of LANDSCAPE, which can avoid the confusion matrix incorporating many unchanged cells into the accuracy measurement. The Kappa Simulation score holds values ranging from −1 to 1, where 1 indicates a perfect agreement, and 0 indicates that the agreement is only as good as a random distribution of given class transitions. A negative Kappa Simulation score demonstrates a lower accuracy, while a positive value can be interpreted as being more accurate than a random distribution, and a score closer to 1 indicates higher confidence. Table 2 shows the Kappa Simulation score for the calibration period.
Table 2 Fine assessment of land use simulation results (2010-2020)
Cropland Forest Grassland River Urban land Rural settlement Unused land
K_simulation 0.261 0.107 0.052 0.214 0.547 0.277 0.303
K_Transloc 0.470 0.327 0.433 0.454 0.587 0.313 0.434
K_Transtion 0.555 0.328 0.119 0.472 0.931 0.886 0.697
Kappa simulation values for all land use types are greater than 0 in Table 2, which indicates that the calibrated LANDSCAPE model performs better than could be expected by chance, and shows that the model is accurate enough to simulate land use in 2040. The relatively high K_simulation values for urban land, rural settlements, cropland, and unused land suggest that the model has high accuracy in simulating these land use types.

2.3 Scenario design for cropland displacement

Cropland displacement is a change in the geographical location of cropland. This study examines the process wherein cropland is lost somewhere due to urban land expansion, and equivalently supplemented elsewhere. Accordingly, cropland displacement can be decomposed into two parts. The first is cropland occupied by urban land, and the second is the equivalent cropland supplemented from natural habitats such as forest, grassland, wetland, and unused land. We considered four levels of China’s administration system (national, provincial, municipal, and county) as the boundaries of cropland displacement (Figure 2). Four scenarios of cropland displacement were designed: (1) National Scale (SN): no boundary limitations for cropland displacement. After cropland is lost, the equivalent new cropland could be supplemented anywhere in China’s mainland, (2) Provincial Scale (SP): the quantities of lost and supplemented cropland must be balanced for each province, (3) Municipal Scale (SM): the quantities of lost and supplemented cropland must be balanced for each municipality, and (4) County Scale (SC): the quantities of lost and supplemented cropland must be balanced for each county. The process of cropland loss (i.e., urban land expansion) is the same for each scenario, while the process of cropland supplement is different (Figure 3). This paper uses the Markov chain model to predict the national demand for urban land in 2040, in order to simulate urban land expansion for the years 2020-2040. The 2000, 2010, and 2020 land use maps are used to predict that China’s urban land will reach 78,866 km2 by 2040.
Figure 2 Flow of cropland displacement simulation for the four scenarios in China
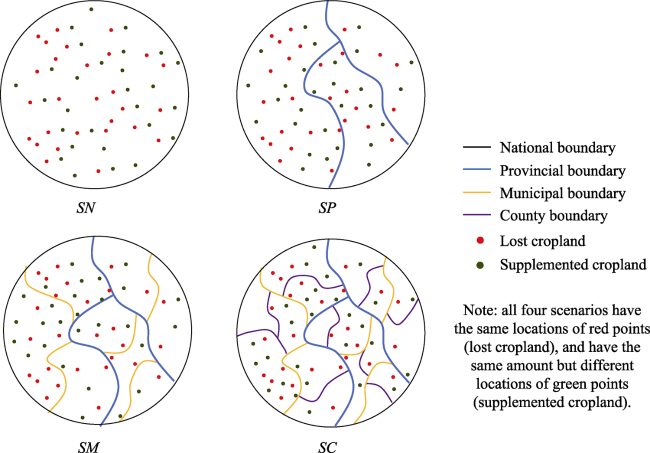
Figure 3 Conceptual graphs of cropland displacement for the four scenarios in China

2.4 Data sources

This study mainly used four datasets. The first is land use data for 2000, 2010, and 2020, derived from the Resource and Environmental Science and Data Center, Chinese Academy of Sciences (RESDC, http://www.resdc.cn), with a spatial resolution of 1 km. Cropland refers in this dataset to the land where crops are planted, including paddy fields and dry land; forest refers to growing trees, shrubs, and other forestry lands; grassland refers to all kinds of grassland, mainly growing herbs with a coverage of more than 5%; wetland refers to lakes, tidal flats, and ponds except for rivers; urban land refers to areas built-up as cities, counties, and towns; rural settlement refers to residential land for rural living; unused land refers to currently unused land, such as a desert, saline-alkali soil, marsh, bare land, and other land that is difficult to use.
The second dataset is for agro-ecological attainable yield, derived from GAEZ products (https://gaez.fao.org) for the time period 1981-2010 for wheat, corn, and rice under rain-fed for all phase conditions, high input level, and with CO2 fertilization using climate data source CRUTS32, based on historical data. We mixed the three main crops grown in China (accounting for some 92.1% of total Chinese grain production in 2018) to generate data for potential cereal productivity, and resampled the data from the 5 arc-minutes of the original resolution to 1 km (Figure 4).
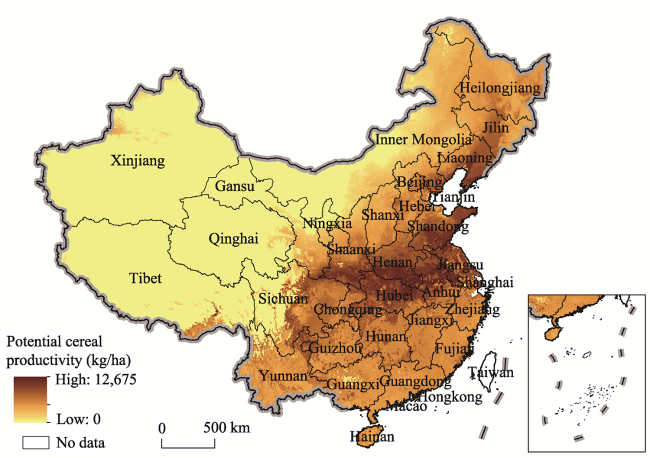
Figure 4 Spatial distribution of potential cereal productivity in China (kg/ha)
The third dataset is for administrative boundary data, including three administrative scales, the provincial, municipal, and county levels, all obtained from the RESDC National Administrative Division Database. The provincial data includes 31 provincial administrative units (including provinces, autonomous regions and municipalities and excluding Hong Kong, Macao, and Taiwan), 339 cities, and 2406 counties.
The fourth dataset is used to calculate parameters in the LANDSCAPE model, including meteorological data, terrain data, soil data, traffic data, nature reserve data, GDP, and population, which is also used to predict demand for urban construction land in 2040 (Table 3).
Table 3 Dataset source and description
Datasets Data source Data description
Land use data RESDC Land-use map in 2000 used to project urban land demand for 2040
Land-use map in 2010 used to simulate land use for 2020
Land-use map in 2020 used for model calibration
Administrative boundary data RESDC The national boundary data used for scenario SN
The provincial boundary data used for scenario SP
The municipal boundary data used for scenario SM
The county boundary data used for scenario SC
Potential cereal production data GAEZ Potential cereal production dataset used as a restricted condition of cereal production displacement in LANDSCAPE model
Meteorological data The China Meteorological Data Network Data for average annual precipitation in 2018 used to calculate the conversion probability
Data for average annual accumulated temperature in 2018 used to calculate the conversion probability
Data for average annual solar radiation in 2018 used to calculate the conversion probability
Terrain data The Shuttle Radar Topography Mission (SRTM) DEM data used to calculate the conversion probability
Slope data extracted from DEM used to calculate the conversion probability
Soil data Harmonized World Soil Database (HWSD) Soil type used to calculate the conversion probability
Soil organic carbon used to calculate the conversion probability
Soil PH value used to calculate the conversion probability
Traffic data Open Street Map Euclidean distance to roads in 2020 used to calculate the conversion probability
Euclidean distance to railways in 2020 used to calculate the conversion probability
Euclidean distance to waterways in 2020 used to calculate the conversion probability
Population data RESDC Total population of the Chinese mainland in 2015 used to project urban land demand for 2040
GDP RESDC The spatial distribution of GDP for China in 2015 used to calculate the transfer probabilities
Nature reserve data RESDC Restricting urban land expansion and cropland development

3 Results

3.1 Cropland displacement caused by urban land expansion at four administrative scales

Between 2020 and 2040, 4701 km2 of cropland and 2999 km2 of natural habitat are expected to be taken for urban land expansion in China (Figure 5). Figure 6 shows the distribution of cropland losses at three sub-national scales. The losses will mainly occur on the east coast and in central China. Shandong and Jiangsu (two east coast provinces), will experience the highest cropland loss (823 km2 and 770 km2, respectively) accounting for 33.8% of the total cropland loss. Conversely, Tibet, Qinghai, and Hainan will lose less than 10 km2 of cropland, as urban land is expected to mainly occupy more natural habitats than cropland in these areas. The central and eastern provinces, such as Shanghai, Shandong, and Henan, will be exactly the opposite. For example, the cropland lost in Shanghai will account for 92.7% of the total area used for urban land expansion. This figure will be greater than 50% in the most central and eastern cities.
Figure 5 Flows of land use transitions for the four scenarios in China (km2)
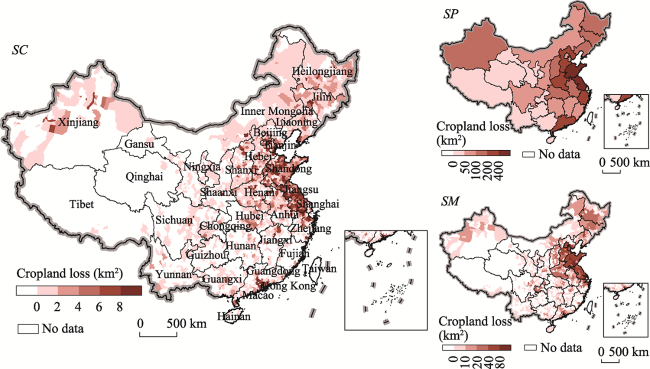
Figure 6 Spatial distribution of cropland loss at three sub-national levels in China
In the same period, 4700 km2 of cropland will be supplemented from natural habitat. The amount of lost and supplemented cropland will basically be balanced, however, the spatial location of newly added cropland, as well as the losses of natural habitat, will differ at different scales. The supplemented cropland in SN and SC will mainly come from forest and grassland, while that in SP and SM will mainly come from forest and wetland. Separately, the supplemented cropland in SN and SC will be mainly in the Sichuan Basin and northeast plain (Figure 7). The supplemented cropland for SP, SM will mostly be in areas with serious losses of cropland, such as the central and eastern regions and the northeast plain. Shandong and Jiangsu (two east coast provinces) will have the most newly added cropland (826 km2 and 769 km2, respectively), accounting for 33.9% of the total newly added cropland. Conversely, Tibet and Qinghai will have the least supplementary cropland (less than 10 km2).
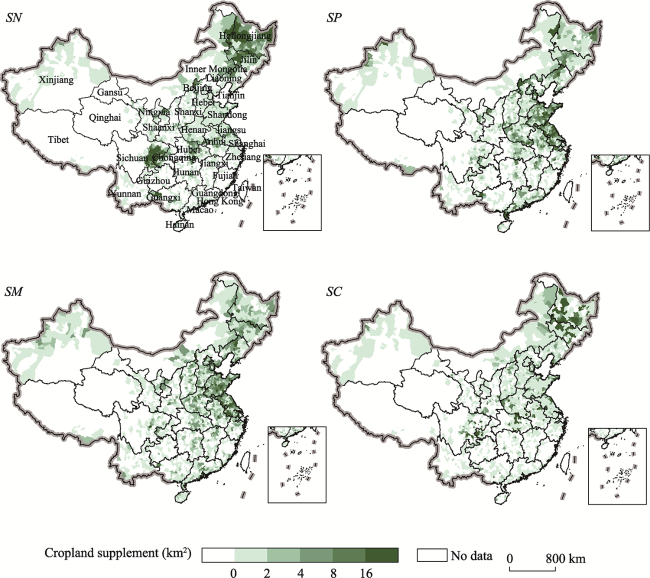
Figure 7 Spatial distribution of cropland supplement in the four scenarios in China at the county level

3.2 Changes to potential cereal production at four administrative scales

China’s potential cereal productivity has obvious spatial heterogeneity, that is higher in the east and lower in the west (Figure 4). The change in potential cereal production thus varies according to the change of cropland location. Between 2020 and 2040, the loss of cropland will cause a loss of 3.838×10⁶ tons of potential cereal production. Figure 8 shows the distribution of potential cereal production losses at the three sub-national scales. Cereal production will potentially be lost on the east coast and in central China, as well as the northeast plain areas, where there are areas with more cropland loss and higher potential cereal productivity. The two provinces with the highest potential cereal production loss are Shandong and Jiangsu (0.772×10⁶ tons and 0.748×10⁶ tons, respectively), accounting for 39.6% of the total losses. Conversely, Tibet, Qinghai, Xinjiang, and Ningxia will lose less than 0.5×10⁴ tons of potential cereal production. At the municipal and county scales, potential cereal production losses will be mainly distributed in cities and counties around the north China plain (including Beijing, Tianjin, Hebei, Shandong, Henan, and other places).
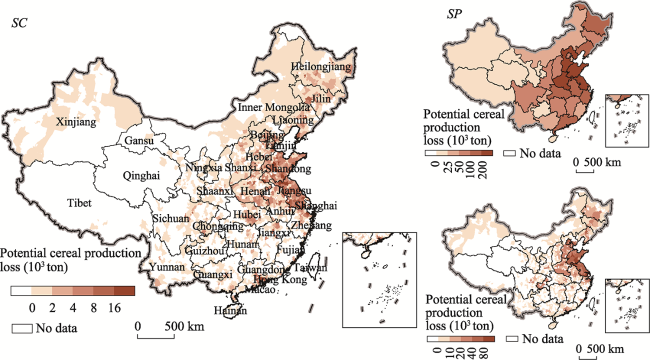
Figure 8 Spatial distribution of potential cereal production loss at three sub-national levels in China
On the other hand, different locations of supplemented cropland result in different changes to potential cereal production across the scenarios. In SN, cropland supplement will contribute to an increase in potential cereal production of 3.546×10⁶ tons. This will change to 3.831×10⁶ tons, 3.836×10⁶ tons, and 3.528×10⁶ tons in SP, SM, and SC, respectively. The potential cereal production gained in each scenario is less than the loss. Cropland displacement will thus achieve a balance of cropland area, but not of production. In SN, potential cereal production will be mainly supplemented in Central China, Sichuan Basin, and the northeast plain (Figure 9). Sichuan and Heilongjiang will have the most gain (1.031×10⁶ tons and 0.890×10⁶ tons, respectively), accounting for 54.2% of the total supplement (Table 4). In SP and SM, newly added potential cereal production will be mainly located in the east-central and northeast plain, especially in Shandong and Jiangsu. In SC, Heilongjiang and Sichuan will have the highest increases. The supplemented potential cereal production will show a clear trend in all scenarios: more in the east and less in the west.
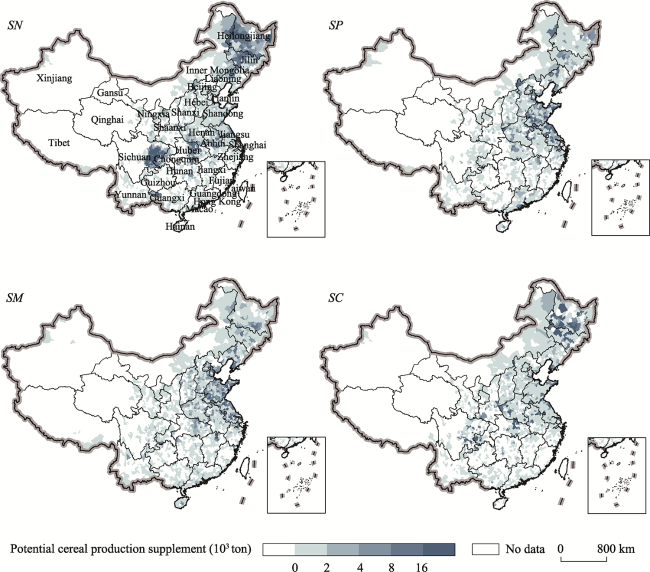
Figure 9 Spatial distribution of potential cereal production supplement for the four scenarios in China at the county level
Table 4 Changes in potential cereal production for the four scenarios in China (103 ton)
Province Loss SN SP SM SC
Supplement Net
change
Supplement Net
change
Supplement Net
change
Supplement Net
change
Beijing 58 0 -58 32 -26 49 -9 5 -52
Tianjin 37 3 -34 42 5 43 6 14 -23
Hebei 281 56 -225 204 -77 290 9 126 -155
Shanxi 97 35 -61 104 7 102 5 74 -23
Inner Mongolia 26 77 51 40 14 32 6 46 20
Liaoning 177 81 -97 157 -20 185 7 68 -110
Jilin 87 181 93 85 -2 94 7 286 199
Heilongjiang 125 890 764 123 -3 135 10 864 738
Shanghai 34 0 -34 22 -11 29 -5 3 -31
Jiangsu 748 88 -660 742 -6 679 -69 97 -651
Zhejiang 162 8 -154 156 -6 123 -40 9 -154
Anhui 167 136 -32 174 7 181 14 157 -10
Fujian 40 2 -38 39 -1 32 -8 8 -32
Jiangxi 72 23 -50 70 -3 77 5 18 -55
Shandong 772 109 -663 796 23 768 -4 225 -547
Henan 334 132 -203 375 41 350 15 209 -126
Hubei 108 254 147 112 5 127 19 245 138
Hunan 58 66 7 68 10 71 13 31 -27
Guangdong 194 8 -186 191 -2 122 -71 14 -180
Guangxi 35 121 86 36 1 52 17 31 -4
Hainan 5 5 0 7 1 16 11 7 1
Chongqing 30 145 115 30 0 31 1 189 160
Sichuan 79 1031 952 78 -1 95 17 611 532
Guizhou 12 3 -9 13 1 20 7 12 0
Yunnan 30 11 -19 31 1 40 10 27 -3
Tibet 0 1 1 2 2 3 3 0 0
Shaanxi 54 59 5 55 1 63 10 134 80
Gansu 10 15 5 10 0 13 3 14 5
Qinghai 1 0 0 1 0 2 1 0 -1
Ningxia 1 1 0 9 7 4 2 0 -1
Xinjiang 3 6 3 26 22 10 6 6 3
Total 3838 3546 -293 3831 -7 3836 -2 3528 -310
The net changes to potential cereal production for the four scenarios are mapped at the county level (Figure 10). In SN, the highest net loss of potential cereal production will be concentrated in Central and the coastal Southeast China, around Shandong and Jiangsu (0.663×10⁶ tons and 0.660×10⁶ tons, respectively). The northeast plain and Sichuan Basin will clearly show a net increase, such as Sichuan and Heilongjiang increasing by 0.952×10⁶ tons and 0.764×10⁶ tons, while Qinghai, Tibet, Xinjiang, and some provinces in northwest China will only change a little. SP and SM will have smaller changes compared to SN and SC. In SP, net losses will be mainly concentrated in the Beijing-Tianjin-Hebei region, of which Hebei will lose the most, with 0.770×10⁵ tons. The adjacent province Henan, however, will achieve the highest net increase of 0.410×10⁵ ton. In SM, except for the coastal southeast areas, more inland areas will have a net increase. In SC, the net losses of potential cereal production will mainly be concentrated in the eastern coast areas and parts of central China. The center of the net increase will be in the Yangtze River, Sichuan Basin, and the northeast plain.
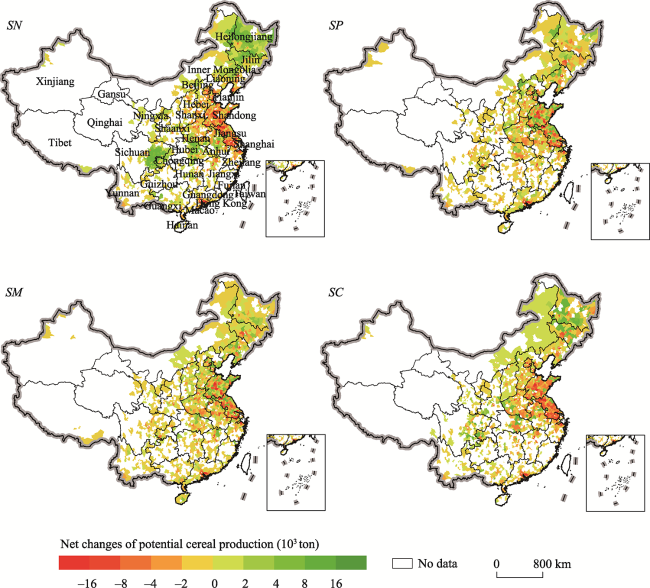
Figure 10 Spatial distribution of net changes in potential cereal production for the four scenarios in China at the county level

4 Discussion

4.1 Effects of cropland displacement

Cropland displacement has caused the gravity-center of croplands to move northwest and led to a decline in China’s total potential cereal production. Cropland changes in China mainly showed a trend of “gain in the north and loss in the south, gain in the west and loss in the east” (Jia et al., 2018; Wang et al., 2019; Liu and Zhou, 2021). In the context of the huge spatial heterogeneity in cereal potential productivity between the southeast and northwest in China (Liu et al., 2014), although the total area of cropland in China has maintained a dynamic balance for the last decade, the overall quality of cropland showed a downward trend and the country’s total grain production capacity reduced (Kuang et al., 2021). Some administrative units are unable to complete the cropland supplementary target in their own areas under the strict cropland protection policies, which will lead to the more serious phenomenon of cropland “up the mountain and into the sea, take up of high-quality cropland and compensate for inferior cropland”. This is also confirmed by our simulation results: the simulated yield in mountainous areas is higher than that in plain areas. The results of this study also indicate that cropland displacement will give rise to a net loss in potential cereal production in all four scenarios, which will affect national food security. The results also show that the average productivity of lost cropland is much higher than that of supplemented cropland, and this is confirmed by both future projections and historical observations (Li et al., 2018; Liu et al., 2019; Wang et al., 2021).
Cropland displacement not only affects food security, but also means that food production comes at a greater ecological environment cost. Under the strict cropland protection policy, the cropland occupied by urban land needs to be replaced by the same amount of new cropland. In practice, new cropland is largely supplemented from natural habitat rather than construction land as it is difficult to reclaim construction land for cropland (Foley et al., 2011; Fritz et al., 2015; Yang et al., 2020). The “cascading effect” (Ke et al., 2018; van Vliet, 2019) of cropland displacement has a specifically negative effect on natural habitat as well as ecological environment. In past decades, new cropland in China was mainly cultivated in the northeast and northwest, which are ecologically vulnerable areas. Cropland displacement has brought intensified water shortages, soil erosion due to wind, and increased ecological vulnerability to these areas (Kuang et al., 2021). The structures of natural habitat loss are different for the modelling results, although the amount of natural habitat loss due to cropland displacement is consistent for all scenarios (Figure 11). SN lost the most forest and SC lost the most grassland, while SP and SM have more serious wetland losses. As there are different ecosystem services between natural habitats, further research into the ecological effects of cropland displacement is necessary in order to coordinate the trade-offs between urban development, food security, and ecosystem conservation.
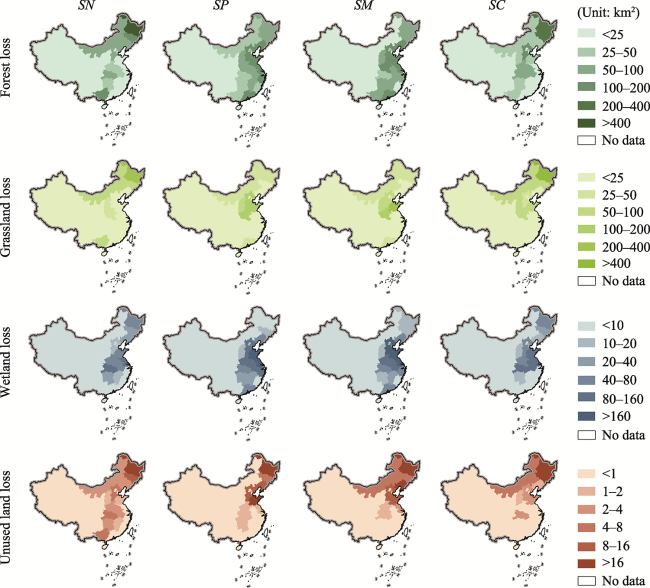
Figure 11 Structure of natural habitat loss for the four scenarios in China at the provincial level

4.2 Policy implications for Chinese cropland protection

In order to ensure food security, the Chinese government has implemented the world’s strictest cropland protection policy since the late 1990s, with the “requisition-compensation balance of cropland” (RCBC) at the core (Long, 2014). This effectively curbed the trend of rapid reduction of cropland and ensured national food security (Liu and Zhou, 2021), however, intensifying urbanization means this policy has faced a series of limitations, such as more requisitions and less compensation (Chen et al., 2019), superior occupation and inferior compensation (Lichtenberg and Ding, 2008; Liu et al., 2019), requisitioning paddy fields and compensating with dry land (Sun et al., 2014; Chen et al., 2019), and requisitioning plains and compensating with mountain areas (Liang et al., 2015; Li and Chen, 2019). China’s spatially-uneven cropland reserves also continue to reduce. County-level administrative units, as well as some municipalities directly under central government (such as Beijing, Tianjin, and Shanghai) have been unable to achieve the goal of RCBC within their own jurisdictions (Xu et al., 2017; Liu et al., 2019). On this basis, China adjusted the RCBC to allow some provincial units to supplement cropland outside their own jurisdictions in 2018 (Chen et al., 2019), however, our study indicates that it is trans-provincial cropland displacement (SN) rather than other scenarios that has a more negative effect on potential cereal production. Accordingly, we suggest there is a need to: (1) control the scale and direction of cropland displacement by limiting the rate of urban expansion (increasing the level of intensive use of urban land) and natural habitat protection systems; (2) avoid occupying ecologically fragile areas and natural habitats of high ecosystem value to supplement cropland; (3) determine the location of cropland supplement through spatial optimization allocation, so as to alleviate the impact of cropland displacement on food production, on the basis of an assessment of potential cereal production. Furthermore, cropland protection should focus on improving the productivity of existing cropland by implementing a reasonable cropping system (Glover et al., 2010), soil environment improvement (Liang et al., 2015; Mandal et al., 2021), and infrastructure rehabilitation (Mamatzakis, 2003; Huang et al., 2021).

4.3 Uncertainty

Our results show that SN and SC, rather than SP and SM, will result in greater losses in potential cereal production due to cropland displacement. There may be a number of reasons for the similar results of SN and SC. The results for SN follow the historical practice of large-scale cropland displacement in China: cropland supplementation mainly occurs in northern China, where climate conditions have improved and there are rich land reserve resources. As the overall potential cereal productivity in the northwest is relatively lower than that in the southeast, the loss of potential cereal production will certainly be more serious when the new cropland is displaced to the north (Song and Liu, 2017; Li et al., 2018; Wang et al., 2021). The simulation result for SC may be largely affected by the modelling resolution. In this paper, the spatial resolution of the grid data adopted is 1 km, which is relatively rough for some county-level administrative units, especially those located in eastern and southeast China. These small counties not only have higher potential cereal productivity but also a greater demand for urban expansion. On the basis of the rough modelling resolution, there will be no room for cropland supplement within their own jurisdiction after cropland loss. Datasets with smaller resolutions may help to provide more accurate performance. SP and SM have more supplementary spaces. Compared to remote displacement, there is little difference in potential cereal productivity between lost and supplementary cropland at a smaller scale. Potential cereal production can thus be more easily balanced in SP and SM.
This paper involves some limitations (1) this study assumed urban expansion is a consistent process for all scenarios in order to compare the differentiated effects of four cropland supplement strategies on cereal potential production. In fact, different cropland displacement strategies will lead to different processes of urban expansion; (2) this study does not consider the processes converting river, urban land and rural settlements into croplands. This is mainly because construction lands and rivers are difficult to reclaim as croplands. Conversions of croplands from forest, grassland, wetland and unused land are also much common than from construction land and rivers; (3) this paper considered urban expansion as the only driving factor of cropland loss. In fact, agricultural restructuring (Song and Pijanowski, 2013; Liu et al., 2014), the “Grain-for-Green” Project (Qin et al., 2013; Xu et al., 2017), and land degradation and desertification (Liu et al., 2010; Mandal et al., 2021) also lead to losses in cropland resources.
We thus expect to answer the following questions in further explorations: (1) What is the regional disparity of cropland supplement mechanisms? (2) How does cropland displacement affect regional ecological environment? (3) How can cropland displacement, urban expansion and ecological conservation be coordinated through the spatially optimal allocation of different land types?

5 Conclusions

We used the LANDSCAPE model to simulate cropland displacement between 2020 and 2040 on four administrative scales in China, and used the potential cereal productivity data to calculate corresponding changes due to cropland displacement. The results show that a total of 4701 km2 cropland will be lost due to urban land expansion, while the same amount of new cropland will be supplemented, but will differ considerably in locations among the four scenarios. Cropland displacement will achieve a balance of cropland area but not cropland production. Potential cereal production in all four scenarios is observed as a net loss. Cropland loss between 2020 and 2040 will result in the loss of 3.838×10⁶ tons of potential cereal production. Cropland supplements will contribute to an increase in potential cereal production of 3.546×10⁶ tons, 3.831×10⁶ tons, 3.836×10⁶ tons, and 3.528×10⁶ tons in SN, SP, SM, and SC, respectively. The losses to potential cereal production in SN and SC will be greater than those in SP and SM, which indicates that large or overly small-scale cropland displacement will lead to more severe losses in potential cereal production. We therefore suggest that China should control the scale of cropland displacement, avoid occupying ecologically fragile areas, and optimize the allocation of cropland resources, so as to reduce the effect of cropland displacement on cereal production, and promote the effect of cropland protection.
[1]
Bakr N, Afifi A A, 2019. Quantifying land use/land cover change and its potential impact on rice production in the Northern Nile Delta, Egypt. Remote Sensing Applications: Society and Environment, 13: 348-360.

[2]
Chen W, Ye X, Li J et al., 2019. Analyzing requisition-compensation balance of farmland policy in China through telecoupling: A case study in the middle reaches of Yangtze River Urban Agglomerations. Land Use Policy, 83: 134-146.

DOI

[3]
Damien A, Isabelle T, Christovam B et al., 2017. Land use sustainability on the South-Eastern Amazon agricultural frontier: Recent progress and the challenges ahead. Applied Geography, 80: 86-97.

DOI

[4]
d’Amour C B, Reitsma F, Baiocchi G et al., 2017. Future urban land expansion and implications for global croplands. Proceedings of the National Academy of Sciences of the United States of America, 114(34): 8939-8944.

DOI PMID

[5]
Delzeit R, Zabel F, Meyer C et al., 2017. Addressing future trade-offs between biodiversity and cropland expansion to improve food security. Regional Environmental Change, 17(5): 1429-1441.

DOI

[6]
Foley J A, Ramankutty N, Brauman K A et al., 2011. Solutions for a cultivated planet. Nature, 478(7369): 337-342.

DOI

[7]
Fritz S, See L, Mccallum I et al., 2015. Mapping global cropland and field size. Global Change Biology, 21(5): 1980-1992.

DOI PMID

[8]
Fuchs R, Herold M, Verburg P H et al., 2015. Gross changes in reconstructions of historic land cover/use for Europe between 1900 and 2010. Global Change Biology, 21(1): 299-313.

DOI PMID

[9]
Gao X, Cheng W, Wang N et al., 2019. Spatio-temporal distribution and transformation of cropland in geomorphologic regions of China during 1990-2015. Journal of Geographical Sciences, 29(2): 180-196.

DOI

[10]
Glover J D, Reganold J P, Bell L W et al., 2010. Increased food and ecosystem security via perennial grains. Science, 328(5986): 1638-1639.

DOI PMID

[11]
Haney N, Cohen S, 2015. Predicting 21st century global agricultural land use with a spatially and temporally explicit regression-based model. Applied Geography, 62: 366-376.

DOI

[12]
Huang H, Zhuo L, Wang R et al., 2021. Agricultural infrastructure: The forgotten key driving force of crop-related water footprints and virtual water flows in China. Journal of Cleaner Production, 309: 127455.

DOI

[13]
Huang Q, Liu Z, He C et al., 2020. The occupation of cropland by global urban expansion from 1992 to 2016 and its implications. Environmental Research Letters, 15(8): 084037.

DOI

[14]
Jia N, Liu J, Kuang W et al., 2018. Spatiotemporal patterns and characteristics of land-use change in China during 2010-2015. Journal of Geographical Sciences, 285(5): 547-562.

[15]
Jiang Q, Deng X, Zhan J et al., 2011. Estimation of land production and its response to cultivated land conversion in North China Plain. Chinese Geographical Science, 21(6): 685-694.

DOI

[16]
Kastner T, Chaudhary A, Gingrich S et al., 2021. Global agricultural trade and land system sustainability: Implications for ecosystem carbon storage, biodiversity, and human nutrition. One Earth, 4(10): 1425-1443.

DOI

[17]
Ke X, van Vliet J, Zhou T et al., 2018. Direct and indirect loss of natural habitat due to built-up area expansion: A model-based analysis for the city of Wuhan, China. Land Use Policy, 74: 231-239.

DOI

[18]
Kuang W, Liu J, Tian H et al., 2021. Cropland redistribution to marginal lands undermines environmental sustainability. National Science Review, 9(1): 1-13.

[19]
Lambin E F, Gibbs H K, Ferreira L et al., 2013. Estimating the world’s potentially available cropland using a bottom-up approach. Global Environmental Change, 23(5): 892-901.

DOI

[20]
Lark T J, Meghan Salmon J, Gibbs H K, 2015. Cropland expansion outpaces agricultural and biofuel policies in the United States. Environmental Research Letters, 10(4): 044003.

DOI

[21]
Li X, Chen Y, 2019. Projecting the future impacts of China’s cropland balance policy on ecosystem services under the shared socioeconomic pathways. Journal of Cleaner Production, 250: 119489.

DOI

[22]
Li Y, Li X, Tan M et al., 2018. The impact of cultivated land spatial shift on food crop production in China, 1990-2010. Land Degradation and Development, 29(6): 1652-1659.

DOI

[23]
Li Z, Tang H, Yang P et al., 2012. Spatio-temporal responses of cropland phenophases to climate change in Northeast China. Journal of Geographical Sciences, 22(1): 29-45.

DOI

[24]
Liang C, Penghui J, Wei C et al., 2015. Farmland protection policies and rapid urbanization in China: A case study for Changzhou City. Land Use Policy, 48: 552-566.

DOI

[25]
Lichtenberg E, Ding C, 2008. Assessing farmland protection policy in China. Land Use Policy, 25(1): 59-68.

DOI

[26]
Liu J, Kuang W, Zhang Z et al., 2014. Spatiotemporal characteristics, patterns, and causes of land-use changes in China since the late 1980s. Journal of Geographical Sciences, 24(2): 195-210.

DOI

[27]
Liu J, Zhang Z, Xu X et al., 2010. Spatial patterns and driving forces of land use change in China during the early 21st century. Journal of Geographical Sciences, 20(4): 483-494.

DOI

[28]
Liu L, Liu Z, Gong J et al., 2019. Quantifying the amount, heterogeneity, and pattern of farmland: Implications for China’s requisition-compensation balance of farmland policy. Land Use Policy, 81: 256-266.

DOI

[29]
Liu L, Xu X, Liu J et al., 2014. Impact of farmland changes on production potential in China during 1990-2010. Journal of Geographical Sciences, 25(1): 19-34.

DOI

[30]
Liu Y, Zhou Y, 2021. Reflections on China’s food security and land use policy under rapid urbanization. Land Use Policy, 109: 105699.

DOI

[31]
Liu Z, Liu Y, Wang J, 2021. A global analysis of agricultural productivity and water resource consumption changes over cropland expansion regions. Agriculture Ecosystems & Environment, 321(34): 107630.

DOI

[32]
Long H, 2014. Land use policy in China: Introduction. Land Use Policy, 40: 1-5.

DOI

[33]
Mamatzakis E C, 2003. Public infrastructure and productivity growth in Greek agriculture. Agricultural Economics, 29(2): 169-180.

DOI

[34]
Mandal D, Chandrakala M, Alam N M et al., 2021. Assessment of soil quality and productivity in different phases of soil erosion with the focus on land degradation neutrality in tropical humid region of India. Catena, 204: 105440.

DOI

[35]
Meyfroidt P, Lambin E F, Erb K H et al., 2013. Globalization of land use: Distant drivers of land change and geographic displacement of land use. Current Opinion in Environmental Sustainability, 5(5): 438-444.

DOI

[36]
Meyfroidt P, Rudel T K, Lambin E F, 2010. Forest transitions, trade, and the global displacement of land use. Proceedings of the National Academy of Sciences of the United States of America, 107(49): 20917-20922.

DOI PMID

[37]
Ning J, Liu J, Kuang W et al., 2018. Spatiotemporal patterns and characteristics of land-use change in China during 2010-2015. Journal of Geographical Sciences, 28(5): 547-562.

DOI

[38]
Ordway E M, Asner G P, Lambin E F, 2017. Deforestation risk due to commodity crop expansion in sub-Saharan Africa. Environmental Research Letters, 12(4): 044015.

DOI

[39]
Pandey B, Seto K C, 2015. Urbanization and agricultural land loss in India: Comparing satellite estimates with census data. Journal of Environmental Management, 148: 53-66.

DOI PMID

[40]
Qin Y, Yan H, Liu J et al., 2013. Impacts of ecological restoration projects on agricultural productivity in China. Journal of Geographical Sciences, 23(3): 404-416.

DOI

[41]
Song W, Liu M, 2017. Farmland conversion decreases regional and national land quality in China. Land Degradation and Development, 28(2): 459-471.

DOI

[42]
Song W, Pijanowski B C, 2013. The effects of China’s cultivated land balance program on potential land productivity at a national scale. Applied Geography, 46: 158-170.

DOI

[43]
Tang L, Ke X, Zhou T et al., 2020. Impacts of cropland expansion on carbon storage: A case study in Hubei, China. Journal of Environmental Management, 265: 110515.

DOI

[44]
van Vliet J, 2019. Direct and indirect loss of natural area from urban expansion. Nature Sustainability, 2(8): 755-763.

DOI

[45]
van Vliet J, Eitelberg D A, Verburg P H, 2017. A global analysis of land take in cropland areas and production displacement from urbanization. Global Environmental Change, 43: 107-115.

DOI

[46]
Wang C, Siriwardana M, Meng S, 2019. Effects of the Chinese arable land fallow system and land-use change on agricultural production and on the economy. Economic Modelling, 79(6): 186-197.

DOI

[47]
Wang L, Zheng W, Tang L et al., 2021. Spatial optimization of urban land and cropland based on land production capacity to balance cropland protection and ecological conservation. Journal of Environmental Management, 285: 112054.

DOI

[48]
Weinzettel J, Hertwich E G, Peters G P et al., 2013. Affluence drives the global displacement of land use. Global Environmental Change, 23(2): 433-438.

DOI

[49]
Xia T, Wu W, Zhou Q et al., 2018. Modeling the spatio-temporal changes in land uses and its impacts on ecosystem services in Northeast China over 2000-2050. Journal of Geographical Sciences, 28(11): 1611-1625.

DOI

[50]
Xu X, Wang L, Cai H et al., 2017. The influences of spatiotemporal change of cultivated land on food crop production potential in China. Food Security, 9(3): 485-495.

DOI

[51]
Yang B, Ke X, van Vliet J et al., 2020. Impact of cropland displacement on the potential crop production in China: a multi-scale analysis. Regional Environmental Change, 20(3): 1-13.

DOI

[52]
Yang Y, Nan Y, Liu Z et al., 2020. Direct and indirect losses of natural habitat caused by future urban expansion in the transnational area of Changbai Mountain. Sustainable Cities and Society, 63: 102487.

DOI

[53]
Yao Z, Zhang L, Tang S et al., 2017. The basic characteristics and spatial patterns of global cultivated land change since the 1980s. Journal of Geographical Sciences, 27(7): 771-785.

DOI

[54]
Yu Q, Xiang M, Wu W et al., 2019. Changes in global cropland area and cereal production: An inter-country comparison. Agriculture, Ecosystems and Environment, 269: 140-147.

[55]
Yu Y, Feng K, Hubacek K, 2013. Tele-connecting local consumption to global land use. Global Environmental Change, 23(5): 1178-1186.

DOI

[56]
Yu Z, Lu C, 2018. Historical cropland expansion and abandonment in the continental US during 1850 to 2016. Global Ecology and Biogeography, 27(3): 322-333.

[57]
Zabel F, Delzeit R, Schneider J M et al., 2019. Global impacts of future cropland expansion and intensification on agricultural markets and biodiversity. Nature Communications, 10(1): 1-10.

DOI

[58]
Zhao G, Liu J, Kuang W et al., 2015. Disturbance impacts of land use change on biodiversity conservation priority areas across China: 1990-2010. Journal of Geographical Sciences, 25(5): 515-529.

DOI

Outlines

/