Spatiotemporal variations of water use efficiency and its driving factors in Inner Mongolia from 2001 to 2020

  • MEI Li , 1 ,
  • TONG Siqin 1, 3 ,
  • YIN Shan 1, 2 ,
  • BAO Yuhai 1, 2 ,
  • HUANG Xiaojun 1, 2 ,
  • ALATENG Tuya 1 ,
  • WANG Yongfang 1 ,
  • GUO Enliang 1 ,
  • YUAN Zhihui 1 ,
  • NASHUN Dalai 1 ,
  • GAO Suriguga 1 ,
  • LIU Xinyi 1 ,
  • YE Zhigang 1
Expand
  • 1. College of Geographical Science, Inner Mongolia Normal University, Hohhot 010022, China
  • 2. Inner Mongolia Key Laboratory of Remote Sensing and Geographic Information Systems, Inner Mongolia Normal University, Hohhot 010022, China
  • 3. Inner Mongolia Key Laboratory of Disaster and Ecological Security on the Mongolian Plateau, Inner Mongolia Normal University, Hohhot 010022, China
*Tong Siqin (1991-), Associate Professor, E-mail:

Mei Li (1992-), PhD Candidate, E-mail:

Received date: 2021-12-08

  Accepted date: 2022-08-25

  Online published: 2023-01-16

Supported by

National Natural Science Foundation of China(42061070)

National Natural Science Foundation of China(61631011)

Science and Technology Fundamental Resources Survey Special Sub-project(2017FY101301-4)

Fundamental Research Funds for the Inner Mongolia Normal University(2022JBBJ013)

Abstract

Water use efficiency (WUE) is an important variable to explore coupled relationships in carbon and water cycles. In this study, we first compared the spatial variations of annual gross primary productivity (GPP) and evapotranspiration (ET) using four GPP and ET products. Second, we selected the products closest to the flux towers data to estimate WUE. Finally, we quantitatively analyzed the impact of climate change and soil water content on WUE. The results showed that: (1) Four GPP and ET products provided good performance, with GOSIF-GPP and FLDAS-ET exhibiting a higher correlation and the smallest errors with the flux tower data. (2) The spatial pattern of WUE is consistent with that of GPP and ET, gradually decreasing from the northeast to the southwest. Higher WUE values appeared in the northeast forest ecosystem, and lower WUE values occurred in the western Gobi Desert, with a value of 0.28 gC m‒2 mm‒1. The GPP and ET products showed an increasing trend, while WUE showed a decreasing trend (55.15%) from 2001 to 2020. (3) The spatial relationship between WUE and driving factors reveal the variations in WUE of Inner Mongolia are mainly affected by soil moisture between 0 and 10 cm (SM0-10cm), vapor pressure deficit (VPD), and precipitation, respectively. (4) In arid regions, VPD and precipitation exhibit a major influence on WUE. An increase in VPD and precipitation has a negative and positive effect on WUE, with threshold values of approximately 0.36 kPa and 426 mm, respectively. (5) In humid regions, SM0-10cm, VPD, SM10-40cm, and SM40-100cm exert a significant impact on WUE, especially SM0-10cm, and weakens with increasing soil depths, these differences may be related to physiological structure and living characteristics of vegetation types in different climate regimes. Our results emphasize the importance of VPD and soil moisture in regional variability in WUE.

Cite this article

MEI Li , TONG Siqin , YIN Shan , BAO Yuhai , HUANG Xiaojun , ALATENG Tuya , WANG Yongfang , GUO Enliang , YUAN Zhihui , NASHUN Dalai , GAO Suriguga , LIU Xinyi , YE Zhigang . Spatiotemporal variations of water use efficiency and its driving factors in Inner Mongolia from 2001 to 2020[J]. Journal of Geographical Sciences, 2023 , 33(1) : 169 -194 . DOI: 10.1007/s11442-023-2078-x

1 Introduction

Water use efficiency (WUE) is defined as the ratio of ecosystem gross primary productivity (GPP) and evapotranspiration (ET), it reflects the coupling of carbon and water cycles in terrestrial ecosystems (Huang et al., 2017; Li et al., 2018c; Yang et al., 2020; Zhao et al., 2020). As an effective indicator for assessing ecological sustainable development, WUE associates carbon and water exchange processes between terrestrial ecosystems and the atmosphere, as well as quantifying how much water an ecosystem uses relative to carbon assimilation (Zhu et al., 2015; Du et al., 2019; Guo et al., 2019a; 2019b; Xu et al., 2020; Zhao et al., 2021), it is crucial to global ecosystem functions, ecosystem services, and ecosystem feedbacks to climate change (Niu et al., 2011; Li et al., 2018c; Liu et al., 2019; Xu et al., 2020). Therefore, a better insight into the variations and regulating mechanisms of WUE would help to achieve regional sustainable development and water resource utilization.
Currently, there are several methods available to estimate WUE, namely eddy covariance (EC), process-oriented ecosystem models (Huang et al., 2016; Yang et al., 2016), and satellite-based remote sensing (Zhang et al., 2015; Zou et al., 2020). Thereinto EC is the standard estimation method with the highest accuracy, but it is limited to the smaller regional scales (Brummer et al., 2012). Models methods depend on the input data and considered parameters and can effectively provide long-term dynamics of WUE over larger regional scales. There are large uncertainties in the model inputs and parameters (Zou et al., 2020). Recently, many studies have employed GPP and ET remote sensing products to estimate WUE (Du et al., 2019; Zou et al., 2020). Satellite remote sensing provides a variety of ET and GPP products with different temporal and spatial characteristics, such as the Moderate-Resolution Imaging Spectroradiometer (MODIS) (Running et al., 2004), the Breathing Earth System Simulator (BESS) (Ryu et al., 2011; Jiang and Ryu, 2016), and the Global Land Surface Satellite (GLASS) products (Yuan et al., 2010). However, these products show great variation due to their different model algorithms, input parameters, and sensors (Li et al., 2021b). Therefore, it is necessary to evaluate the accuracy of GPP and ET products before estimating WUE.
Previous studies have reported that ecosystem WUE may be affected by biotic and abiotic factors such as leaf area index (LAI), precipitation, vapor pressure deficit (VPD), solar radiation, and temperature (Sun et al., 2018; Guo et al., 2019a; Wu et al., 2019; Wang et al., 2020; Zhao et al., 2021). The influence of environmental factors on WUE differs under varying temporal and spatial scales with climate conditions (Song et al., 2017; Du et al., 2019). In arid and semi-arid regions, Sun et al. (2018) and Bai et al. (2020) noted that the variability of WUE was influenced by precipitation. Xu et al. (2021) found that WUE in arid and semi-arid regions of China was positively correlated with precipitation and temperature, while Liu et al. (2019) found that variations in WUE are mostly affected by soil moisture in most regions. Zhang et al. (2022) reported that groundwater depth plays an important role in spatial variations of WUE in arid and semi-arid regions. Given the above studies, it is still disputed as to what are the major factors forcing variations in WUE under the background of climate change.
The arid, semi-arid, and sub-humid regions of China form an ecological fragile belt, while Inner Mongolia, located in northern China, is a typical inland arid and semi-arid region (Mu et al., 2013; Luo et al., 2021). Grassland is one of the widely distributed ecosystems in Inner Mongolia, which play a pivotal role in the global carbon-water cycle and climate systems (Yu et al., 2020; Guo et al., 2021). However, recently the grassland environment has experienced serious damage, such as vegetation degradation, land desertification, and shrinking lakes (John et al., 2013; Tao et al., 2015; Huang et al., 2021), which seriously threaten ecosystem function and socioeconomic development. WUE is a vital property of ecosystem function and an important basis for promoting the sustainable development of regional ecosystems (Du et al., 2019; Guo et al., 2019a; Liu et al., 2019). However, few studies have focused on WUE variability and its driving mechanisms in fragile ecosystems. Therefore, in this work, we take Inner Mongolia as the study region and quantitatively assess the effects of driving factors (climatic change and soil water content) on WUE variations. Specifically, our objectives are: (1) to compare the spatiotemporal patterns of four GPP and ET products, and select products that have good consistency with the flux towers observations data to estimate WUE, (2) to analyze the spatiotemporal variations and trends in WUE, (3) to discuss the impact of climatic factors and soil water content to variations in WUE, and (4) to determine the threshold of the key factors that control changes in WUE.

2 Materials and methods

2.1 Study area

Inner Mongolia (37°24'‒53°23'N, 97°12'‒126°04'E) is located along the northern border of China. Its landscape consists mainly of high plains, and the terrain slopes downward from west to east, with an average altitude of above 1000 m (Figure 1a). Inner Mongolia is an important portion of the Eurasian grasslands (Dai et al., 2016; Li et al., 2018a). Grassland is the major vegetation type of Inner Mongolia, with the different types varying from east to west as forest (11.27% of the total area), meadow steppe (10.31%), typical steppe (18.85%), desert steppe (14.50%), and the Gobi Desert (18.92%), as presented in Figure 1b. Vegetation type data were obtained from a 1:1,000,000 scale vegetation map of Inner Mongolia and rasterized to a spatial resolution of 0.083°. Inner Mongolia has a temperate continental climate, with an annual average temperature ranging between ‒3.15 and 9.8℃ and annual precipitation between 50 and 550 mm based on meteorological stations from 2001 to 2020. We used the humidity region definition from China’s eco-geographical region map of the Institute of Geographic Sciences and Natural Resources Research. According to the annual aridity index (AI), the study area can be divided into humid (AI<1), sub-humid (1<AI<1.49), semi-arid (1.5<AI<4), and arid zones (AI≥4) from east to west. In this study, humid regions include humid and sub-humid zones with an annual aridity index of less than 1.49, while arid regions refer to arid and semi-arid zones with an annual aridity index greater than 1.5 (Figure 1b).
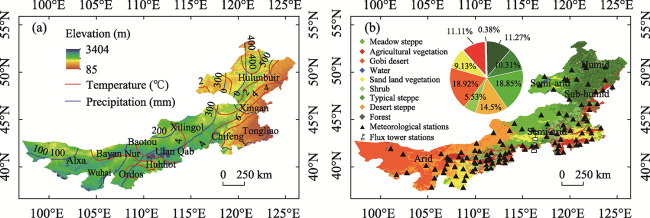
Figure 1 Spatial distributions of annual average temperature and annual precipitation (a), and different vegetation types, flux tower observation stations, meteorological stations, and ecological climatic zones (b) of Inner Mongolia

2.2 Data sources

2.2.1 GPP products

In this study, we employed four GPP products: the global OCO-2-based solar-induced chlorophyll fluorescence product (GOSIF), Global Land Surface Satellite (GLASS), Breathing Earth System Simulator (BESS), and the Moderate Resolution Imaging Spectroradiometer (MODIS) products (Table 1). These four GPP products have been widely used for evaluating carbon sinks and monitoring the vegetation productivity of regional and even global terrestrial ecosystems.
Table 1 Major information on four GPP products is used herein
GPP Products Spatial and temporal resolution Units Year Data source References
GOSIF 0.05°, 8 days gC m‒2d‒1 2000-2020 http://data.globalecology.unh.edu/ 2019a; 2019b
BESS 0.05°, daily gC m‒2d‒1 2000-2017 http://environment.snu.ac.kr/data 2011;
2016
GLASS 0.05°, 8 days gC m‒2d‒1 1982-2018 http://glass.umd.edu 2010
MOD17A2 500 m, 8 days kgC m‒28d‒1 2001-2020 https://ladsweb.modaps.eosdis.nasa.gov/ 2004
(1) GOSIF-GPP
Li and Xiao (2019) based on linear relationships between SIF and GPP to generate a new global GPP product, that is “GOSIF-GPP” (http://data.globalecology.unh.edu/). This product provides 8-daily GPP values with a 0.05° spatial resolution from 2001 to 2020. This product is widely used for the evaluation of vegetation productivity (Li and Xiao, 2019a; 2019b).
(2) GLASS-GPP
The GPP data are produced from the GLASS product generation system, which employs an improved algorithm for the light use efficiency model (EC-LUE), with a spatial resolution of 0.05° and a temporal resolution of 8 days from 1982 to 2018. This data was produced by National Earth System Science Data Center, National Science & Technology Infrastructure of China (http://www.geodata.cn) (Yuan et al., 2010).
(3) BESS-GPP
The BESS GPP dataset was generated from a complex process-based model and driven by multiple modules, which are coupled atmospheric and canopy radiative transfers, canopy photosynthesis, transpiration, and energy balance (Ryu et al., 2011; Jiang and Ryu, 2016). The BESS data was obtained from the Environmental Ecology Lab of Seoul National University (http://environment.snu.ac.kr/data/), with a spatial resolution of 0.05° and temporal resolutions of daily from 2000 to 2017.
(4) MODIS-GPP
The MODIS GPP products (MOD17A2H) adopted a light use efficiency model algorithm using MODIS vegetation indices as input surface vegetation information, with an 8-day composite and a 500 m resolution from 2001 to 2020 (Running et al., 2004). This product is provided by the National Aeronautics and Space Administration (NASA) (https://ladsweb.modaps.eosdis.nasa.gov/). The MODIS product was resampled to a 0.05º spatial resolution using the nearest neighbor methods.

2.2.2 ET products

In this study, we employed four long-time series gridded ET products, namely the Global Land Evaporation Amsterdam Model version 3.5a (GLEAM 3.5a), Famine Early Warning Systems Network (FEWS NET) Land Data Assimilation System (FLDAS), Global Land Data Assimilation System (GLDAS), and the Moderate Resolution Imaging Spectroradiometer (MODIS) products (Table 2).
Table 2 Major information of the four ET products used herein
ET Products Spatial and temporal resolution Units Year Data source References
GLEAM3.5a 0.25°, daily mm d‒1 1981-2020 https://www.gleam.eu/ 2011;
2017
FLDAS 0.1°, monthly kg m‒2s‒1 1982-2020 https://daac.gsfc.nasa.gov/ 2017
GLDAS2.0
GLDAS2.2
0.25°, daily kg m‒2s‒1 2000-2003 2004-2020 https://daac.gsfc.nasa.gov/ 2004
MOD16A2 1 km, 8-daily kg m‒28d‒1 2001-2020 https://ladsweb.modaps.eosdis.nasa.gov/ 2007;
2011
(1) GLEAM-ET
The GLEAM remote sensing product is derived from modified Priestley-Taylor algorithms that separately estimate the different components of ET (i.e., soil evaporation, transpiration, and interception loss). In addition, GLEAM provides surface and root-zone soil moisture, potential evaporation, and evaporative stress conditions (Miralles et al., 2011; Martens et al., 2017). This set of algorithms produces two datasets (GLEAM 3.5a and 3.5b), while in this study, the evaporation estimates from the GLEAM 3.5a datasets were used (https://www.gleam.eu/), which spans from 1981 to 2020 and has a spatial resolution of 0.25° and a temporal resolution of daily.
(2) FLDAS-ET
The FLDAS products (https://daac.gsfc.nasa.gov/) are based on multiple meteorological inputs or use existing land surface models, generated ensembles of soil moisture, ET, and other variables (McNally et al., 2017). The monthly ET datasets cover the period 1982-2020 with a spatial resolution of 0.1°.
(3) GLDAS-ET
The ET data provided by GLDAS is generated by integrating satellite products and ground observational data using advanced land surface modeling and data assimilation techniques (Rodell et al., 2004). Currently, GLDAS has three versions, i.e., GLDAS-2.0, GLDAS-2.1, and GLDAS-2.2. GLDAS-2.0 is forced entirely with the Princeton meteorological input data. GLDAS-2.1 product with a 3-hour temporal resolution is forced by a combination of model and observational data. GLDAS-2.2 product use data assimilation (DA). We selected the GLDAS-2.2 product with a 0.25° spatial resolution and daily temporal coverage for the period from 2003-2020, and the GLDAS-2.0 data to cover the period from 2001 to 2003 (https://daac.gsfc.nasa.gov/).
(4) MODIS-ET
The MODIS ET (MOD16A2) products for the period 2001-2020 were downloaded from NASA (https://ladsweb.modaps.eosdis.nasa.gov/), and are estimated based on the Penman-Monteith model, which uses meteorological reanalysis data and vegetation property dynamics retrieved from MODIS as input variables (Mu et al., 2007; Mu et al., 2011). This is an 8-day cumulative MODIS ET dataset with a 1 km spatial resolution. To make them comparable, the four ET products were resampled to a 0.05° spatial resolution, and their units were uniformly converted into mm/d.

2.2.3 Flux tower observations data

We compiled three flux towers observations data in Inner Mongolia obtained from FLUXNET2015 (http://fluxnet.fluxdata.org/) and ChinaFlux (http://www.chinaflux.org/), respectively, namely Duolun grassland (D01), Duolun Degraded Meadow, and Inner Mongolia sites (Figure 1c and Table S1). Grasslands are these site major vegetation types. The flux towers continuously recorded measurements of net ecosystem exchange (NEE), ecosystem respiration (ER), latent heat flux (LE), and GPP over different time scales. The observed GPP is named GPP_NT_VUT_MEAN (GPP=ER-NEE) in the dataset (Wu et al., 2019; Xu et al., 2020; Yang et al., 2020). However, the observed ET was usually reflected with latent heat flux (Wang et al., 2018). To obtain daily observed ET (mm d‒1), need to be converted from the daily EC latent heat flux (LE, W m‒2) from the two flux tower sites using the following equation (Li et al., 2018b; Ma et al., 2018):
$ET=\frac{LE}{\lambda }$
where λ is the latent heat of vaporization of water (2.45 MJ kg−1).

2.2.4 Climate data

Climatic factors are important variables that affect the photosynthesis and transpiration of plants (Zhao et al., 2021). To explore the impact of climate change on the WUE, the precipitation, vapor pressure deficit (VPD), temperature, and wind speed data were used in this study. The monthly wind speed was extracted from the FLDAS products. The daily precipitation, temperature, and VPD come from 118 meteorological stations distributed across Inner Mongolia and were provided by the China Meteorological Data Network (http://data.cma.cn) for the period 2001-2020. Climate data were interpolated to a 0.05°×0.05° spatial resolution by the kriging methods.

2.2.5 Soil water content data

As a critical source of water for maintaining physiological activity, the dynamics of soil moisture can influence vegetation features such as phenology, productivity, and ET (Luo et al., 2021; Cleverly et al., 2016). Therefore, the most recently developed FLDAS soil moisture products for four different layers, namely 0-10 cm (SM0-10cm), 10-40 cm (SM10-40cm), 40-100 cm (SM40-100cm), and 100-200 cm (SM100-200cm), and terrestrial water storage (TWS) were chosen in this study. The TWS for the period 2001-2020 was derived from the GLDAS (https://daac.gsfc.nasa.gov/). To avoid spatial resolution mismatch, all gridded products were resampled to a spatial resolution of 0.05°.
A set of nine variables, including climate factors, and soil water content, were selected as the drivers of the changes in WUE for the period 2001-2020 (Table 3).
Table 3 Variables as the drivers of the changes in WUE for Inner Mongolia
Variable class Variable name and unit Spatial and temporal resolution Data source
Climate factors Precipitation (mm) 0.05°, daily China Meteorological Data Network (http://data.cma.cn)
Temperature (℃) 0.05°, daily China Meteorological Data Network (http://data.cma.cn)
Vapor pressure deficit (kPa) 0.05°, daily China Meteorological Data Network (http://data.cma.cn)
Wind speed (m/s) 0.1°, monthly FLDAS products (https://daac.gsfc.nasa.gov/)
Soil water content Soil moisture 0-10 cm (m3 m‒3) 0.1°, monthly FLDAS products (https://daac.gsfc.nasa.gov/)
Soil moisture 10-40 cm (m3 m‒3) 0.1°, monthly FLDAS products (https://daac.gsfc.nasa.gov/)
Soil moisture 40-100 cm (m3 m‒3) 0.1°, monthly FLDAS products (https://daac.gsfc.nasa.gov/)
Soil moisture 100-200 cm (m3 m‒3) 0.1°, monthly FLDAS products (https://daac.gsfc.nasa.gov/)
Terrestrial water storage (mm) 0.25°, daily GLDAS product (https://daac.gsfc.nasa.gov/)

2.3 Methods

2.3.1 Ecosystem water use efficiency

WUE (gC m−2 mm‒1) was defined as the ratio of GPP (gC m‒2 yr‒1) to ET (mm yr‒1) at the ecosystem scale (Huang et al., 2016; Ma et al., 2019; Yang et al., 2020; Li et al., 2021a; Tao et al., 2022):
$WUE=\frac{GPP}{ET}$
when WUE is greater than 1, the water loss is less than the carbon assimilation, while for WUE is less than 1, the water loss is greater than the carbon assimilation.

2.3.2 Vapor pressure deficit

VPD is an important atmospheric constraint for affects the water and carbon fluxes (Novick et al., 2016), it refers to the difference between the water vapor pressure in a saturated state and the actual vapor pressure in the air at a certain temperature. It is widely used to measure atmospheric drought extent (Yuan et al., 2019). In this study, the VPD (kPa) was calculated from the relative air humidity and temperature provided by 118 meteorological stations using the following:
$VPD=0.611\times {{e}^{\frac{17.27\times {{T}_{a}}}{{{T}_{a}}+237.3}}}\times \left( 1-\frac{RH}{100} \right)$
where Ta is the temperature (Ta, ℃) and RH is relative humidity (RH, %).

2.3.3 GPP and ET products validation

The reliability and accuracy of four GPP and ET gridded products were validated using flux tower observations data. Four metrics, namely the Pearson correlation coefficient (R, Equation 4), the root mean square error (RMSE, Equation 5), mean absolute error (MAE, Equation 6), and mean bias (Bias, Equation 7), are used to evaluate the agreement between the gridded products values and flux tower observed values at the site scales. The equations are as follows:
$R=\frac{\mathop{\sum }_{i=1}^{n}\left( {{x}_{i}}-\bar{X} \right)\left( {{y}_{i}}-\bar{y} \right)}{\sqrt{\mathop{\sum }_{i=1}^{n}{{\left( {{x}_{i}}-\bar{x} \right)}^{2}}\mathop{\sum }_{i=1}^{n}{{\left( {{y}_{i}}-\bar{y} \right)}^{2}}}}$
$RMSE=\sqrt{\frac{\mathop{\sum }_{i=1}^{n}{{\left( {{x}_{i}}-{{y}_{i}} \right)}^{2}}}{n}}$
$MAE=\underset{i=1}{\overset{n}{\mathop \sum }}\,\left| {{x}_{i}}-{{y}_{i}} \right|$
$Bias=\frac{1}{n}\underset{i=1}{\overset{n}{\mathop \sum }}\,\left( {{x}_{i}}-{{y}_{i}} \right)$
where xi represents the flux tower observed GPP and ET, yi represents the values of GPP and ET from the considered products; $\bar{x}$ and $\bar{y}$ represents the corresponding average values of the observed data and products (GPP or ET), and n is the number of samples.

2.3.4 Partial correlation analysis

In this study, partial correlation analysis was employed to measure the relative importance of GPP or ET to variations in WUE. By controlling for the effects of other variables, we determine the degree of the relationship between two variables as follows:
${{R}_{XY,Z}}=\frac{{{R}_{XY}}-{{R}_{XZ}}{{R}_{YZ}}}{\sqrt{\left( 1-R_{XZ}^{2} \right)\left( 1-R_{YZ}^{2} \right)}}$
where RXY,Z is the partial correlation coefficient between X and Y after removing the effects from Z. RXY, RXZ, and RYZ are the correlation coefficients between X and Y, X and Z, and Y and Z, respectively. If the ratio of the partial correlation coefficient between WUE and GPP to that between WUE and ET is greater than 1, then GPP plays a prominent role. By contrast, if the value is less than 1, it indicates that WUE is mainly driven by ET (Zhao et al., 2021).

2.3.5 Maximum correlation analysis method

To diagnose the key dominant factors of variations in WUE using the maximum correlation coefficient method. The driving factors corresponding to the maximum correlation coefficients (Rmax) can be regarded as the key dominant factors of changes in WUE. The general equation is as follows:
${{R}_{i}}=corr\left( WUE,d{{f}_{i}} \right)$
${{R}_{max}}=Max\left( {{R}_{i}} \right)$
where Ri is the correlation coefficient between the driving factors and WUE, with the driving factors including temperature, precipitation, wind speed, VPD, TWS, SM0-10cm, SM10- 40cm, SM40-100cm, and SM100-200cm; and Rmax is the maximum value of Ri.

3 Results

3.1 Spatial distribution in annual GPP and ET over Inner Mongolia

Figures 2 and 3 display the spatial distribution of the four GPP and ET products over Inner Mongolia for the periods 2001-2017 and 2001-2020, respectively. We found that spatial variation of annual average GPP showed good consistency with ET. The highest and lowest GPP values from four gridded products were found in the northeast forest and western Gobi Desert. The annual GPP of the forest areas in the northeast is greater than 750 gC m‒2 yr‒1, while the annual vegetation productivity of the Gobi Desert in the southwest is less than 150 gC m‒2 yr‒1 (Figure 2). The annual average GPP of the four products was estimated to be between 449.50 and 500.25 gC m‒2 yr‒1 from 2001 to 2017 (MODIS‒GPP boundary as standard). The GPP values quantified by GOSIF and GLASS products are exhibited higher than those quantified by BESS and MODIS products. The four ET products also show a similar spatial distribution pattern (Figure 3), gradually decreasing from the east to west and from south to north, and exhibited latitude and longitude geographical zonality. However, it can be observed that there are obvious differences in the absolute values of the four ET products. The annual ET derived from four products are all highest in the northeast forest (greater than 480 mm yr‒1) and lowest in the southwest Gobi Desert (less than 60 mm yr‒1). Besides, the annual average ET was found to be 336.29 mm yr‒1, 316.41 mm yr‒1, 322.60 mm yr‒1, and 248.26 mm yr‒1 for the GLEAM, GLDAS, FLDAS, and MODIS products, respectively (MODIS‒ET boundary as standard). The ET values from the GLEAM, GLDAS, and FLDAS products are generally greater than those for the MODIS product.
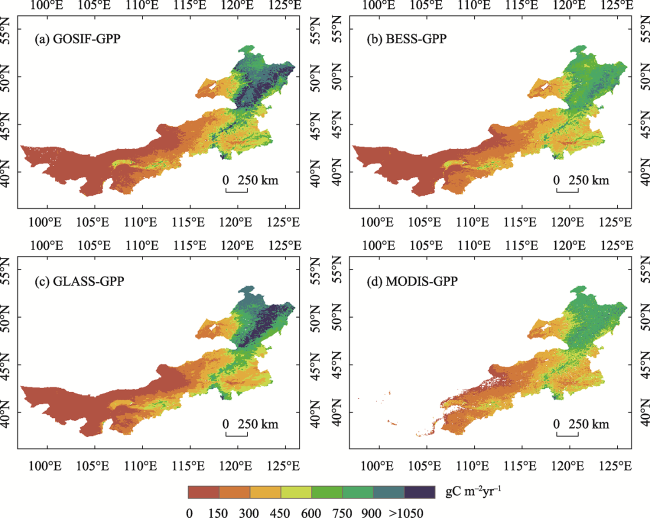
Figure 2 Spatial distributions of annual average GPP over Inner Mongolia during 2001-2017 (a. GOSIF, b. BESS, c. GLASS, d. MODIS products)
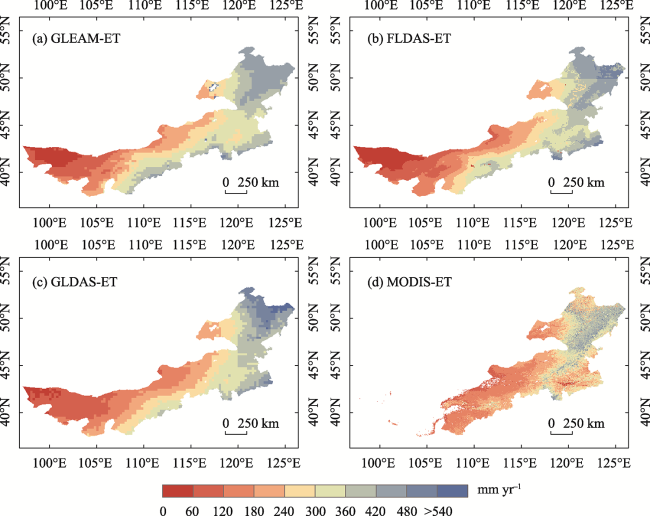
Figure 3 Spatial distributions of annual average ET over Inner Mongolia during 2001-2020 (a. GLEAM, b. FLDAS, c. GLDAS, d. MODIS products)

3.2 Spatiotemporal trends in annual GPP and ET over Inner Mongolia

Spatial distribution of trends in GPP from 2001 to 2017 over Inner Mongolia, as presented in Figure 4. The four GPP products all showed an increasing trend, with the areas corresponding to such a trend for the GOSIF, BESS, MODIS, and GLASS products accounting for 85.23%, 90.27%, 95.33%, and 67.32% of the total area, respectively. Increasing trends are mainly distributed in Mu Us sandy land and eastern Inner Mongolia. However, there are decreasing trends in the north of Chifeng, the east of Xilingol, the central Hulunbuir, and the northwest of Alxa. In terms of the spatial distribution of trends in ET during the period 2001-2020 (Figure 5), the four ET products show obvious differences and similarities. Increasing trends were derived for the ET of the GLEAM, FLDAS, and MODIS products, accounting for 82.96%, 98.01%, and 92.09% of the total area, respectively. And it is mainly located in vast areas of study regions, whereas there is an opposite trend in the GLDAS products, accounting for 58.87% of the total area, mainly distributed in central Inner Mongolia.
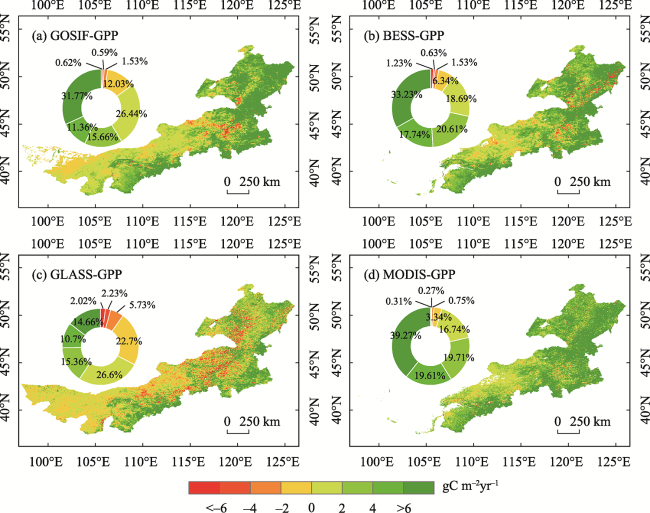
Figure 4 Spatial distributions of trends in annual GPP over Inner Mongolia during 2001-2017 (a. GOSIF, b. BESS, c. GLASS, d. MODIS products)
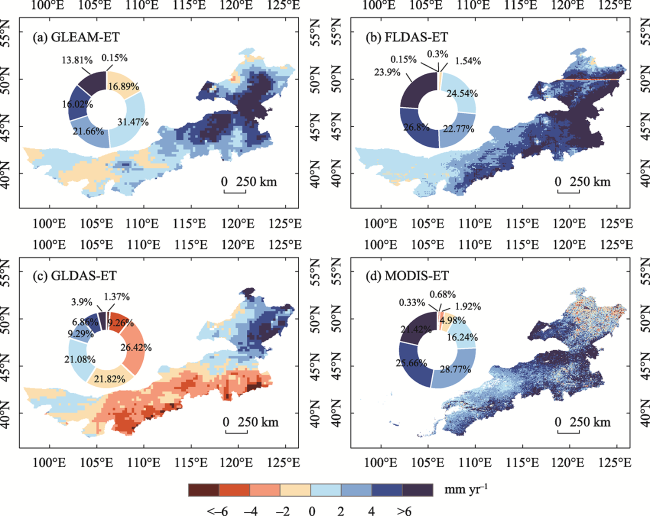
Figure 5 Spatial distributions of trends in annual ET over Inner Mongolia during 2001-2020 (a. GLEAM, b. FLDAS, c. GLDAS, d. MODIS products)
The performance and accuracy of the four GPP and ET products based on observation data at the three flux tower sites were verified (Figures 6 and 7). As shown in Figures 6a-6f, the four GPP products all showed a high correlation with the flux tower GPP. The GOSIF has the best correlations (R2=0.611) compared with the MODIS (R2=0.584), GLASS (R2=0.518), and BESS (R2=0.492) products, as well as the smallest errors. Interestingly, although the GLASS correlation coefficient was greater than that for BESS, the RMSE, MAE, and Bias of the GLASS products were greater than those of the BESS product. Furthermore, we found that all of these four gridded products overestimate GPP, with an average Bias of less than zero, especially the GLASS product with a Bias value of -0.48.
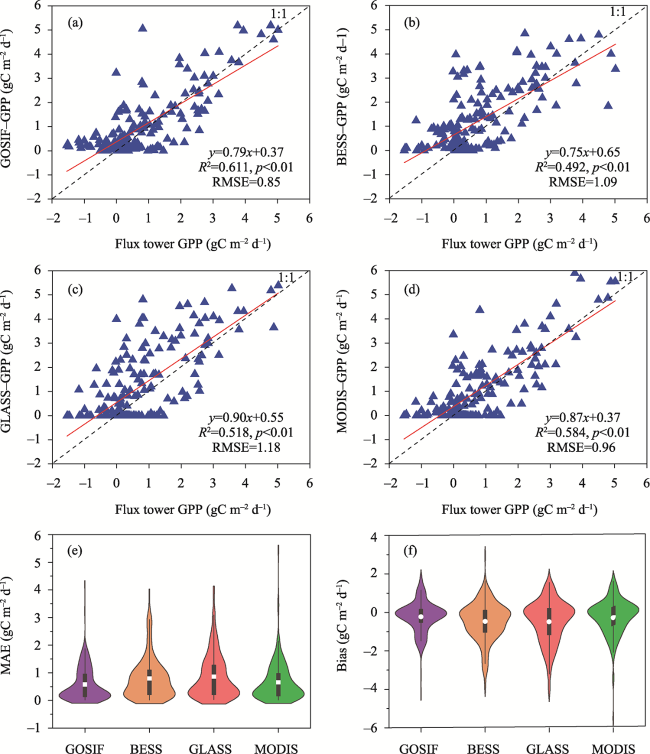
Figure 6 Correlation comparisons of the four GPP products over an 8-daily time scale from 2007 to 2010 (a. GOSIF, b. BESS, c. GLASS, d. MODIS products, e. MAE frequency, f. bias between the four gridded datasets and flux tower GPP)
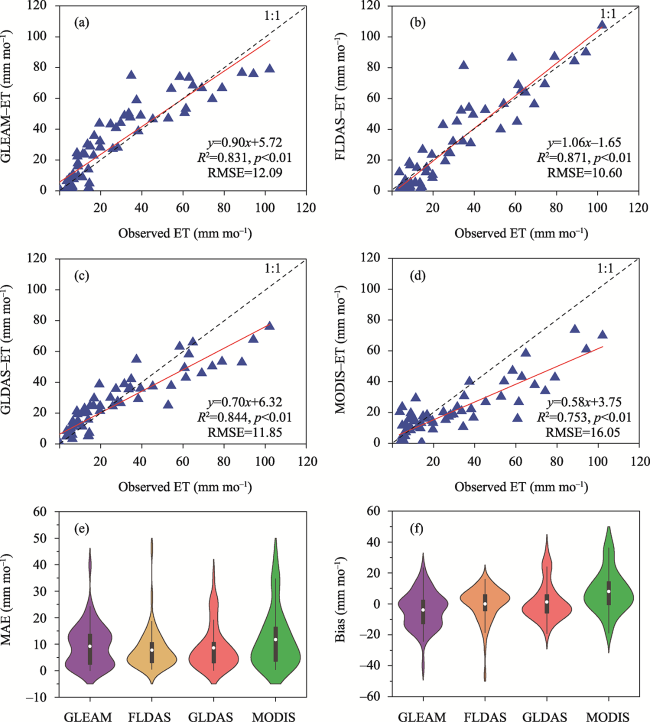
Figure 7 Correlation comparisons of the four ET products over a monthly time scale from 2004 to 2008 (a. GLEAM, b. FLDAS, c. GLDAS, d. MODIS products, e. MAE frequency, f. bias between the four gridded datasets and observed ET)
The ET correlation analysis revealed that the FLDAS has a high correlation with the observed ET (R2=0.871) compared to GLEAM, GLDAS, and MODIS products. The MODIS exhibited a relatively weak correlation and higher errors with observed ET, with an R2 value of 0.753, RMSE, MAE, and Bias values of 16.05, 11.77, and 8.14, respectively (Figures 7a-7f). In addition, GLDAS, MODIS, and FLDAS underestimated the observed ET on a monthly scale with Bias values of 1.23, 8.15, and 0.04, respectively. Whereas GLEAM overestimates ET, with a Bias value of -3.77. Overall, the GOSIF and FLDAS products agreed well with flux tower data than other products, along with the smallest errors. Therefore, the GOSIF and FLDAS products were selected to characterize variations in GPP and ET, and utilize them to estimate WUE.

3.3 Spatiotemporal variations and trends in WUE and drivers

From the spatial pattern of WUE in Inner Mongolia from 2001 to 2020 (Figure 8), it can be seen that the spatial regime of WUE matches well with that of variations in GPP and ET, all showing gradually decreasing values from northeast to the southwest. The annual average WUE in Inner Mongolia during this period was 1.23 gC m‒2 mm‒1, ranging from approximately 0.002 to 4.65 gC m‒2 mm‒1. The high WUE values were mainly in the forest biome across northeast Inner Mongolia, with the average values of 2.19 gC m‒2 mm‒1, followed by meadow steppe (2.05 gC m‒2 mm‒1), cropland (1.44 gC m‒2 mm‒1), shrubs (1.39 gC m‒2 mm‒1), typical steppe (1.22 gC m‒2 mm‒1), sand land vegetation (0.96 gC m‒2 mm‒1), and desert steppe (0.54 gC m‒2 mm‒1), with the lowest WUE values occurred in the western Gobi Desert ecosystem, with a value of 0.28 gC m‒2 mm‒1 (Figure 8c). From 2001 to 2020, the WUE in Inner Mongolia showed a non‒significant decreasing trend with a rate of -0.0016 gC m‒2 mm‒1 a‒1, accounting for 55.15% of the entire region (Figures 8a and 8b). The decreasing WUE was mainly distributed in the north of Xingan, north of Chifeng, central Hulunbuir, east of Xilingol, and northwest of Alxa. In contrast, the WUE in the Ordos, Ulan Qab, Bayan Nur, Baotou, Hohhot, and eastern Alxa regions showed an increasing trend, accounting for 44.85% of Inner Mongolia.
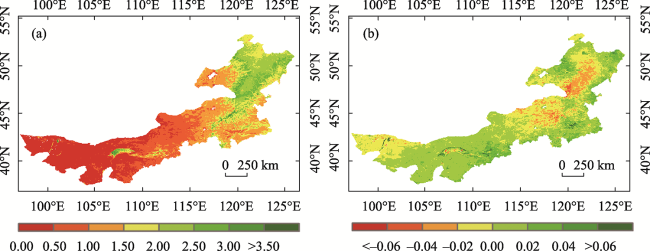
Figure 8 Distribution of annual average WUE (a), trends (b), and different vegetation types (c) of Inner Mongolia from 2001 to 2020. The black dotted line represents the average WUE value for Inner Mongolia.
From 2001 to 2020, the VPD and wind speed of Inner Mongolia showed decreased by -0.002 m s‒1 a‒1 and -0.002 kPa a‒1, respectively. Whereas other driving factors such as soil moisture in different layers, precipitation, TWS, and temperature all showed increasing trends, which implied that characterize the warming and wetting in Inner Mongolia. Among these drivers, the interannual variations in soil moisture of four different layers were well consistent with precipitation, and there are all significantly increasing trends (Figure 9).
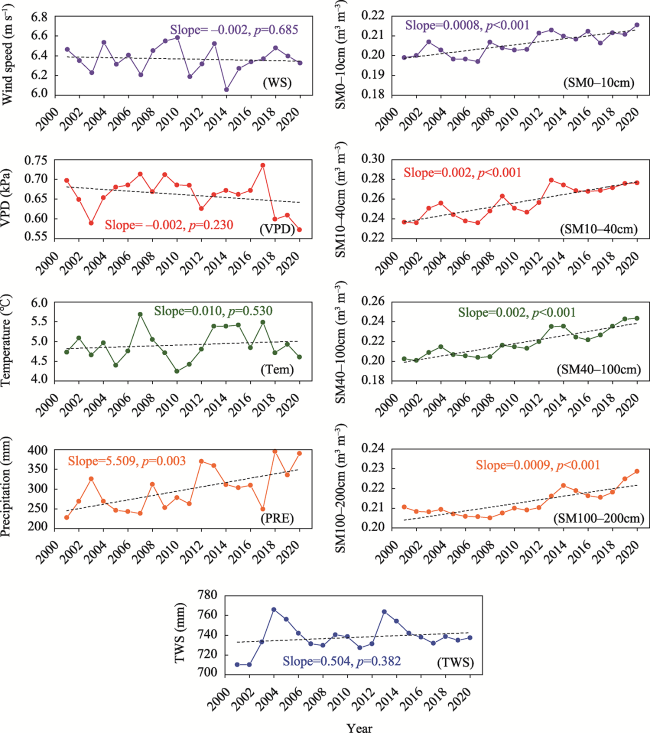
Figure 9 Long-term changes of different driving factors in Inner Mongolia from 2001 to 2020. The black dotted line represents the trend line.

3.4 Relationship between the WUE and driving factors

We found that 59.44% of the WUE pixels (significant in 14.85% of pixels) were positively correlated with precipitation, and are mainly found in central and western Inner Mongolia, this indicates that in these regions increased precipitation leads to increased WUE. Whereas WUE negatively correlated with precipitation in 40.56% of the pixels, with 14.77% of them being statistically significant. This area was mainly distributed in the northeast part of Inner Mongolia (Figure 10). A negative correlation between WUE and VPD was observed in central and western Inner Mongolia accounting for 61.89% of the pixels (significant in 17.85% of pixels), which suggests that these regional WUE values declined with intensified atmospheric drought. By contrast, a positive correlation between WUE and VPD was found mainly in the northeast part of Inner Mongolia, accounting for 38.11% of pixels (significant in 10.13% of pixels, Figure 10). In addition, the WUE was positively correlated with SM of different layers and TWS over central and western Inner Mongolia. However, the WUE was negatively correlated with TWS, SM0-10cm, SM10-40cm, SM40-100cm, and SM100- 200cm over the eastern Inner Mongolia, accounting for 55.48% (14.16%), 56.41% (23.45%), 59.52% (20.70%), 59.08% (17.44%), and 55.03% (9.20%) of the pixels, respectively (Figure 10). This implied that WUE tends to decrease with increasing SM and TWS under relatively wet conditions. Additionally, 52.92% (significant in 1.79%) of wind speed and 55.53% (significant in 5.02%) of temperature pixels were negatively correlated with WUE and were mainly located in the central and western parts of Inner Mongolia, illustrating that the increase in wind speed and temperature had a clear negative effect on WUE.
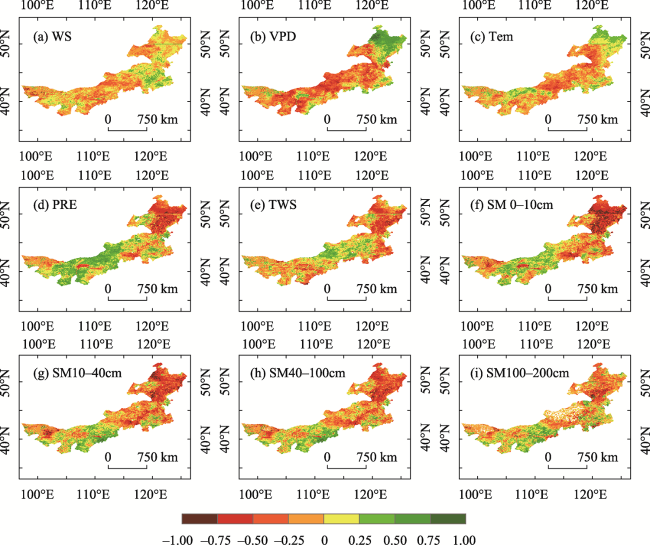
Figure 10 Spatial patterns of the correlations between WUE and driving factors in Inner Mongolia from 2001 to 2020 (a. Wind speed (WS), b. Vapor pressure deficit (VPD), c. Temperature (Tem), d. Precipitation (PRE), e. Terrestrial water storage (TWS), f. Soil moisture 0-10 cm (SM0-10cm), g. Soil moisture 10-40 cm (SM10-40cm), h. Soil moisture 40-100 cm (SM40-100cm), i. Soil moisture 100-200 cm (SM100-200cm))
The spatial pattern of the maximum correlation coefficients (Rmax) between WUE and driving factors can reflect the sensitivity of WUE to the variability of driving factors (Figures 11 and 12). The results illustrate that WUE over Inner Mongolia is most sensitive to SM0-10cm, VPD, and precipitation, with the areas showing significant Rmax accounting for 12.71% (negative), 11.54% (negative), and 7.02% (positive) of Inner Mongolia, respectively (Figure 12a). In humid regions, WUE is closely related to SM0-10cm, VPD, SM10-40cm, and SM40-100cm. The regional WUE is negatively correlated with SM (0-10 cm, 10-40 cm, and 40-100 cm), while positively correlated with VPD, of which the areas with significant Rmax accounted for 41.24%, 15.81%, 9.74%, and 7.71% of the humid regions, respectively. In particular, the SM0-10cm shows a strong negative response to WUE and is weakened with increasing soil depths (Figures 11 and 12b). In arid regions, the WUE is primarily sensitive to changes in VPD and precipitation more than the other factors. The WUE is negatively correlated with VPD, while positively correlated with precipitation, of which the regions with significant Rmax accounted for 13.55% and 8.94% of arid regions, respectively (Figures 11 and 12c). This result reveals that the increase in VPD and precipitation had a negative and positive effect on vegetation WUE under arid conditions. Therefore, when atmospheric drought occurs in arid regions, it has a significant influence on local water resources and productivity.
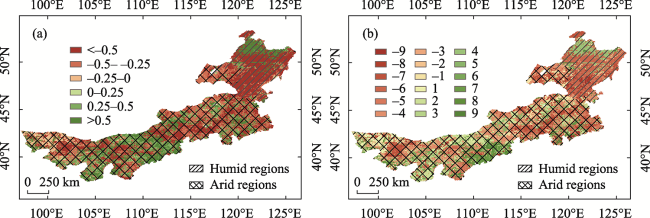
Figure 11 Spatial distributions of maximum correlation coefficients between WUE and driving factors in Inner Mongolia from 2001 to 2020 (a. Maximum correlation coefficients (Rmax), b. Corresponding driving factors (1, 2, 3, …, 9 represent the correlations of WUE with temperature (Tem), precipitation (PRE), wind speed (WS), vapor pressure deficit (VPD), terrestrial water storage (TWS), soil moisture 0-10 cm (SM0-10cm), soil moisture 10-40 cm (SM10-40cm), soil moisture 40-100 cm (SM40-100cm), and soil moisture 100-200 cm (SM100-200 cm), respectively. A negative value denotes a negative maximum correlation, while a positive value indicates a positive maximum correlation in (b).)
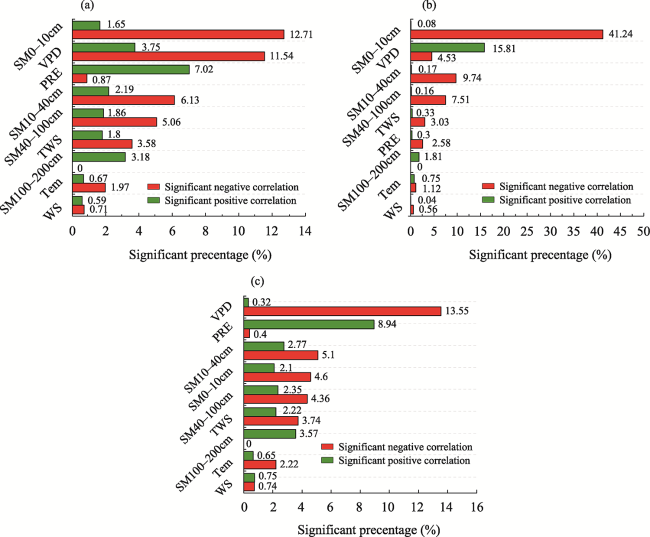
Figure 12 The significance statistics (p<0.05) for the maximum correlation coefficients between WUE and driving factors (a. Entire Inner Mongolia, b. Humid regions, c. Arid regions)

3.5 Determining the threshold of water carbon coupling for vital driving factors

To further explore the specific effects of the key dominating factors (SM0-10cm, VPD, precipitation, SM10-40cm, and SM40-100cm) regulating WUE, the coupling of WUE with the changes in these factors were analyzed. The results show that the relationships between WUE and the key driving factors are non-linear (Figure 13). The WUE along with variations in VPD exhibited an “increase-decrease-increase” model. When VPD was less than 0.36 kPa, WUE and VPD are positively correlated and WUE increased with the increasing VPD. When VPD reached approximately 0.36 kPa, the WUE was at the highest value. When the WUE was greater than 0.36 kPa, WUE and VPD show a significant negative correlation and WUE decreased with the increasing VPD (Slope=-1.231, R2=0.496, p<0.01), while VPD great than 1.1 kPa, the WUE once more showed an increasing trend. For precipitation, when the precipitation in Inner Mongolia was less than 426 mm, there is a significant positive correlation between WUE and precipitation (R2=0.917, p<0.01), the WUE increased with precipitation, where for every 100 mm increase in annual precipitation, WUE increased by 0.5 gC m‒2 mm‒1. When the precipitation was 426 mm, the WUE reached its peak and showed stationary behavior, but precipitation was higher than the 426 mm critical value, WUE decreased with increasing precipitation, decreased by 0.05 gC m‒2 mm‒1 for every 100 mm increase (R2=0.008, p<0.05). The soil moisture was the most important factor for WUE in humid regions. When the soil moisture at a depth of 0-10 cm roughly reached 0.25 m3 m‒3, the regional WUE has the highest peak value. Moreover, we observed that the SM0-10cm and precipitation exhibited relatively consistent variation patterns, this illustrates that precipitation may be made greater contributions to SM0-10cm variations than depth soil moisture (SM10-40cm and SM40-100cm). In addition, we found that depth soil moisture (SM10-40cm and SM40-100cm) variations are relatively complex and exhibited two‒peak distributions. When the soil moisture at a depth of 10-40 cm and 40-100 cm was separately reached 0.28 m3 m‒3 and 0.26 m3 m‒3, the water use efficiency of vegetation reached the maximum value, which indicates that when the soil moisture within this layer arrived at this critical value, it was beneficial to the ecosystem carbon and water exchange.
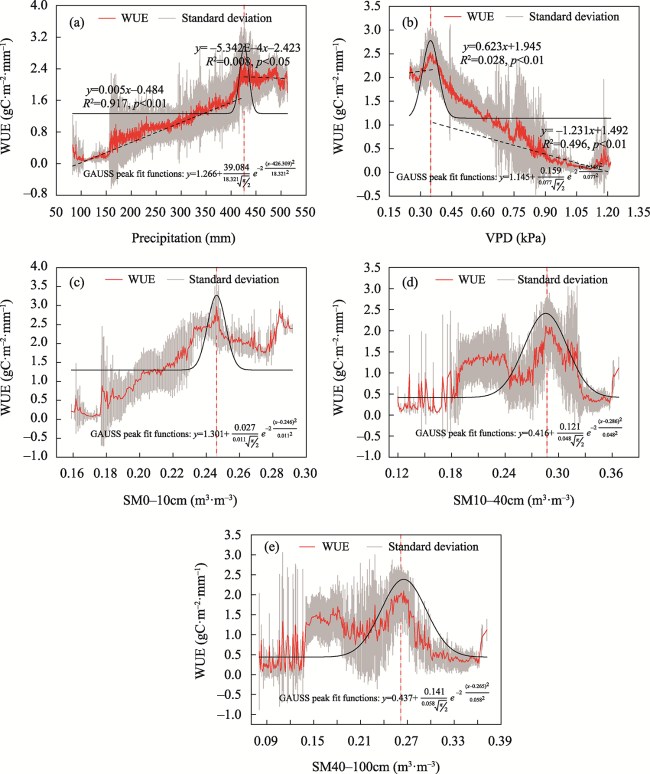
Figure 13 Relationships between WUE and the key dominant factors for Inner Mongolia (a. Precipitation (PRE), b. Vapor pressure deficit (VPD), c. Soil moisture 0-10 cm (SM0-10cm), d. Soil moisture 10-40 cm (SM10-40cm), e. Soil moisture 40-100 cm (SM40-100cm))

4 Discussion

4.1 Evaluation of the griddle GPP and ET datasets

The performance of the WUE depends on the accuracy of both the GPP and ET estimates. Thus, it is necessary to evaluate the reliability and accuracy before using these products (Zhang et al., 2015). Our results show that all gridded products have a good performance. For GPP, the four GPP products generally overestimated GPP at the flux tower sites, of which the overestimation by the GLASS product was the most prominent, with a bias of -0.48. For ET, the GLDAS, MODIS, and FLDAS products underestimated the ET at the flux tower sites, which is in agreement with previous studies for MODIS (Hu et al., 2015; Yang et al., 2021), while GLEAM overestimated the ET at the flux tower sites (Figure 7f). This underestimation or overestimation of GPP and ET may be related to relatively few flux tower observation sites in the study areas and a mismatch between the extraction range of product data and the observation range of flux towers. Our results also revealed that the GLDAS product showed greater uncertainty compared with GLEAM, MODIS, and FLDAS (Figure 5), which may be related to the differences in the employed model algorithms, parameters, and forcing data used to generate the different products. Yao et al. (2018) and Li et al. (2021a) suggested that the ET products quality is affected by the differences in model algorithm and parameterize, as well as the used forcing data. Miralles et al. (2016) found that the GLEAM product has relatively better performance in most vegetation types and climate regimes around the world. To further verify the effectiveness of the WUE, the WUE calculated by the GOSIF-GPP and FLDAS-ET was compared with the WUE calculated by the GOSIF-GPP and GLEAM-ET, the result shows that the spatial distribution of both WUEs has a good consistency (Figure S1).

4.2 Spatial heterogeneity and trends of WUE in Inner Mongolia

Our results show that the WUE in Inner Mongolia decreases from the northeast to the southwest, which result is consistent with Li et al. (2021a). The higher WUE values were found in the high coverage and within humid climatic zones. Lower WUE values were found in the low coverage and within arid and semi-arid climate zones. The WUE of the forest biome is higher than that of meadow steppe, cropland, shrub, typical steppe, and desert steppe, which is consistent with previous research results (Bai et al., 2020; Zhao et al., 2020; Li et al., 2021a). This may be related to physiological characteristics, physiological structure, and living conditions of different vegetation types. Forest had a high carbon sequestration capacity (Xiao et al., 2013). Meanwhile, the canopy closure of the forest causes small variations in the air temperature, ground temperature, and wind speed that did not enhance the ET (Li et al., 2021a). For these reasons, the WUE of the forest is the highest. In addition, we also found that the regional GPP and ET all showed a significant increasing trend, increasing change rate of 5.22 gC m‒2 yr‒1 a‒1 and 4.18 mm yr‒1 a‒1, respectively (Figure S2). But the regional WUE showed a non‒significant decreasing trend with a value of -0.0016 gC m‒2 mm‒1 a‒1 (P=0.491), this decreased WUE may be caused by the synergistic effect of GPP and ET. The regional decreasing trend mainly occurs in the northwest of Alxa, eastern Xilingol, northern Xingan, northern Chifeng, and central Hulunbuir (Figures 8 and S1). This may be related to human activities (e.g., land cover changes) and shifts in species composition or abundance (Liu et al., 2012; Du et al., 2019). For example, WUE declines in the Xilingol region were caused by large-scale open-cut coal mining which results in reduce land surface cover and therefore accelerates ecosystem evapotranspiration processes (Rong et al., 2019). Hence, we suggest should be strengthening the prevention and protection of vegetation in these regions, to prevent the occurred vegetation degradation.

4.3 The driving factors of spatial heterogeneity of WUE in Inner Mongolia

The partial correlation analysis showed that the WUE in the arid and humid region was mostly controlled by ET than GPP (Figure S3). This result is in contrast to prior studies that WUE variability in humid regions was controlled by GPP (Yang et al., 2016; Liu et al., 2019). Our results indicate that precipitation is one of the dominant factors in controlling WUE in arid regions (Figure 10), which is consistent with previous studies (Wagle and Kakani, 2012; Bai et al., 2020). We found that an increase in precipitation has a positive response to WUE in arid regions. This may be caused by an increase in precipitation alleviates water stress and thus improves plant productivity, precipitation maybe was also be consumed by soil evaporation and lead to an increase in ET. However, the increased GPP was higher than ET, result to increase in WUE (Niu et al., 2011; Liu et al., 2015; Guo et al., 2019b). Meanwhile, Zhang et al. (2016) found that changes in GPP are also closely linked to changes in precipitation-induced ET. Increased precipitation in humid regions negatively contributed to WUE. Increased precipitation in humid regions can enhance canopy interception and soil evaporation (Liu et al., 2015). Meanwhile, increased precipitation usually being accompanied by a reduction in temperature and solar radiation, which can restrict vegetation growth and photosynthesis (Mao et al., 2012; Liu et al., 2015), which leads to an increase in ET greater than carbon uptakes to negatively effect on WUE. In addition, we found that the precipitation threshold of about 426 mm, while Liu et al. (2015) found a threshold value of around 500 mm in China areas.
Our results indicate that the VPD is an important determinant for controlling the dynamic changes of WUE, especially in water-limited areas (such as arid regions) where WUE is more sensitive to VPD (that is atmospheric drought) than to soil moisture and precipitation (Figure 12c). It was found that the WUE was negatively correlated with VPD, indicates that the aggravation of atmospheric drought reduces WUE, which may be due to higher VPD leading to dramatic increases in ET, including both soil evaporation and vegetation transpiration (Liu et al., 2015; Wu et al., 2019; Li et al., 2021b). On the other hand, high VPD may cause some stomatal to close and inhibit photosynthetic rates (Novick et al., 2016; Ding et al., 2018; Wu et al., 2019; Li et al., 2021b; Zhao et al., 2021), these effects together may lead to the negative response of VPD to variations in WUE. However, in humid regions, the VPD is positively correlated with WUE, which demonstrates that higher VPD leads to increased WUE. This may be due to the fact that higher VPD can induce stomatal closure to reduce water loss through transpiration, resulting in decreased ET faster than GPP (Liu et al., 2019). There is another possibility that the higher VPD stimulates plant water use strategy and maintain keeps stomata openness of plants to increase GPP (Chen et al., 2021), these reasons may be leads to positive effects of VPD on WUE (Frank et al., 2015; Li et al., 2018c). In addition, our results found a VPD threshold of about 0.36 kPa in Inner Mongolia. However, the VPD in the southwest to northeast aridity gradient over China is a threshold of about 0.8 kPa (Bai et al., 2020). These differences may be caused by the intensity of drought in different regions.
Additionally, we also found that WUE variability in arid regions is regulated by the precipitation and VPD, whereas WUE in humid regions is most affected by soil moisture, in particular SM0-10cm. This difference may be related to the root characteristics and water use strategies of different vegetation types. The arid areas are mostly grassland, and herbaceous plants have relatively shallow root systems, which limits the obtaining of water from groundwater sources, and thus they are more sensitive to precipitation (Liu et al., 2012; Bai et al., 2019). In humid areas, the vegetation types are mostly forest, cropland, and shrubs, and these have deeper root systems, with their water supplied by soil moisture from the capillary fringe, root zone, and groundwater (Liu et al., 2012). Previous studies have shown that excessive soil water content can cause root zone hypoxia and results in the down-regulation of stomatal conductance and photosynthesis (Li et al., 2018c). Excessive soil water input can also promote a significant increase in abiotic water consumption (Liu et al., 2019), which leads to an increase in ET greater than carbon uptakes to negatively affect WUE. In short, the response of WUE to various factors was different among different vegetation types and climate zones.

4.4 Uncertainties and future studies

We validated the accuracy of four GPP and ET products using measurement data from three flux tower sites. Although all gridded products have a good performance, there are still some uncertainties in this study. First, the spatial resolutions of the multi-source remote sensing products were not exactly the same, using different resolution products could lead to uncertainties in the expected results. Second, uncertainties would arise from a mismatch between the extraction range of the product data and the observation range of flux towers. Third, there is relatively little flux tower observation data in the study area, which leads to large uncertainties in the accuracy of the evaluation products. In this study, we only discussed the effect of both climate change and soil water content on the variability of WUE. However, the WUE of ecosystems is affected by many other factors including Leaf area index (LAI) (Huang et al., 2010), drought (Ma et al., 2019), CO2 fertilization (Wu et al., 2019; Liu et al., 2020), stomatal conductance (Xu et al., 2020), and land cover change (Li et al., 2021a). Therefore, it is necessary to further explore other factors affecting the WUE. Our study also points out that VPD and soil moisture acts as important environmental factors for understanding carbon-water coupling in Inner Mongolia. Therefore, in the future, to furthermore consider VPD and soil moisture in predicting and simulating terrestrial ecosystem responses to future climate change.

5 Conclusions

Ecosystem WUE is a vital indicator to explore the interactions between carbon and water cycles in terrestrial ecosystems, and accurate estimates of ecosystem WUE can contribute to quantifying the carbon-water exchange of ecosystem function under climate change. The result shows that the spatial pattern of four GPP and ET products gradually decreases from the northeast to the southwest. Meanwhile, an increasing trend for all GPP and ET products over the study area except for the ET estimated from GLDAS products. Using flux tower observations data validated four GPP and ET products found that GOSIF and FLDAS have a good performance and therefore utilize them to estimate WUE. The spatially WUE showed decreasing trends accounting for 55.15% of the entire region, where distributed in the north of Xingan, north of Chifeng, central Hulunbuir, east of Xilingol, and northwest of Alxa. In addition, the results revealed that the SM0-10cm, VPD, and precipitation play an important role in regulating variations in WUE over Inner Mongolia. In arid regions, the WUE is mostly controlled by VPD and precipitation. An increase in VPD and precipitation has negative and positive effects on WUE. In humid regions, variations in WUE are closely associated with SM0-10cm, VPD, SM10-40cm, and SM40-100cm, in which SM0-10cm has the most negative influence on WUE and is weakened with soil depth. These findings improve our understanding of arid and semi-arid region WUE variability and its driving mechanisms and provide vital insight into predicting the feedback from ecosystems to climate change.
Table S1 Descriptions of the flux tower sites in this study
Site ID Nation Site name Vegetation types Longitude (°E) Latitude (°N) Period
CN-Du2 China Duolun grassland (D01) Steppe 116.2836 42.0467 2006-2008
CN-Du3 China Duolun degraded meadow Steppe 116.2809 42.0551 2009-2010
China Inner Mongolia Steppe 116.404 43.3255 2004-2005
Figure S1 Based on GOSIF-GPP and GLEAM-ET obtained average WUE (a) and trends (b) over Inner Mongolia for the period 2001-2020
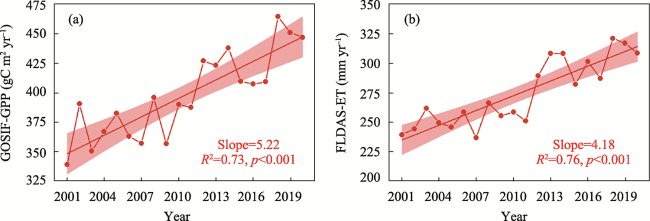
Figure S2 Interannual variations in GOSIF-GPP (a) and FLDAS-ET (b) across Inner Mongolia during 2001-2020
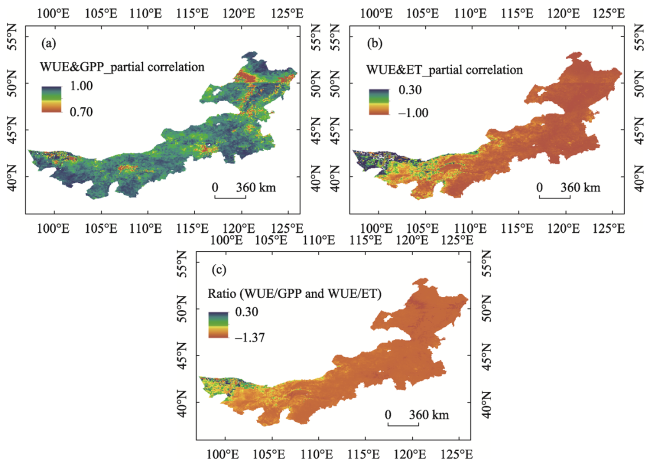
Figure S3 Spatial pattern of the partial correlation coefficient between WUE and GPP (a), WUE and ET (b), and their ratio (c) in Inner Mongolia from 2001 to 2020
[1]
Bai J, Shi H, Yu Q et al., 2019. Satellite-observed vegetation stability in response to changes in climate and total water storage in central Asia. The Science of the Total Environment, 659: 862-871.

DOI PMID

[2]
Bai Y J, Zha T S, Bourque C P-A et al., 2020. Variation in ecosystem water use efficiency along a southwest-to-northeast aridity gradient in China. Ecological Indicators, 110: 105932.

DOI

[3]
Brümmer C, Black T A, Jassal R S et al., 2012. How climate and vegetation type influence evapotranspiration and water use efficiency in Canadian forest, peatland and grassland ecosystems. Agricultural and Forest Meteorology, 153: 14-30.

DOI

[4]
Chen N, Song C C, Xu X F et al., 2021. Divergent impacts of atmospheric water demand on gross primary productivity in three typical ecosystems in china. Agricultural and Forest Meteorology, 307: 108527.

DOI

[5]
Cleverly J, Eamus D, Restrepo Coupe N et al., 2016. Soil moisture controls on phenology and productivity in a semi-arid critical zone. Science of The Total Environment, 568: 1227-1237.

DOI

[6]
Dai E F, Huang Y, Wu Z et al., 2016. Analysis of spatio-temporal features of a carbon source/sink and its relationship to climatic factors in the Inner Mongolia grassland ecosystem. Journal of Geographical Sciences, 26(3): 297-312.

DOI

[7]
Ding J Z, Yang T, Zhao Y T et al., 2018. Increasingly important role of atmospheric aridity on Tibetan alpine grasslands. Geophysical Research Letters, 45(6): 2852-2859.

DOI

[8]
Du X Z, Zhao X, Zhou T et al., 2019. Effects of climate factors and human activities on the ecosystem water use efficiency throughout northern China. Remote Sensing, 11(23): 2766.

DOI

[9]
Frank D C, Poulter B, Saurer M et al., 2015. Water-use efficiency and transpiration across European forests during the Anthropocene. Nature Climate Change, 5(6): 579-583.

[10]
Guo L M, Shan N, Zhang Y G et al., 2019a. Separating the effects of climate change and human activity on water use efficiency over the Beijing-Tianjin sand source region of China. Science of The Total Environment, 690: 584-595.

DOI

[11]
Guo L M, Sun F B, Liu W B et al., 2019b. Response of ecosystem water use efficiency to drought over China during 1982-2015: Spatiotemporal variability and resilience. Forests, 10(7): 598.

DOI

[12]
Guo D, Song X N, Hu R H et al., 2021. Grassland type-dependent spatiotemporal characteristics of productivity in Inner Mongolia and its response to climate factors. Science of The Total Environment, 775: 145644.

DOI

[13]
Hu G C, Jia L, Menenti M, 2015. Comparison of MOD16 and LSA-SAF MSG evapotranspiration products over Europe for 2011. Remote Sensing of Environment, 156: 510-526.

DOI

[14]
Huang L, He B, Han L et al., 2017. A global examination of the response of ecosystem water-use efficiency to drought based on MODIS data. Science of the Total Environment, 601: 1097-1107.

[15]
Huang L, Ning J, Zhu P et al., 2021. The conservation patterns of grassland ecosystem in response to the forage-livestock balance in North China. Journal of Geographical Sciences, 31(4): 518-534.

DOI

[16]
Huang M T, Piao S L, Zeng Z Z et al., 2016. Seasonal responses of terrestrial ecosystem water-use efficiency to climate change. Global Change Biology, 22(6): 2165-2177.

DOI PMID

[17]
Huang X, Hao Y, Wang Y et al., 2010. Partitioning of evapotranspiration and its relation to carbon dioxide fluxes in Inner Mongolia steppe. Journal of Arid Environments, 74(12): 1616-1623.

DOI

[18]
Jiang C Y, Ryu Y, 2016. Multi-scale evaluation of global gross primary productivity and evapotranspiration products derived from breathing earth system simulator (BESS). Remote Sensing of Environment, 186: 528-547.

DOI

[19]
John R, Chen J Q, Ouyang Z T et al., 2013. Vegetation response to extreme climate events on the Mongolian plateau from 2000 to 2010. Environmental Research Letters, 8(3): 035033.

DOI

[20]
Li G C, Chen W, Li R R et al., 2021a. Assessing the spatiotemporal dynamics of ecosystem water use efficiency across China and the response to natural and human activities. Ecological Indicators, 126: 107680.

DOI

[21]
Li N, Na R S, Zhang J Q et al., 2018a. Vegetation dynamics and diverse responses to extreme climate events in different vegetation types of Inner Mongolia. Atmosphere, 9(10): 394.

DOI

[22]
Li S J, Wang G J, Sun S L et al., 2018b. Assessment of multi-source evapotranspiration products over China using eddy covariance observations. Remote Sensing, 10(11): 1692.

DOI

[23]
Li S J, Wang G J, Sun S L et al., 2021b. Long-term changes in evapotranspiration over China and attribution to climatic drivers during 1980-2010. Journal of Hydrology, 595: 126037.

DOI

[24]
Li X, Xiao J F, 2019a. A global, 0.05-degree product of solar-induced chlorophyll fluorescence derived from OCO-2, MODIS, and reanalysis data. Remote Sensing, 11(5): 517.

DOI

[25]
Li X, Xiao J F, 2019b. Mapping photosynthesis solely from solar-induced chlorophyll fluorescence: A global, fine-resolution dataset of gross primary production derived from OCO-2. Remote Sensing, 11(21): 2563.

DOI

[26]
Li Y, Shi H, Zhou L et al., 2018c. Disentangling climate and LAI effects on seasonal variability in water use efficiency across terrestrial ecosystems in China. Journal of Geophysical Research: Biogeosciences, 123(8): 2429-2443.

[27]
Liu N, Kala J, Liu S R et al., 2020. Drought can offset potential water use efficiency of forest ecosystems from rising atmospheric CO2. Journal of Environmental Sciences, 90: 262-274.

DOI

[28]
Liu R, Pan L P, Jenerette G D et al., 2012. High efficiency in water use and carbon gain in a wet year for a desert halophyte community. Agricultural and Forest Meteorology, 162: 127-135.

[29]
Liu X F, Feng X M, Fu B J, 2019. Changes in global terrestrial ecosystem water use efficiency are closely related to soil moisture. Science of The Total Environment, 698: 134165.

DOI

[30]
Liu Y B, Xiao J F, Ju W M et al., 2015. Water use efficiency of China’s terrestrial ecosystems and responses to drought. Scientific Reports, 5(1): 1-12.

[31]
Luo M, Meng F H, Sa C L et al., 2021. Response of vegetation phenology to soil moisture dynamics in the Mongolian Plateau. Catena, 206: 105505.

DOI

[32]
Ma J, Xiao X M, Zhang Y et al., 2018. Spatial-temporal consistency between gross primary productivity and solar-induced chlorophyll fluorescence of vegetation in China during 2007-2014. Science of The Total Environment, 639: 1241-1253.

DOI

[33]
Ma J Y, Jia X, Zha T S et al., 2019. Ecosystem water use efficiency in a young plantation in northern China and its relationship to drought. Agricultural and Forest Meteorology, 275: 1-10.

DOI

[34]
Mao D H, Wang Z M, Luo L et al., 2012. Integrating AVHRR and MODIS data to monitor NDVI changes and their relationships with climatic parameters in Northeast China. International Journal of Applied Earth Observation and Geoinformation, 18: 528-536.

DOI

[35]
Martens B, Miralles D G, Lievens H et al., 2017. GLEAM v3: Satellite-based land evaporation and root-zone soil moisture. Geoscientific Model Development, 10(5): 1903-1925.

DOI

[36]
McNally A, Arsenault K, Kumar S et al., 2017. A land data assimilation system for sub-Saharan Africa food and water security applications. Scientific Data, 4(1): 1-19.

[37]
Miralles D G, Holmes T R H, De Jeu R A M et al., 2011. Global land-surface evaporation estimated from satellite-based observations. Hydrology and Earth System Sciences, 15(2): 453-469.

DOI

[38]
Miralles D G, Jiménez C, Jung M et al., 2016. The WACMOS-ET project (Part 2): Evaluation of global terrestrial evaporation datasets. Hydrology and Earth System Sciences, 20(2): 823-842.

DOI

[39]
Mu Q Z, Heinsch F A, Zhao M S et al., 2007. Development of a global evapotranspiration algorithm based on MODIS and global meteorology data. Remote Sensing of Environment, 111(4): 519-536.

DOI

[40]
Mu Q Z, Zhao M S, Running S W, 2011. Improvements to a MODIS global terrestrial evapotranspiration algorithm. Remote Sensing of Environment, 115(8): 1781-1800.

DOI

[41]
Mu S J, Yang H F, Li J L et al., 2013. Spatio-temporal dynamics of vegetation coverage and its relationship with climate factors in Inner Mongolia, China. Journal of Geographical Sciences, 23(2): 231-246.

DOI

[42]
Niu S L, Xing X R, Zhang Z et al., 2011. Water-use efficiency in response to climate change: From leaf to ecosystem in a temperate steppe. Global Change Biology, 17(2): 1073-1082.

DOI

[43]
Novick K A, Ficklin D L, Stoy P C et al., 2016. The increasing importance of atmospheric demand for ecosystem water and carbon fluxes. Nature Climate Change, 6(11): 1023-1027.

DOI

[44]
Rodell M, Houser P R, Jambor U et al., 2004. The global land data assimilation system. Bulletin of the American Meteorological Society, 85(3): 381-394.

DOI

[45]
Rong A, Bi Q G, Dong Z H, 2019. Change of grassland vegetation and driving factors based on MODIS/NDVI in Xilingol, China. Resources Science, 41(7): 1374-1386. (in Chinese)

DOI

[46]
Running S W, Nemani R R, Heinsch F A et al., 2004. A continuous satellite-derived measure of global terrestrial primary production. Bioscience, 54(6): 547-560.

DOI

[47]
Ryu Y, Baldocchi D D, Kobayashi H et al., 2011. Integration of MODIS land and atmosphere products with a coupled-process model to estimate gross primary productivity and evapotranspiration from 1 km to global scales. Global Biogeochemical Cycles, 25(4): 1-24.

[48]
Song Q H, Fei X H, Zhang Y P et al., 2017. Water use efficiency in a primary subtropical evergreen forest in Southwest China. Scientific Reports, 7(1): 1-10.

DOI

[49]
Sun S B, Song Z L, Wu X C et al., 2018. Spatio-temporal variations in water use efficiency and its drivers in China over the last three decades. Ecological Indicators, 94: 292-304.

DOI

[50]
Tao J, Zhu J T, Zhang Y J et al., 2022. Divergent effects of climate change on cropland ecosystem water use efficiency at different elevations in southwestern China. Journal of Geographical Sciences, 32(8): 1601-1614.

DOI

[51]
Tao S L, Fang J Y, Zhao X et al., 2015. Rapid loss of lakes on the Mongolian Plateau. Proceedings of the National Academy of Sciences, 112(7): 2281-2286.

DOI

[52]
Wagle P, Kakani V G, 2012. Growing season variability in evapotranspiration, ecosystem water use efficiency, and energy partitioning in switchgrass. Ecohydrology, 7(1): 64-72.

DOI

[53]
Wang L M, Li M Y, Wang J et al., 2020. An analytical reductionist framework to separate the effects of climate change and human activities on variation in water use efficiency. Science of The Total Environment, 727: 138306.

DOI

[54]
Wang M J, Chen Y H, Wu X C et al., 2018. Forest-type-dependent water use efficiency trends across the Northern Hemisphere. Geophysical Research Letters, 45(16): 8283-8293.

DOI

[55]
Wu X C, Li X Y, Chen Y H et al., 2019. Atmospheric water demand dominates daily variations in water use efficiency in alpine meadows, northeastern Tibetan Plateau. Journal of Geophysical Research: Biogeosciences, 124(7): 2174-2185.

[56]
Xiao J, Sun G, Chen J X et al., 2013. Carbon fluxes, evapotranspiration, and water use efficiency of terrestrial ecosystems in China. Agricultural and Forest Meteorology, 182: 76-90.

[57]
Xu H, Zhang Z Q, Xiao J F et al., 2020. Environmental and canopy stomatal control on ecosystem water use efficiency in a riparian poplar plantation. Agricultural and Forest Meteorology, 287: 107953.

DOI

[58]
Xu Q C, 2021. Spatiotemporal variation of water use efficiency and its influencing factors in arid and semi-arid areas of China. Geographical Science Research, 10(2): 126-136. (in Chinese)

DOI

[59]
Yang S S, Zhang J H, Han J Q et al., 2021. Evaluating global ecosystem water use efficiency response to drought based on multi-model analysis. Science of The Total Environment, 778: 146356.

DOI

[60]
Yang S S, Zhang J H, Zhang S et al., 2020. The potential of remote sensing-based models on global water-use efficiency estimation: An evaluation and intercomparison of an ecosystem model (BESS) and algorithm (MODIS) using site level and upscaled eddy covariance data. Agricultural and Forest Meteorology, 287: 107959.

DOI

[61]
Yang Y T, Guan H D, Batelaan O et al., 2016. Contrasting responses of water use efficiency to drought across global terrestrial ecosystems. Scientific Reports, 6(1): 1-8.

DOI

[62]
Yao Y T, Wang X H, Li Y et al., 2018. Spatiotemporal pattern of gross primary productivity and its covariation with climate in China over the last thirty years. Global Change Biology, 24(1): 184-196.

DOI PMID

[63]
Yu S, Jiang L, Du W L et al., 2020. Estimation and spatio-temporal patterns of carbon emissions from grassland fires in Inner Mongolia, China. Journal of Geographical Sciences, 30(4): 572-587.

[64]
Yuan W P, Liu S G, Yu G R et al., 2010. Global estimates of evapotranspiration and gross primary production based on MODIS and global meteorology data. Remote Sensing of Environment, 114(7): 1416-1431.

DOI

[65]
Yuan W P, Zheng Y, Piao S L et al., 2019. Increased atmospheric vapor pressure deficit reduces global vegetation growth. Science Advances, 5(8): eaax1396.

DOI

[66]
Zhang H Y, Zhan C S, Xia J et al., 2022. The role of groundwater in the spatio-temporal variations of vegetation water use efficiency in the Ordos Plateau, China. Journal of Hydrology, 605: 127332.

DOI

[67]
Zhang L, Tian J, He H L et al., 2015. Evaluation of water use efficiency derived from MODIS products against eddy variance measurements in China. Remote Sensing, 7(9): 11183-11201.

DOI

[68]
Zhang Y, Xiao X M, Guanter L et al., 2016. Precipitation and carbon-water coupling jointly control the interannual variability of global land gross primary production. Scientific Reports, 6(1): 1-9.

DOI

[69]
Zhao J X, Feng H Z, Xu T R et al., 2021. Physiological and environmental control on ecosystem water use efficiency in response to drought across the northern hemisphere. Science of the Total Environment, 758: 143599.

DOI

[70]
Zhao J X, Xu T R, Xiao J F et al., 2020. Responses of water use efficiency to drought in southwest China. Remote Sensing, 12(1): 199.

DOI

[71]
Zhu X J, Yu G R, Wang Q F et al., 2015. Spatial variability of water use efficiency in China’s terrestrial ecosystems. Global Planet Change, 129: 37-44.

DOI

[72]
Zou J, Ding J L, Welp M et al., 2020. Assessing the response of ecosystem water use efficiency to drought during and after drought events across central Asia. Sensors, 20(3): 581.

DOI

Outlines

/