
Journal of Geographical Sciences >
Divergent responses of Qinghai spruce (Picea crassifolia) to recent warming along elevational gradients in the central Qilian Mountains, Northwest China
|
Zhang Weiguo (1990-), PhD, E-mail: zhangwg18@lzu.edu.cn |
Received date: 2022-04-25
Accepted date: 2022-08-11
Online published: 2023-01-16
Supported by
National Natural Science Foundation of China(41790422)
The Second Tibetan Plateau Scientific Expedition and Research Program(STEP)
No.2019QZKK0301(2019QZKK0301)
The National Key Research & Development (R&D) Program of China(2019YFC0507401)
National Natural Science Foundation of China(41801018)
The 111 Project(BP0618001)
The Foundation for Excellent Youth Scholars of “Northwest Institute of Eco-Environment and Resources”, CAS(FEYS2019004)
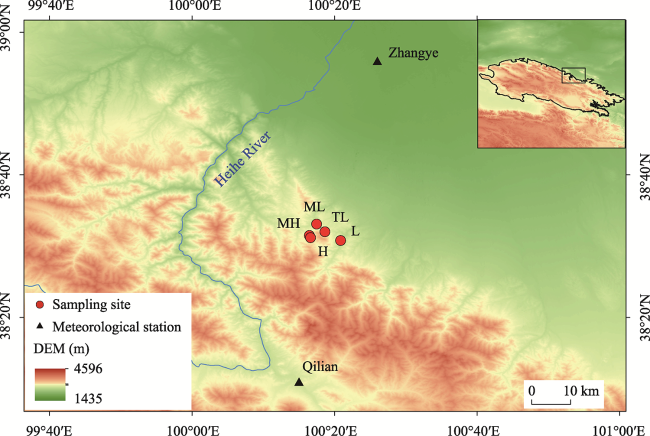
Understanding the radial growth trends of trees and their response to recent warming along elevation gradients is crucial for assessing how forests will be impacted by future climate change. Here, we collected 242 tree-ring cores from five plots across the Qinghai spruce (Picea crassifolia Kom.) forest belt (2600-3350 m a.s.l.) in the central Qilian Mountains, Northwest China, to study trends in the radial growth of trees and their response to climate factors with variable elevation. All the sampled P. crassifolia chronologies showed an increasing trend in the radial growth of trees at higher altitudes (3000-3350 m), whereas the radial growth of trees at lower altitudes (2600-2800 m) has decreased in recent decades. The radial growth of trees was limited by precipitation at lower elevations (L, ML), but mainly by temperature at higher elevation sites (MH, H, TL). Climate warming has caused an unprecedented increase in the radial growth of P. crassifolia at higher elevations. Our results suggest that ongoing climate warming is beneficial to forest ecosystems at high elevations but restricts the growth of forest ecosystems at low elevations.
ZHANG Weiguo , GOU Xiaohua , ZHANG Fen , LIU Wenhuo , ZHANG Yun , GAO Linlin . Divergent responses of Qinghai spruce (Picea crassifolia) to recent warming along elevational gradients in the central Qilian Mountains, Northwest China[J]. Journal of Geographical Sciences, 2023 , 33(1) : 151 -168 . DOI: 10.1007/s11442-023-2077-y
Figure 1 Location of the sampling sites of Picea crassifolia in the central Qilian Mountains and the meteorological station nearby (L: Low altitude sampling site; ML: Middle-Low altitude sampling site; MH: Middle-High altitude sampling site; H: High altitude sampling site; TL: Timberline sampling site) |
Table 1 Description of the sampling sites of P. crassifolia in the central Qilian Mountains |
| Sites | Longitude (E) | Latitude (N) | Altitude (m a.s.l.) | Slope (°) | Aspect (°) |
|---|---|---|---|---|---|
| L | 100.35° | 38.51° | 2602 | 31 | 25 |
| ML | 100.29° | 38.55° | 2811 | 31 | 57 |
| MH | 100.27° | 38.52° | 3029 | 22 | 350 |
| H | 100.28° | 38.52° | 3218 | 31 | 358 |
| TL | 100.31° | 38.53° | 3354 | 28 | 45 |
L: Low altitude sampling site, ML: Middle-Low altitude sampling site; MH: Middle-High altitude sampling site, H: High altitude sampling site, TL: Timberline sampling site. |
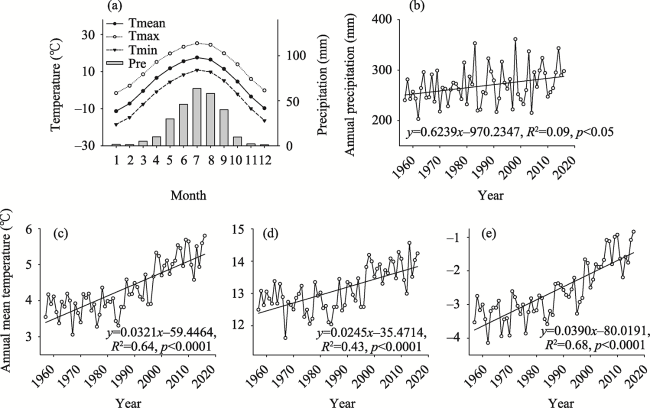
Figure 2 Climate data from the Zhangye and Qilian meteorological stations (1957-2016) (a. Monthly mean climate data; b. The trend of annual total precipitation; c. The trend of annual mean temperature; d. The trend of annual mean maximum temperature; e. The trend of annual mean minimum temperature) |
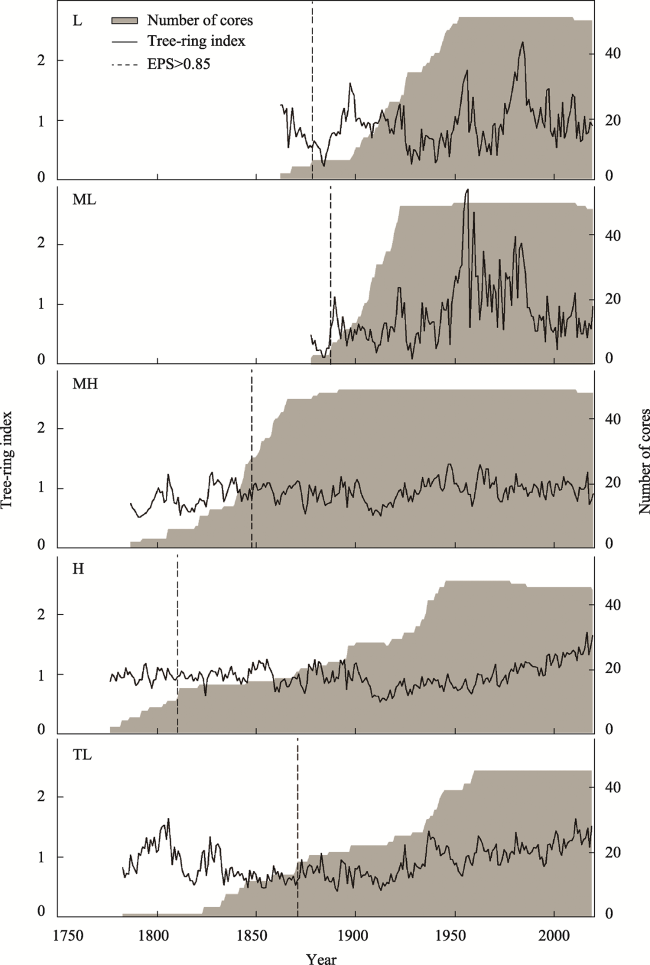
Figure 3 Standard chronologies and the number of cores at the five altitude sites |
Table 2 Statistical characteristics of the five standard chronologies |
| Low elevation | High elevation | ||||
|---|---|---|---|---|---|
| Chronology | L | ML | MH | H | TL |
| Sample depth (trees/cores) | 25/50 | 25/50 | 25/49 | 25/48 | 25/45 |
| Time span (BC) | 1862-2019 | 1877-2019 | 1786-2019 | 1776-2019 | 1782-2018 |
| MS | 0.250 | 0.375 | 0.119 | 0.102 | 0.150 |
| SD | 0.383 | 0.544 | 0.187 | 0.196 | 0.274 |
| Common period | 1949-2019 | 1922-2019 | 1865-2019 | 1945-2018 | 1944-2018 |
| AC1 | 0.741 | 0.675 | 0.707 | 0.773 | 0.798 |
| R1 | 0.577 | 0.643 | 0.171 | 0.342 | 0.253 |
| R2 | 0.787 | 0.841 | 0.344 | 0.572 | 0.423 |
| R3 | 0.572 | 0.639 | 0.167 | 0.337 | 0.249 |
| SNR | 64.190 | 84.665 | 9.272 | 23.354 | 13.177 |
| EPS | 0.985 | 0.988 | 0.903 | 0.959 | 0.929 |
| PC1 | 0.604 | 0.668 | 0.377 | 0.381 | 0.399 |
| EPS>0.85 (starting year/cores) | 1878/5 | 1887/4 | 1847/28 | 1810/11 | 1870/17 |
MS is the mean sensitivity, SD is the standard deviation, AC1 is the first-order autocorrelation, R1 is the mean correlation among all radii, R2 is the mean correlation between trees, R3 is the mean correlation within trees, SNR is the signal-to-noise ratio, and EPS is the expressed population signal. |
Table 3 Correlation coefficients between STD chronologies during the common period from 1887-2018 |
| Chronology | L | ML | MH | H |
|---|---|---|---|---|
| ML | 0.593** | |||
| MH | -0.051 | 0.212* | ||
| H | 0.243** | -0.001 | 0.442** | |
| TL | 0.084 | 0.205* | 0.594** | 0.721** |
Note: * represents p<0.05,** represents p<0.01 |
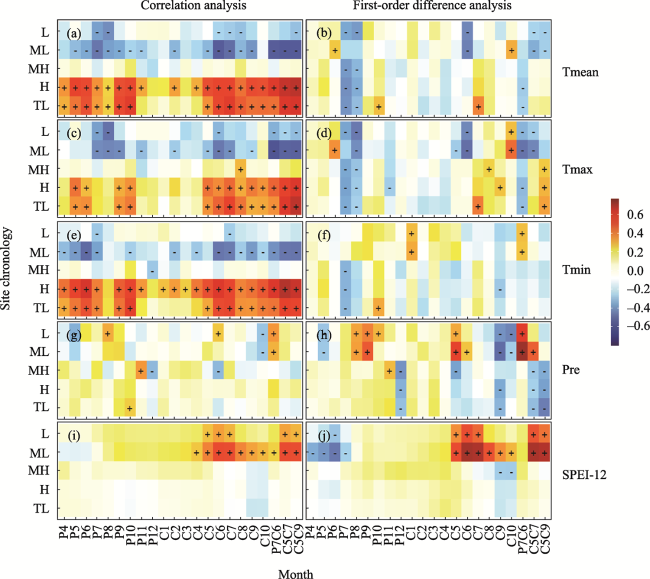
Figure 4 Correlations between the tree-ring index and the climate calculated from original and first-differenced data during the period from 1957-2016. The correlation analysis of the tree-ring index and Tmean (a), Tmax (c), Tmin (e), Pre (g), SPEI-12 (i). The first-order difference analysis of the tree-ring index and Tmean (b), Tmax (d), Tmin (f), Pre (h), SPEI-12 (j). Tmean: monthly mean temperature, Tmax: monthly mean maximum temperature, Tmin: monthly mean minimum temperature, Pre: monthly total precipitation, SPEI-12: monthly mean Standardized Precipitation-Evapotranspiration Index at a 12-month scale. P represents the previous year, C represents the current year, and the number represents the month, e.g., P9 represents September of the previous year, and C5 represents May of the current year. C5C7 represents May to July of the current year, and P7C6 represents July of the previous year to June of the current year. +: significant (p<0.05) positive correlation,-: significant (p<0.05) negative correlation. |
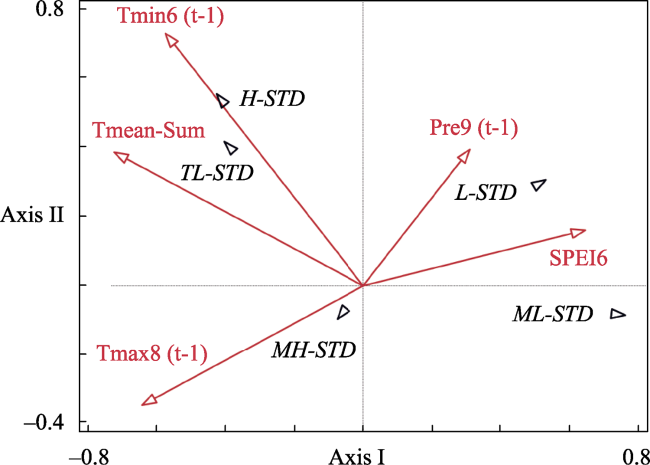
Figure 5 The RDA analysis between the climate and tree-ring chronologies. Only significant climate factors (p<0.05) are presented. The longer the climate factor vector, the greater its relative contribution. The shorter perpendicular line between the chronology point and the climatic vector (itself, or the extension line) indicates a higher correlation. The chronology and vectors pointing in the same direction show a positive correlation and vice versa. Pre represents precipitation; Tmean represents monthly mean temperature; Tmax represents monthly maximum temperature; Tmin represents monthly minimum temperature, SPEI represents Standardized Precipitation-Evapotranspiration Index at a 12-month scale, t-1 represents the previous year, and the number indicates the month. L-STD indicates the low site chronology; ML-STD indicates the middle-low site chronology; MH-STD indicates the middle-high site chronology; H-STD indicates the high site chronology; TL-STD indicates the treeline site chronology. |
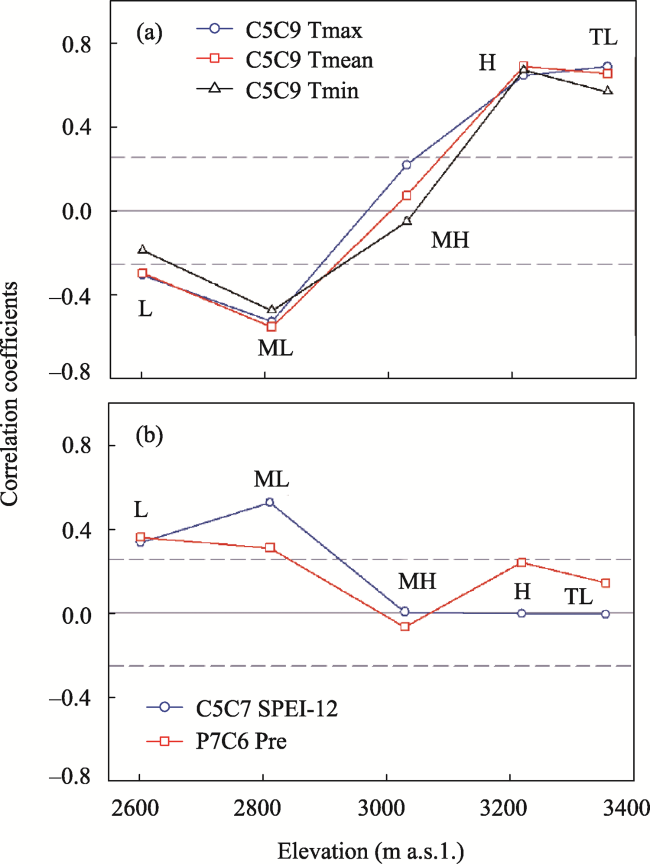
Figure 6 Altitudinal trends in correlation coefficients of the tree-ring index with climate during the period from 1957-2016 |
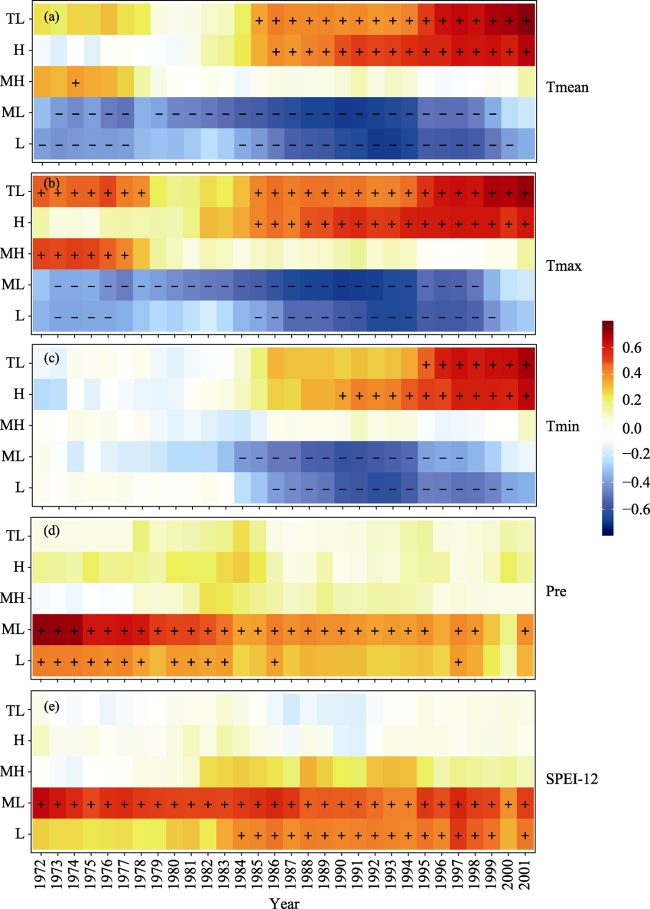
Figure 7 A 31-year moving correlation analysis of the tree-ring index along elevation gradients with C5C9 mean temperature (a), C5C9 mean maximum temperature (b), C5C9 mean minimum temperature (c), P7C6 total precipitation (d), and C5C7 mean SPEI-12 (e) |
We thank Qipeng Sun, Yiran Zhang, Zhenyu Tu, Dingcai Yin, Haowen Fan, Haijiang Yang, Kaixuan Yang, Rui Bian, Miaomiao Du, Kai Wang, Jie Liu, Jingqing Xia, Lanya Liu and Fangjingcheng Zhu for their kind field and laboratory works.
| [1] |
|
| [2] |
|
| [3] |
|
| [4] |
|
| [5] |
|
| [6] |
|
| [7] |
|
| [8] |
|
| [9] |
|
| [10] |
|
| [11] |
|
| [12] |
|
| [13] |
|
| [14] |
|
| [15] |
|
| [16] |
|
| [17] |
|
| [18] |
|
| [19] |
|
| [20] |
|
| [21] |
|
| [22] |
|
| [23] |
IPCC, 2021. Climate Change 2021:The Physical Science Basis. Contribution of Working Group I to the Sixth Assessment Report of the Intergovernmental Panel on Climate Change. Cambridge and New York: Cambridge University Press.
|
| [24] |
|
| [25] |
|
| [26] |
|
| [27] |
|
| [28] |
|
| [29] |
|
| [30] |
|
| [31] |
|
| [32] |
|
| [33] |
|
| [34] |
|
| [35] |
|
| [36] |
|
| [37] |
|
| [38] |
|
| [39] |
R Development Core Team, 2014. R: A language and environment for statistical computing. R Foundation for Statistical Computing, Vienna, Austria.
|
| [40] |
|
| [41] |
|
| [42] |
|
| [43] |
|
| [44] |
|
| [45] |
|
| [46] |
|
| [47] |
|
| [48] |
|
| [49] |
|
| [50] |
|
| [51] |
|
| [52] |
|
| [53] |
|
| [54] |
|
| [55] |
|
| [56] |
|
| [57] |
|
| [58] |
|
| [59] |
|
| [60] |
|
| [61] |
|
| [62] |
|
| [63] |
|
| [64] |
|
| [65] |
|
| [66] |
|
| [67] |
|
| [68] |
|
| [69] |
|
| [70] |
|
| [71] |
|
/
| 〈 |
|
〉 |