Why are glacial lakes in the eastern Tianshan Mountains expanding at an accelerated rate?

  • ZHANG Qifei , 1, 2 ,
  • CHEN Yaning 2 ,
  • LI Zhi 2 ,
  • FANG Gonghuan 2 ,
  • XIANG Yanyun 2, 3 ,
  • JI Huiping 2
Expand
  • 1. School of Geographical Sciences, Shanxi Normal University, Taiyuan 030031, China
  • 2. State Key Laboratory of Desert and Oasis Ecology, Xinjiang Institute of Ecology and Geography, CAS, Urumqi 830011, China
  • 3. School of Public Administration, Shanxi University of Finance and Economics, Taiyuan 030006, China
*Chen Yaning, Professor, specialized in hydrology and water resource in arid area. E-mail:

Zhang Qifei, PhD, specialized in glacier change and water resources. E-mail:

Received date: 2021-08-06

  Accepted date: 2022-02-11

  Online published: 2023-01-16

Supported by

National Natural Science Foundation of China(42130512)

National Natural Science Foundation of China(U1903208)

Abstract

Monitoring alpine lakes is important for understanding the regional environmental changes caused by global warming. In this study, we provided a detailed analysis of alpine lake changes in the Tianshan Mountains (TS) and discussed their driving forces based on Landsat TM/ETM+/OLI, WorldView-2, Bing, Google Earth, and ASTER imagery, along with climatic data from 1990 to 2015. The results showed that during the study period, the total number and area of alpine lakes in the eastern TS exhibited an increasing trend, by 64.06% and 47.92%, respectively. Furthermore, the continuous expansion of glacial lakes contributed 95.12% and 94.17% to the total increase in the number and area, respectively, of alpine lakes. Non-glacial lakes exhibited only intermittent expansion. Since the 1990s, the new glacial lakes in the eastern TS have been mainly proglacial and extraglacial lakes. Over the past 25 years, eastern TS has experienced a temperature increase rate of 0.47 °C/10a, which is higher than that in other TS regions. The rapidly warming climate and glacier recession are the primary causes of the accelerated expansion of glacial lakes in the eastern TS.

Cite this article

ZHANG Qifei , CHEN Yaning , LI Zhi , FANG Gonghuan , XIANG Yanyun , JI Huiping . Why are glacial lakes in the eastern Tianshan Mountains expanding at an accelerated rate?[J]. Journal of Geographical Sciences, 2023 , 33(1) : 121 -150 . DOI: 10.1007/s11442-023-2076-z

1 Introduction

Glacial lakes are formed by glacier recession and are predominantly recharged by glacial meltwater (Veh et al., 2020). These lakes are important natural reservoirs for water resources in mountainous regions (Mergili et al., 2013; Pritchard, 2019; Zheng et al., 2019). In general, glacial lakes are minimally affected by human activities, but studies have indicated that they show a rapid response to climate change and glacier shrinkage (Shugar et al., 2020; Woolway et al., 2020). Currently, global warming is affecting numerous processes within the cryosphere, including the accelerated melting of glaciers, snow, permafrost, and river ice, thereby causing substantial changes in the amount of meltwater in high mountainous regions worldwide (Luo et al., 2018; Shen et al., 2018; Chen et al., 2019; Qiao and Zhu, 2019; Yang et al., 2020; Cai et al., 2021; Yao et al., 2021). Current warming climate has aggravated alpine glacier wastage, with a total glacier mass loss of 16.3 ± 3.5 GT/a occurring in High Mountain Asia (HMA) from 2000 to 2016 (Brun et al., 2017). Approximately 97.52% of the glaciers in the Tianshan Mountains (TS) have shrunk over the past half-century (Chen et al., 2016), with their total area and mass decreasing by approximately 18% ± 6% and 27% ± 15%, respectively (Farinotti et al., 2015).
Notably, the western TS had a glacier recession of approximately 0.4%/a-0.63%/a (Narama et al., 2010; Chen et al., 2016). Glaciers in the northern TS shrank considerably faster, at 0.73%/a-0.76%/a between 1955 and 2000 (Bolch, 2007; Niederer et al, 2008), whereas those in the middle region of the central TS have exhibited a shrinkage rate of 0.35%/a over the past four decades (Li et al., 2006). Compared to those in other TS regions, glaciers in the eastern TS have undergone the highest rate of area shrinkage. For example, the northern slope of Bogda Peak experienced a severe glacier recession rate (0.94%/a), followed by the Baiyang River basin in Turpan-Hami, at rates of −0.84%/a and −0.8%/a, respectively. Meanwhile, the shrinkage percentages of glacier areas within the Miaoergou and Yiwu River basins were approximately −0.76%/a and −0.49%/a, respectively. These sizeable reductions clearly indicate that the glacier shrinkage rate in the eastern TS is significantly higher than that in the other TS regions (Wang et al., 2013; Xing et al., 2017). In response to climate change and glacier recession, glacial lakes in the upper mountains and river runoff in downstream areas are experiencing rapid increases, especially in arid and semi-arid zones (Zheng et al., 2019; Shugar et al., 2020; Yang et al., 2020).
Existing studies have shown that glacial lakes in TS are experiencing rapid growth. For example, Sayram Lake in the northern TS (Southwest of Botala Prefecture) expanded by about 12.0 ± 0.3 km2, with the water level rising by nearly 2.8 m over the past 40 years (Cheng et al., 2016). Engel et al. (2012) discovered that Petrov Lake in the Akshiirak massif region expanded at a rate of 0.03 km2/a in the 1970s, and then increased at a rate of 0.04- 0.1 km2/a since 1978. Zheng et al. (2019) noted that since 1990, newly emerged glacial lakes in the upper reaches of the Syrdarya River, TS, contributed 69% of the total increase in the number of alpine lakes. Similarly, in the Tarim River region of the TS, the glacial lakes have grown about 32.9% over the past 25 years (Wang et al., 2016). Likewise, Kapitsa et al. (2017) found an increase in the number and area expansion of glacial lakes by 37 (6.2%) and ~ 18 km2, respectively, in the Djungarskiy Alatau during 2002-2014. Whereas Ye et al. (2017) revealed that 71% of lake levels in Xinjiang showed an increasing trend during 2003-2009, especially in the TS region. Recent glacier changes in the TS have indicated that glacial lakes in the eastern TS presented the largest areal expansion, accounting for half of the glacial lake expansion in the entire TS region (Wang et al., 2013). Now, the question is: Why is this happening?
The ongoing global warming coupled with pattern changes in precipitation and evaporation across mountain regions has contributed to alpine lake changes (Song et al., 2014; Song and Sheng, 2016; Treichler et al., 2019). Previous findings have reported that precipitation and evaporation strongly influence alpine lakes, regardless of the impact of water supplied by the glaciers (Song et al., 2014; Song and Sheng, 2016). For example, the lake expansion in the Qinghai-Tibet Plateau (QTP) since 2000 attributed to an increase in precipitation and a decrease of evaporation in the central region, where precipitation increase accounts for 60% of the total water supply and glacier water contributes around 10% (Song et al., 2014). Lei et al. (2013) found that precipitation and evaporation are the main drivers causing rapid growth of lakes in the central part of the QTP, accounting for about 70% of the lake increase. However, the exact drivers of lake expansion in the eastern TS remain debatable, especially it is unclear regarding the changes in temperature, precipitation and evaporation in the high-altitude regions since 1990 is still unclear.
In this study, we aimed to perform a comprehensive analysis of available data, to pinpoint the potential factors that may have caused changes in alpine lakes in the eastern TS during 1990-2015. Our systematic analysis of glacial lake changes in the eastern TS covered three periods (1990-2000, 2000-2010, and 2010-2015) and was based on the spatiotemporal variations in glacial and non-glacial lakes across a variety of regions, elevations, and types. The types of alpine lakes and their potential driving factors were systematically analyzed, and the responses of alpine lakes to temperature, precipitation, and potential evaporation changes were discussed. The identification of these factors could lay the groundwork for supporting water security in the core area of the Silk Road Economic Belt.

2 Study area

The TS region, situated between 69°-95°E and 39°-46°N within the Eurasian hinterland, forms the largest mountain system in Central Asia (Farinotti et al., 2015). It stretches approximately 2500 km from west to east and 250-350 km from south to north (Chen et al., 2016). The mountains span the Xinjiang Uygur Autonomous Region in China westward to Kazakhstan and Kyrgyzstan and can be divided into four general areas based on the geographical setting: western, central, northern, and eastern TS (Figure 1). The eastern TS stretches from the eastern part of Hami City to East Fukang City and includes the Harlik, Barkol, and Bogda ranges (Figure 1). The average altitude of the eastern TS is 1624 m, with the highest peak being Bogda Peak (5445 m), known as Bogada Feng in China (He et al., 2015).
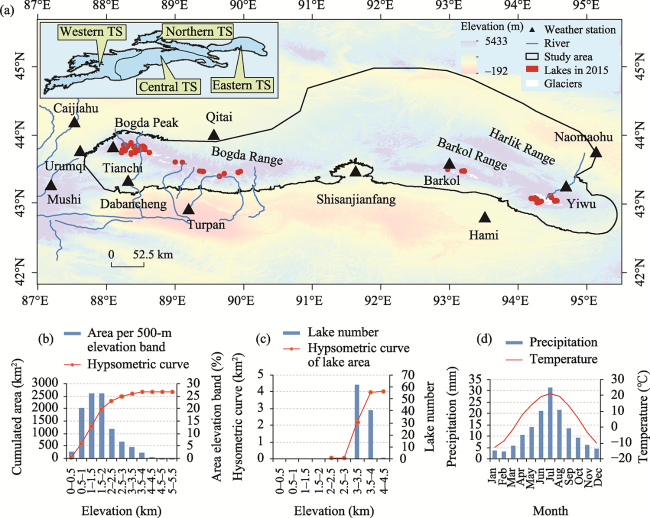
Figure 1 Location of the study area within the eastern TS (a. Distribution of lakes, glaciers, and surrounding topography; b. Hypsometric curve and distribution of the area by layer under each 500-m elevation band; c. Hypsometric curve of the lake area and distribution of the lake number by layers under each 500-m elevation band; d. Monthly average temperature and precipitation from the ERA-Interim and Global Precipitation Climatology Centre (GPCC) datasets)
With the westerly circulation and unique topography (Sorg et al., 2012), the heaviest precipitation in the TS occurs in the summertime (Figure 1d). However, the eastern TS receives only the tail-end of these westerlies, which is the driest part of the TS region. The average annual temperature across the region is around 5.66 °C, with an average precipitation of 142 mm (Table 1). More than 52% of the total annual precipitation is recorded in the summer, with amounts gradually reducing from west to east.
Table 1 The geographic and climatic characteristics of the eastern Tianshan Mountains
Geographic characteristics Climatic characteristics
Region area (105 km2) 0.82 Average annual temperature (℃) 5.66
Glacier number/area (-/km2) 565/268.42 Average annual precipitation (mm) 142
Glacier area proportion (%) 0.33 Average summer temperature (℃) 19.66
Annual snow area proportion (%) 26.61 Average summer precipitation (mm) 73.60
Annual snow depth (cm) 1.42
Mean glacier terminal altitude (m) 3800
Mean alpine lake altitude (m) 3439
Mean single glacier area (km2) 0.48
Mean single glacial lake area (km2) 0.04
Elevation range (m) 284-5099
Average elevation (m) 1624
The TS is considered Central Asia’s “water tower” (Chen et al., 2016), in which it feeds the majority of the area’s rivers through a combination of ice-snow meltwater. Its range boasts nearly 18,117 glaciers covering a total area of 14,232 km2, most of which provide fresh water for more than 100 million people living in Central Asia (Aizen et al., 2007). According to the new Randolph Glacier Inventory (RGI 6.0), 565 glaciers covering an area of about 268.42 km2 have recently developed in the eastern TS. This is noteworthy, considering that 86% of the region’s altitudes are between 500 m and 2500 m (Figure 1b), which means that all the glacial lakes and glaciers are distributed above 3000 m, in a relatively concentrated and high-altitude space (Figure 1c). Most glaciers are small- to medium-scale with an average area of 0.48 km2 (Table 1) and an average altitude of 3800 m, most of which are distributed in the Bogda Range.

3 Material and methods

3.1 Material

3.1.1 Satellite data

In our study, Landsat Thematic Mapper (TM), Enhanced Thematic Mapper Plus (ETM+), and Operational Land Imager (OLI) imagery covering the study area were used as the main sources to extract lake information spanning four decades (1990, 2000, 2010, and 2015). Images were obtained from the United States Geological Survey (USGS) website (http://www.usgs.gov). The Landsat TM, ETM+, and OLI imagery provided a resolution of 30 m that was already processed through radiometric correction and projected in the UTM coordinate system. To eliminate the potential uncertainty caused by ice, seasonal snow, and cloud cover, nearly, all images were selected from July to October. Owing to the limitations caused by the available number of poor-quality images that cover a large fraction of seasonal snow or cloud coverage, images over a 1- to 2-year interval were used for lake extraction.
In addition, high-resolution images from WorldView-2 (~0.5 m resolution, from the ESRI World Map, http://goto.arcgisonline.com/maps/World_Imagery), Google Earth, and Bing (~1.65 m) with 2.62-m resolution for GeoEye, SPOT5, and QuickBird were used as auxiliary satellite datasets to identify lake basins, lake types, streams, mountain and cloud shadows, and other topographic features such as reservoirs and ponds (Petrov et al., 2017; Zheng et al., 2019; Wang et al., 2020). Furthermore, images from the Advanced Spaceborne Thermal Emission and Reflection Radiometer (ASTER Level 1T, 15 m resolution) for 2000-2015 were collected to estimate the accuracy of the lake areas. These images were obtained from good quality and cloud-free conditions during the ablation period, when the snow coverage was minimal. ASTER imagery was obtained using the USGS Global Visualization Viewer (GloVis; https://earthexplorer.usgs.gov/).
Shuttle Radar Topography Mission (SRTM1) Arc-Second Global radar topography data for February 2000 were used to retrieve the altitudes of the alpine lakes. The data had a resolution of 30 m, which provided worldwide coverage of void-filled high-resolution data and was consistent with the resolution of Landsat imagery. The absolute and relative vertical accuracies of the SRTM1 DEM were 16 and ± 6 m, respectively (Rabus et al., 2003), and the data were derived from the USGS website.

3.1.2 Glacier data

The first Chinese Glacier Inventory (CGI) was downloaded from the “Environmental and Ecological Science Data Center for West China” (http://westdc.westgis.ac.cn). The glacier boundaries in this inventory were extracted from aerial photographs taken in the 1960s and the 1970s at a scale of 1:60,000. The images were then examined and corrected based on field investigations with dataset errors ranging from ± 0.5% to ± 1% for the total glacier area (Shi, 2008). Glacier boundaries for TS during the 2010s were obtained from the recently published Randolph Glacier Inventory (6.0), supported by Global Land Ice Measurements from the Space Initiative.

3.1.3 Climatic data

Annual and daily meteorological data were obtained from 12 observation stations in the eastern TS and the surrounding region during 1990-2015; these can be downloaded from the China Meteorological Data Service Center (http://data.cma.cn/). The data included the average annual temperature and precipitation, as well as climatic variables such as observed mean, maximum, and minimum temperatures (at 2 m above ground), precipitation, number of rainfall days, relative humidity, and average vapor pressure. The data were utilized to estimate the annual and daily potential evapotranspiration using the Penman-Monteith model.
The meteorological stations in the study region were characterized by an uneven and sparse distribution, particularly in high-altitude areas. To compensate for unevenness, two datasets of monthly gridded land surface temperature from 1990 to 2015 were used. One of the monthly gridded surface temperatures (2 m above ground with a 0.25° resolution) from the ERA-Interim dataset was obtained from the European Center for Medium Range Weather Forecasts (https://apps.ecmwf.int/da-tasets/). Other monthly land surface temperature and precipitation data were obtained from the Climatic Research Unit gridded Time Series (CRU TS v.4.02) dataset, which was obtained from the Climatic Research Unit (https://crudata.uea.ac.uk/cru/data/hrg/#info) with a 0.5° horizontal resolution. The GPCC full data monthly precipitation product V.2018 (V8) for 1990-2015 was downloaded from the Global Precipitation Climatology Center (https://www.dwd.de/EN/ourservices/gpcc/gpcc.html). This dataset was supported by the Deutscher Wetterdienst under the auspices of the World Meteorological Organization (WMO). This product was based on climate data of more than 79,000 stations worldwide. Compared with other products (Song et al., 2014; Zheng et al., 2019), the GPCC product had a higher resolution of 0.25°, which had been proven to provide better performance in the TS (Yang et al., 2019; Zhang et al., 2020). The GPCC product has been widely used in other mountainous regions with complex topographies (Zhang et al., 2019b).

3.2 Methods

3.2.1 Lake extraction

In this study, the methods for lake extraction included automatic water body extraction and manual vectorization. The lake extraction procedure is shown in Figure 2. In this study, we analyzed all alpine lakes (including glacial and non-glacial lakes) with areas > 2000 m2 and altitudes > 2000 m. The normalized difference water index (NDWI) was used to extract lake boundaries from Landsat images. The NDWI was calculated as follows:
$NDWI=\frac{{{B}_{green}}-{{B}_{NIR}}}{{{B}_{green}}+{{B}_{NIR}}}$
where Bgreen and BNIR are the green and near-infrared (NIR) bands, respectively. It is inappropriate to identify lake bodies using a static threshold because NDWI is a dynamic value that changes depending on the water. The appropriate NDWI thresholds ranged from 0 to 0.3. Initially, a lower threshold of approximately 0 was selected to distinguish water information, and then thresholds higher than 0 were tested for individual images. Finally, manual visual interpretation of the false-color composite images was used to identify and extract alpine lake boundaries.
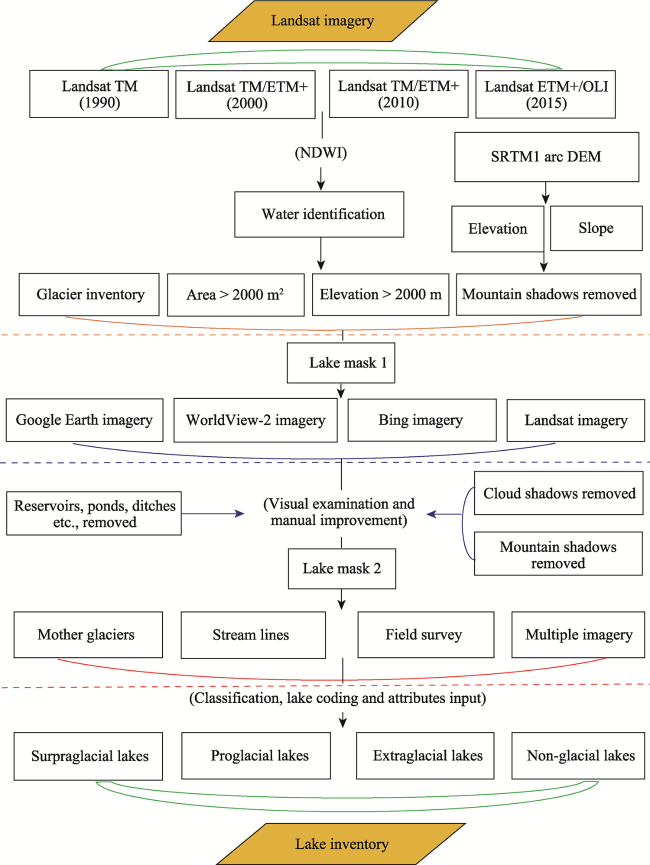
Figure 2 Flow chart showing the process used for alpine lake extraction in the eastern Tianshan Mountains
Owing to the limitations of the automatic identification of glacial lakes, particularly for ice surfaces, each alpine lake was checked against automatically extracted glaciers by visual inspection and correction. For alpine lakes, multispectral band combinations from Landsat imagery (TM/ETM+ bands 3, 5, and 7; OLI bands 4, 6, and 7) were used to manually improve the lake outlines using the NDWI method. In addition, we used high-resolution WorldView-2, Bing, and Google Earth imagery to check and revise lake boundaries.
Uncertainty in lake areas largely depends on the spatial resolution and co-registration errors (Hall et al., 2003). Images with high spatial resolution can effectively reduce uncertainties associated with lake identification compared to those with lower spatial resolution. In this study, Landsat TM, ETM+, and OLI images were processed using standard terrain correction (Level 1T). As the lake comparisons were made entity by entity rather than pixel by pixel, the co-registration error was not considered to have an important impact on the lake area measurements. It is difficult to be precisely accurate, owing to the lack of ground-based measurements. In this study, we adopted the method of Hanshaw and Bookhagen (2014) to estimate lake uncertainties, which assumes that the uncertainty in the lake area by manual identification has a Gaussian distribution. As pure lake water body pixels are usually surrounded by mixed pixels, the uncertainty caused by the spatial resolution of the Landsat imagery was estimated with an error of ± 0.5 pixels for lake boundaries. Finally, this number was multiplied by half the area of a single pixel, assuming that the uncertainty for each pixel was half a pixel, as follows:
${{E}_{i}}=\frac{p}{g}\frac{{{g}^{2}}}{2}0.6872$
$ERR=\frac{\mathop{\sum }_{i}^{n}{{E}_{i}}}{A}100\text{ }\!\!%\!\!\text{ }$
where p is the lake perimeter (m), g is the spatial resolution of the Landsat imagery (m), 0.6872 is the revised coefficient (~69% of the peripheral pixels are subject to errors), ERR is the relative error of the total lake area (%), Ei is the area error (km2) of lake (i), and A is the total area of the glacial lakes (km2).
Overall, the total relative lake area error in the eastern TS was 17.89% in 1990, 17.81% in 2000, 17.42% in 2010, and 17.84% in 2015. In addition, compared with the lake boundaries manually extracted using ASTER imagery, the error for the total alpine lake area across the eastern TS was below 8%. Furthermore, by comparing data from the current study and the literature (13 glacial lakes from the eastern TS) (Shugar et al., 2020), the average and total lake area errors were 8.5% and 9.9%, respectively, for the year 2015.

3.2.2 Identifying different types of lakes and glaciers

Many different types of alpine lakes develop in the eastern TS (Figure 2). These include the two major types of alpine lakes: glacial lakes (formed by glaciation or predominantly recharged by glacier meltwater) and non-glacial lakes. In this study, to identify whether glacier meltwater contributed directly to glacial lake water balances, glacial lakes are defined either as those having contact with the glacier terminal or margin, or those with no contact with the glaciers but directly supplied by glacier meltwater. These glacial lakes are further identified manually to determine whether streams link lakes to their terminating glaciers. The false color composite bands for Landsat scenes and high-resolution WorldView-2, Bing, and Google Earth imagery support this process.
In this study, glacial lakes were divided into three types (supraglacial, proglacial, and extraglacial lakes), which are largely influenced by the upper types of lake-terminating glaciers (e.g., valley, cirque, and hanging glaciers). Supraglacial lakes are formed on glacier surfaces and are damaged by ice (Yao et al., 2018). They mainly appear at the termini of valley glaciers with large areas and lengths. Extraglacial lakes are positioned in front of glaciers but have no direct connection to the glacier termini. These lakes are directly fed by glacial meltwater, particularly valley glaciers, and are nearly as numerous as the glaciers themselves. Proglacial lakes are directly controlled by the advance or retreat of the upper lake- terminating glaciers. Hence, these types of glaciers (e.g., cirque and hanging glaciers) of small and medium sizes show rapid retreat in response to a warming climate. In addition to glacial meltwater, glacial lakes are influenced by precipitation and snow meltwater. Thus, we selected non-glacial lakes (i.e., lakes that do not receive glacial meltwater or have streams between them and upper contract glaciers) for comparison. To accurately analyze the driving forces of the glacial lake expansion in the eastern TS, we manually distinguished and categorized lakes based on false color composite Landsat imagery and high-resolution images from WorldView-2, Google Earth, and Bing, which were used along with the 30 m SRTM1- Arc DEM. In addition, lakes disturbed by human activities, including reservoirs, ponds, and ditches, were excluded to further detect the influence of climate variation on lake changes.
Previous research on the characteristics of glaciers in the eastern TS indicated three different glacier types: valley, cirque, and hanging (Qin et al., 2016). Valley glaciers flow from the firn basin or are supplied by a snow slide, with the stream valley being glaciated by glacier tongues. Cirque glaciers represent typical geomorphic glaciers formed by glacial erosion. They are concave in shape, with the concave portion open on the downhill side and the cupped section generally steep. In cirque glaciers, snow and ice accumulation can often occur as the result of snow slides from higher surrounding slopes. If a cirque glacier advances far enough, it may become a valley glacier. Additionally, if a valley glacier retreats enough within the cirque, it becomes a cirque glacier again (Engel et al., 2012; Falatkova et al., 2019). Hanging glaciers are formations that stop partway down a mountain cliff but do not stretch to the foothill. Based on the SRTM1 DEM and RGI 6.0 glacier inventory, valley, cirque, and hanging glaciers have been classified using high-resolution imagery from WorldView-2, Google Earth, and Bing maps.

3.2.3 Estimation of potential evaporation using the Penman-Monteith model

Potential evaporation (PE) in the eastern TS is estimated based on the Food and Agriculture Organization of the United Nations (FAO) Penman-Monteith method, which takes aerodynamic and canopy resistance equations into consideration (Allen et al., 1998). This method was adopted by standardizing and simplifying certain metrics according to more physically realistic observed meteorological variables. The FAO Penman-Monteith model confirms evapotranspiration from a hypothetical grass reference surface and has already been used in high-altitude regions, such as the Tibetan Plateau (Song et al., 2014). Daily PE for individual stations can be calculated as follows:
$E{{T}_{o}}=\frac{0.408\Delta ({{R}_{n}}-G)+\gamma \frac{900}{T+273}{{u}_{2}}({{e}_{s}}-{{e}_{a}})}{\Delta +\gamma (1+0.34{{u}_{2}})}$
where ETo is potential-evapotranspiration (mm/d), Rn is net-radiation (MJ/m2·d), G is soil heat-flux (MJ/m2·d), es is saturation vapor pressure (kPa), ea is actual vapor-pressure (kPa), es - ea is saturation vapor pressure deficit (kPa), T is air temperature (℃), u2 is wind speed (m/s) at 2 m height, γ is psychrometric-constant (kPa/℃), and is slope vapor pressure curve (kPa/℃).

4 Results

A total of 105 alpine lakes covering an area of 4.04 ± 0.27 km2 were identified in the eastern TS for 2015. Of these, 91 were glacial lakes, accounting for 86.67% and 93.55% of the total alpine lake number and area, respectively. From 1990 to 2015, there was an obvious increasing and expanding trend in the number and area of alpine lakes (Figure 3), by 41 (64.06%) and 1.31 ± 0.56 km2 (47.92% ± 20.45%), respectively. New lakes were mainly concentrated in the regions where glaciers were distributed (Figures 3a and 3b). Over the study period (1990-2015), these glacial lakes increased in number and area by 39 (75%) and 1.23 ± 0.22 km2 (48.40 ± 7.38%), respectively. The changes in the different types of alpine lakes indicate that the expanded area of lakes was mainly caused by the expansion of glacial lakes.
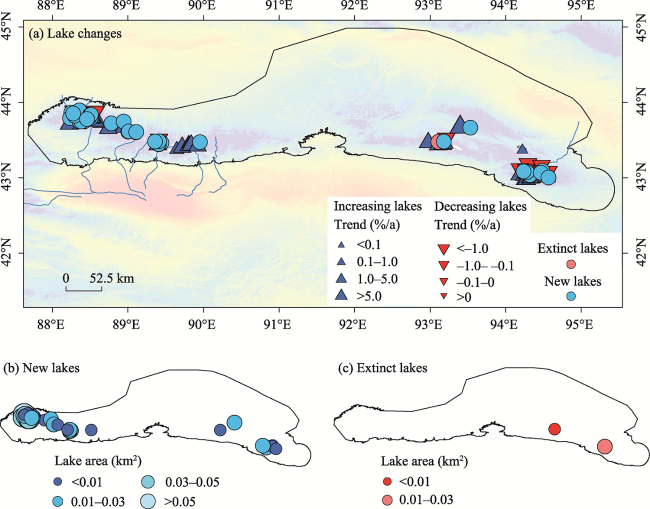
Figure 3 Changes in the lake number and area in the eastern Tianshan Mountains from 1990 to 2015 (a. Changes in the total number of alpine lakes; b and c. Newly formed and extinct (lost) alpine lakes)

4.1 Temporal variations in different types of lakes

From 1990 to 2015, alpine lakes (i.e., glacial and non-glacial lakes) in the eastern TS exhibited a positive trend during different periods (Figure 4). During 1990-2000, alpine lakes exhibited the largest area expansion, accounting for 70.31% ± 29.78% of the total area increase. During the same period, the number of non-glacial lakes increased by 3 and their area expanded by approximately 0.16 ± 0.10 km2, while the number of glacial lakes increased by 19 and their area expanded by approximately 0.77 ± 0.71 km2. From 2000 to 2010, the expansion rate of glacial lakes slowed down, with their area increasing only by 0.13 ± 0.80 km2, while the area of non-glacial lakes shrank by approximately 0.17 ± 0.10 km2. However, during 2010-2015, the areas of both glacial and non-glacial lakes expanded substantially, by 0.34 ± 0.87 km2 and 0.09 ± 0.09 km2, respectively. Overall, the glacial lake area in the eastern TS experienced a steady expansion during 1990-2015, while that of non-glacial lakes exhibited only intermittent expansion (Figure 4b).
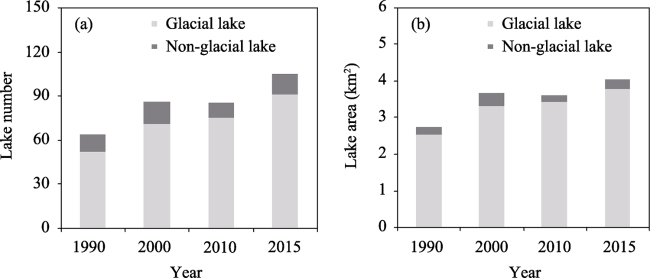
Figure 4 Statistics on the variations in lake numbers and area from 1990 to 2015 across the eastern Tianshan Mountains (a. Variations in glacial and non-glacial lake numbers during 1990-2015; b. Variations in glacial and non-glacial lake area groups during 1990-2015)

4.2 Spatial variations in alpine lakes

Geographical changes have occurred in glaciers and alpine lakes. The Bogda Range has the largest glacierized areas, accounting for 63.72% and 53.91% of the total number and area of glaciers, respectively, in the eastern TS. During 1990-2015, the total number of glacial lakes in the Bogda Range increased by 35, with the area experiencing an expansion rate of 0.47 ± 0.47 km2/10a. For the Harlik Range (which accounted for 26.73% of the total and 41% of the total glacier area), the total number and area expansion of glacial lakes increased by 4 and 0.02 ± 0.05 km2/10a, respectively. In the Barkol Range, which had the lowest glacier number and area (accounting only for 9.56% and 5.09%, respectively), we found no changes in the glacial lake number and an expansion area rate of only 0.01 ± 0.05 km2/10a. These results show that the lake expansion in the eastern TS was mainly dominated by glacial lakes, with the expansion rates of all regions being significantly higher than those of non-glacial lakes (Figure 5). This was particularly true for the Bogda Range, where glacier recession was significant. Non-glacial lakes exhibited a relatively slow expansion rate, with rates of 0.12%/a (Bogda Range), 1.1%/a (Barkol Range), and 0.01%/a (Harlik Range).
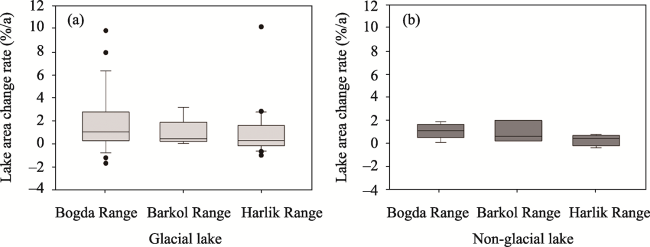
Figure 5 A comparison of the change rates in different types of alpine lake areas in different regions across the eastern Tianshan Mountains (a. Change rates in the alpine glacial lake area; b. Change rates in the alpine non-glacial lake area)

4.3 Variations in alpine lakes at different altitudes

The distribution of glacial and non-glacial lakes in the eastern TS exhibited distinct elevation characteristics. The alpine lakes were mainly distributed between 3000-3500 m and 3500-4000 m (Figure 6a), accounting for 97.14% and 98.24% of the total alpine lake number and area, respectively. Glacial lakes accounted for 88.24% and 94.45% of the total alpine lake number and area, respectively, at these elevation ranges. From 1990 to 2015, the number of glacial lakes at these two elevation ranges (3000-3500 m and 3500-4000 m) increased by 24 and 14, respectively, with the total area expanding by 1.20 km2 (Figures 6b and 6c); on the contrary, the number of non-glacial lakes did not change significantly.
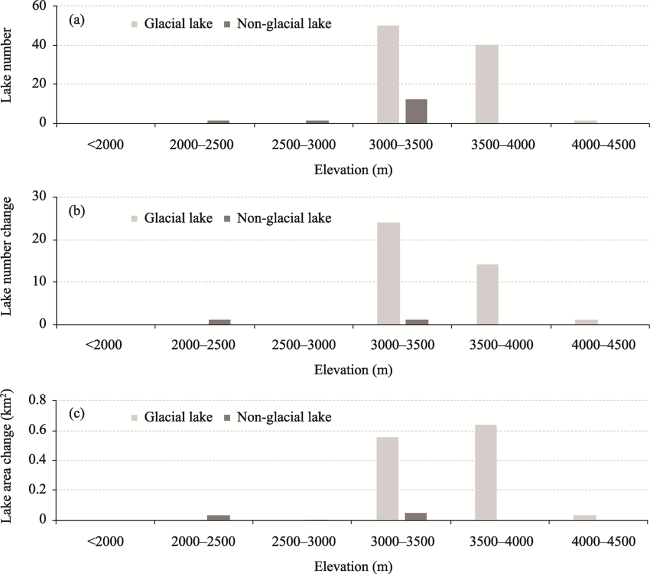
Figure 6 Distribution and changes in the number and area of different types of alpine lakes against 500-m elevation bands in the eastern Tianshan Mountains from 1990 to 2015 (a. Distribution of the alpine lake number during 2015; b. Variations in the alpine lake number; and c. Variations in the alpine lake area from 1990 to 2015)

4.4 Climate drivers of lake dynamics

Obvious warming was observed in the eastern TS (Figures 7a and 7d) at a rate of 0.47℃/10a, which was notably higher than that in other TS regions (Deng and Chen, 2017), China as a whole (0.30℃/10a) (Zhang et al., 2019b), Central Asia (0.31℃/10a) (Deng and Chen, 2017), or globally (0.12℃/10a) (IPCC, 2013). In addition, along with the warming climate, summer precipitation and PE increased, with a rate of 6.90 mm/10a and 71.16 mm/10a, respectively.
As summarized in Table 2, from 1990 to 2000, the temperature rose at a rate of 0.61- 0.78℃/10a, while precipitation exhibited a rising rate of −1.54-1.13 mm/a, and PE increased by 0.99 mm/a. Meanwhile, the expansion of glacial lakes was as high as 0.77 km2/10a, while the corresponding rate for non-glacial lakes was 0.16 km2/10a. From 2000 to 2010, the rate slowed down to 0.20-0.60℃/10a, but precipitation increased by −1.31 to 2.56 mm/a and PE was as high as 8.19 mm/a. During the same period, the expansion rate of glacial lakes slowed down to 0.13 km2/10a and non-glacial lake areas exhibited a shrinking trend to 0.17 km2/10a. During 2010-2015, the annual temperature increased substantially at a rate of 1.42-2.71℃/10a, with precipitation increasing by approximately 5.12-8.74 mm/a. However, PE decreased by 6.64 mm/a, while the areal expansion of non-glacial and glacial lakes reached 0.20 km2/10a and 0.70 km2/10a, respectively.
Table 2 Variations in temperature, precipitation, evaporation, glacial lakes, and non-glacial lakes during different periods in the eastern Tianshan Mountains from 1990 to 2015
Periods Temperature Precipitation Evaporation
(year)
Glacial lake Non-glacial lake
CRU ERA-
Interim
OBS CRU GPCC OBS
℃/10a ℃/10a ℃/10a mm/a mm/a mm/a mm/a km2/10a km2/10a
1990-2000 0.78 0.66 0.61 −1.54 1.13 0.70 0.99 0.77 0.16
2000-2010 0.20 0.44 0.60 −1.31 2.56 2.15 8.19 0.13 −0.17
2010-2015 2.71 1.42 1.59 5.12 8.36 8.74 −6.64 0.70 0.20
Among the alpine lakes of the eastern TS, the expansion rate was relatively higher in glacial lakes of all districts than that in non-glacial lakes (Figures 4a and 4b). In non-glacial lakes, areal changes were associated with precipitation. There was an inverse correlation with PE (r = −0.44), as depicted in Figure 7, where the total non-glacial lake area during 1990-2000 exhibited the highest expansion, which doubled compared to that during 1990-2015. This may indicate that higher precipitation and lower PE resulted in a positive water budget and lake area expansion. A sharp shrinkage of the non-glacial lakes occurred in 2010 (−0.17 ± 0.10 km2), which may be largely attributed to a reduction in precipitation and a slightly positive PE. The subsequent enlargement of the lake area in 2015 was closely associated with positive precipitation and negative PE.
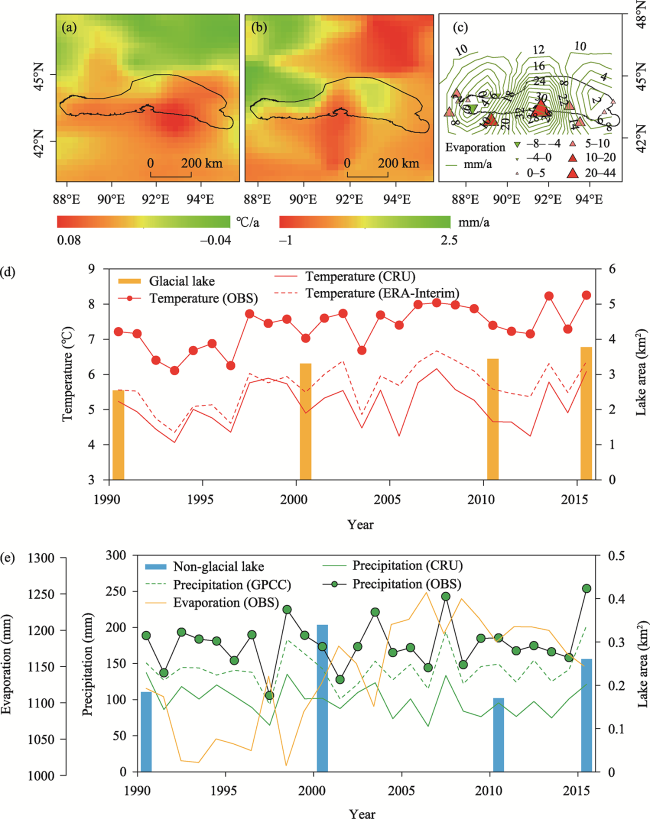
Figure 7 Variations in the annual (a) temperature, (b) precipitation, and (c) evaporation; (d) the changing trends in temperature (CRU, ERA-Interim, and OBS) and glacial lake area; (e) the changing trends in precipitation (CRU, GPCC, and OBS), evaporation, and non-glacial lakes in the eastern Tianshan Mountains from 1990 to 2015 (Note: OBS represents the observed climatic data from the meteorological stations.)
By analyzing spatial variations in non-glacial lakes, we found that pronounced precipitation increases occurred mainly in the central and northwestern areas of the study region, where higher expansion rates in non-glacial lakes also occurred. For example, the areas of non-glacial lakes in the Bogda and Barkol ranges increased by 3.79%/a and 0.54%/a, respectively. In contrast, precipitation in the Harlik Range exhibited the slowest increase, with the non-glacial lake area increasing by only 0.13%/a. Alpine lake area changes may also be affected by PE, especially at lower altitudes with the enhanced ability of PE. PE exhibited an obvious upward trend in the eastern TS from 1990 to 2015, with the most pronounced changes occurring in the central and southern parts. Meanwhile, the West Bogda Peak region experienced a significant PE decrease (Figure 7c).
Furthermore, we found that, during the study period, glacial lakes in the eastern TS appeared to be more sensitive to temperature changes (r = 0.66) than their non-glacial counterparts that correlated only weakly with temperature (r = −0.06). Figures 7d and 7e show that while the largest area expansion occurred in the wet year of 2015, the lakes maintained continuous expansion trends, even during dry years. Figure 7a reveals a warming climate across the eastern TS, with temperatures charting a continuously increasing trend from north to south, especially in the mountainous regions. Glacial lakes across all regions in the study area grew rapidly in response to climate change. Glacial lakes in the Bogda Range region exhibited the highest expansion rate (3.79%/a), followed by the central and eastern regions (0.54%/a and 0.13%/a).
Moreover, we found that glacial and non-glacial lakes in the eastern TS exhibited different patterns of altitude changes in temperature and precipitation. Figure 8a shows that for every 1000 m of elevation increase, the temperature decreased by 5.1℃, which is notably higher than the overall rate of decrease for TS (−4.9℃/1000 m) (Figure S1a). In contrast, the annual meteorological precipitation increased substantially with increasing altitude. Figure 8b shows that every 1000-m altitude increase resulted in a 199.9-mm increase in precipitation, representing a rate increase that was four times higher than that in the rest of the TS (64.3 mm/1000 m) (Figure S1b).
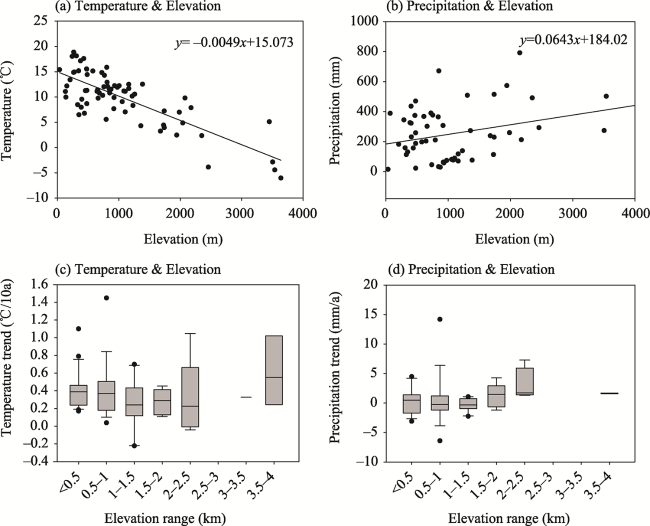
Figure 8 Variations in annual temperature and precipitation at different elevations across the eastern Tianshan Mountains from 1990 to 2015 (a and b. Variations in annual temperature and precipitation based on meteorological station data at different elevations; c and d. Variations in annual temperature and precipitation based on gridded Era-Interim and GPCC datasets at different elevations; e and f. Trends in annual temperature and precipitation at different elevations)
High-altitude TS regions characterized by lower temperatures and large amounts of precipitation exhibited widespread development of snow and glaciers. The warming rates of TS decreased at altitudes below 2500 m but increased rapidly above this altitude (Figure S1c). The increase in land surface temperature rates at 2500 m and above could prove adverse for snow and ice, meaning that the mountains may yield more water waste, which will provide excessive water for lakes and streams at lower altitudes. Simultaneously, precipitation at high-altitude elevations showed greater rates of increase (Figure S1d), further adding to the water resources supplying downstream regions.
During 1990-2015, precipitation increased with increasing altitude at a rate of 8.3 mm/1000. In contrast, the temperature increase rates decreased with an increase in altitude. However, as only one of the 12 meteorological stations used in our study was located higher than 2000 m, we employed Era-Interim and GPCC gridded sets. In eastern TS, the temperature increase rates decreased at altitudes below 1500 m but increased rapidly above this altitude (Figure 8e), which suggests that more ice and snow were lost in higher regions than in lower ones. Hence, glacial lakes would have received more meltwater from the glaciers and snow.
Precipitation also exhibited an increasing trend with increases in altitude but exhibited intermittent rates (Figure 8f; e.g., the increase rates increased below 1000 m but decreased above this altitude). The different climate change rates further affected both the glacial and non-glacial lakes. The number of non-glacial lakes at elevations of 2000-2500 m was similar to that at elevations 2500-3000 m. Non-glacial lakes exhibited greater areal expansion at lower altitudes than at higher ones. Precipitation at altitudes of 2000-2500 m exhibited an increasing rate of 2.99 mm/a, which was obviously higher than the rate for altitudes of 2500-3000 m (1.79 mm/a). Furthermore, the area of non-glacial lakes at altitudes between 3000 m and 3500 m exhibited a greater expansion of 1.08%/a, while precipitation at altitudes above 3000 m exhibited the highest increasing rate (6.63 mm/a).
Despite the increasing glacial lake expansion rates at every altitude, lakes at the highest altitudes experienced the greatest expansion rates. For example, between 3500 m and 4000 m, the expansion rate was 2.11%/a, which was higher than that between 3000 m and 3500 m (1.66%/a), even though the lower altitude had a relatively larger basin and glacier area. Therefore, under a warming climate, glacial lakes in the eastern TS showed a continuously increasing trend supplied by glacial meltwater, while the intermittent expansion of non-glacial lakes was likely more strongly influenced by specific precipitation or PE events.

5 Discussion

5.1 Variations in glacial lakes influenced by driving factors

Glacial lake changes are influenced by many factors, and the drivers of change are highly diverse and complex. Glacial lakes respond rapidly to a warming climate and retreating glaciers. For example, changes in glacial and snow meltwater are directly controlled by temperature increases and decreases, while increases and decreases in precipitation and PE may also affect the expansion rates of glacial lakes (Song et al., 2014; Song and Sheng, 2016; Petrov et al., 2017; Falatkova et al., 2019).
Since the 1970s, lakes in the HMA have generally expanded (Cheng et al., 2016; Kapitsa et al., 2017; Zhang et al., 2017; Zhang et al., 2019a). This was mainly related to the significant increase in precipitation and decrease in evaporation, which resulted in a much greater increase in water volume (Zhang et al., 2013). Song et al. (2014) found that the accelerated lake area expansion on the Tibetan Plateau (TP) since 2002 has been mainly driven by precipitation and evaporation, with precipitation accounting for 60% of the lake expansion and glacial meltwater for 10%. Similarly, Lei et al. (2013) found that precipitation and evaporation were the main drivers, accounting for approximately 70% of the lake increase. Fang et al. (2016) noted that increased precipitation and accelerated glacier meltwater are the main contributors to the expansion of glacial lakes in the Kunlun and Karakoram Mountains.
In similar research, Song and Sheng (2016) discovered that the accelerated expansion of glacial lakes in the Tanggula Mountains is mainly related to the increase in water mass, while no apparent relationship was detected to precipitation. Furthermore, the steady expansion of non-glacial lakes appeared to be dependent on changes in precipitation and evaporation. By analyzing water level changes in 100 large lakes in China, Wang et al. (2013) found that most of the lake levels showed a decreasing trend in the Yarlung Zangbo River catchment due to a rise in evaporation. For northern Inner Mongolia, Xinjiang and the Northeast China Plains, the decrease in lake levels was mainly attributed to a warming climate and reductions in precipitation.
However, our research has uncovered that recent accelerated expansion of glacial lakes in the TS is largely due to accelerated glacier recession, which is mainly the result of continuous temperature increases. This situation has led to larger amounts of meltwater entering lakes (Wang et al., 2013; Petrov et al., 2017; Zheng et al., 2019). There are similar cases in other regions of the TS. For example, since 2002, the increased number and area of alpine glacial lakes in Uzbekistan have primarily been caused by rising temperatures (Petrov et al., 2017). The same situation has occurred in the Syrdarya River basin in the central TS (Zheng et al., 2019) and Sayram Lake in the northern TS (Cheng et al., 2016).
Moreover, mountain snow responds well to climate change, as snow meltwater contributes significantly to downstream rivers (Ragettli et al., 2016; Luo et al., 2018; Shen et al., 2018). For example, continuous warming in the Syr Darya region has accelerated the melting of ice and snow, thereby expanding the area of local glacial lakes (Zheng et al., 2019). Similarly, lakes in the western Teskey range expand rapidly during June-July in response to the substantial melting of glaciers and snow in the upstream areas (Narama et al., 2018). Approximately 26.61% of the eastern TS features permanent or seasonal snow at an average snow depth (SD) of 1.42 cm, which is notably lower than that in the central TS (Zhang et al., 2020). The maximum snow cover area (SCA) and SD were 70.43% and 4.17 cm, respectively, in winter, but the SCA decreased to less than 1% in summer (Figures 9e and 9f). From 1990 to 2015, both the SCA and SD exhibited a positive trend at rates of 1.05%/10a and 0.9 mm/10a, respectively (Figures 9a and 9b). Seasonally, the SCA during autumn and winter exhibited positive trends at rates of 0.73%/10a and 3.83%/10a, respectively, while the SD also exhibited a positive trend of 0.16 mm/10a and 5.22 mm/10a, respectively. In contrast, in springtime, both SCA and SD exhibited negative trends of 1.13%/10a and 0.11 mm/10a, respectively (Figures 9h and 9g).
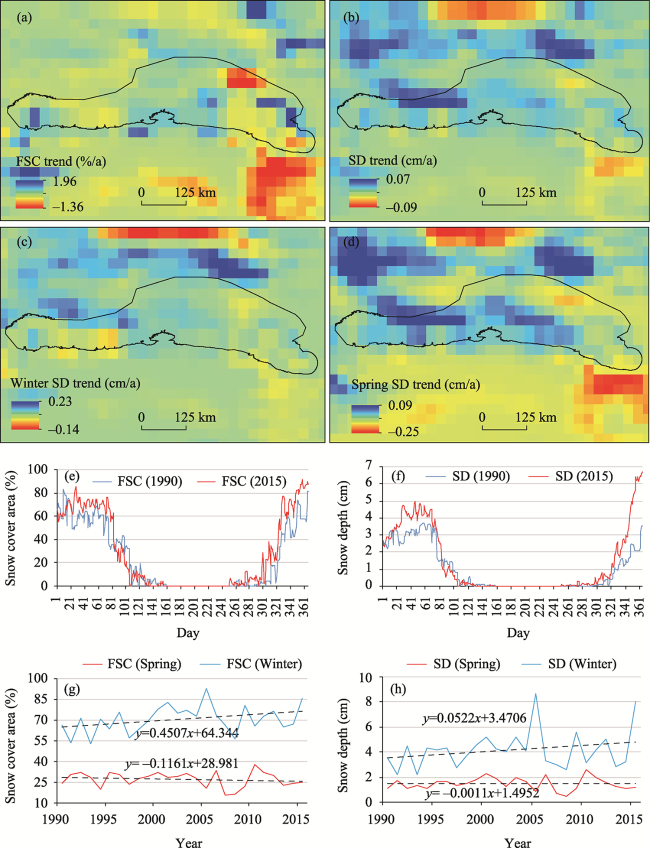
Figure 9 Variations in annual and seasonal fractional snow cover (FSC) and snow depth (SD) across the eastern Tianshan Mountains from 1990 to 2015 (a and b. Spatial changes in annual FSC and SD; c and d. Spatial changes in winter SD and spring SD; e and f. Daily distribution of FSC and SD; g and h. Multi-annual means of seasonal FSC and SD)
Overall, the increase in SCA during winter and its decrease during spring indicated that more snow meltwater occurred in spring, resulting in a substantial amount of meltwater pouring into downstream lakes and rivers. For example, a notable increase in runoff in April (76.94%) was detected in the Toxkan River post-2002 (Zhang et al., 2020). In the present study, a notable advance in the SCA and SD melting time was found during the spring of 2015 compared to that during the spring of 1990, which indicates a significant rise in snowmelt runoff during the spring period and an advancement in the spring maximum runoff. Interestingly, the accumulation timing for SCA and SD also advanced (Figures 9e and 9f), which means that the melting period for glaciers and snow in autumn decreased, leading to subsequent decreases in meltwater from ice and snow.
Meanwhile, across the eastern TS post-2000, autumn temperatures cooled at a faster rate. Li et al. (2020) suggested that this cooling trend could be linked to a recent significant Eurasian cooling trend in autumn caused by North Pacific sea surface temperatures and the strengthening of the Siberian high. Nonetheless, despite the cooling in autumn temperatures, a longer melting period of glaciers and snow persisted in the eastern TS from early November compared to those in other TS regions. This has further increased the amount of meltwater reaching downstream lakes and rivers.

5.2 Variations in glacial lakes

5.2.1 Scales of glacial lakes

Among these four types of glacial lakes, proglacial lakes in particular show a stronger relationship with the advance and retreat of upper lake-terminating glacier termini (Song et al., 2014; Song and Sheng, 2016; Falatkova et al., 2019). Glacial lakes often expand as their contract glacier recedes. The past half-century of global warming has led to glacier mass loss in the TS reaching 5.4 ± 2.8 Gt/a (Farinotti et al., 2015). Over the past 20 years, glacial lakes in the mountains expanded at a rate of approximately 0.8%/a ± 0.1%/a, with half of the lakes in the eastern TS (Wang et al., 2013). In turn, the enhanced melting of exposed ice cliffs and beneath supraglacial lakes substantially aggravated the shielding effect of supraglacial debris and resulted in increased amounts of meltwater flowing down into glaciers via crevasses (Ragettli et al., 2016; Wu et al., 2020).
Glacial lake changes in TS show notable differences in their contract glaciers. For example, the total number and area of glaciers in the central TS account for 41.91% and 59.31%, respectively, of glaciers across the entire TS region, with the number and area of glacial lakes accounting for 44.16% and 55.39%, respectively. However, the change rates of glacial lakes are not only directly affected by the number and area of regional glaciers, but are closely related to the speed of glacier retreat and mass loss. For instance, over the study period, central TS had the largest number and area of glacial lakes, but also showed the slowest growth rates, at 0.81%/a and 0.49%/a, respectively. Conversely, the eastern TS had the smallest glacier area, with a mean single glacier area measuring less than 0.5 km2 and only 5 glaciers with a glacier size of more than 5 km2, but the glacial lakes in this region showed the highest speed in numerical increase and areal expansion.
Small- to medium-scale glaciers are particularly sensitive to climate change. The smaller the glacial lake, the greater the short-term response to climate change by accelerated glacier melt, particularly for small glacial lakes, e.g., glacial lakes (<0.2 km2) in the Third Pole region (Zhang et al., 2015). An earlier study indicated that 80.5% of the growing glacial lakes in the Amu Darya River were smaller than 0.025 km2 during 1968-2009 (Mergili et al., 2013). Moreover, according to statistics from the first CGI and RGI 6.0, the number and area of glaciers in the eastern TS decreased by 20.65% and 45.22%, respectively, from the 1960s/1970s to the 2010s, which may explain the accelerated expansion of glacial lakes in those regions during the study period.
Our study also showed that the lower elevation of glaciers and equilibrium lines in the eastern TS was another contributing factor affecting glacier changes. For example, the average glacier terminal altitude in the northern TS was approximately 3639 m, followed by the eastern TS with 3799 m, while that in the western and central TSs was approximately 3824 m and 3937 m, respectively. Under warming conditions, medium- and small-scale glaciers in low-altitude regions are more sensitive to temperature changes. As was mentioned previously, this was particularly evident in the eastern TS, where most of the glaciers were medium and small.

5.2.2 Types of glacial lakes

The glacial types of the eastern TS were valley, cirque, and hanging. Additionally, new (post-1990) glacial lakes were located ahead of glaciers as proglacial and extraglacial lakes. Large-scale glaciers, especially valley-type ones, often develop large glacial lakes at their termini (Figures 10a and 10b). From 1990 to 2015, the glacial lakes in the study area exhibited a higher expansion rate when their contracted glacier areas were large (Figure 10c). In total, 41 new glacial lakes appeared, 30 of which were fed mainly by valley or compound valley glaciers (Table 3).
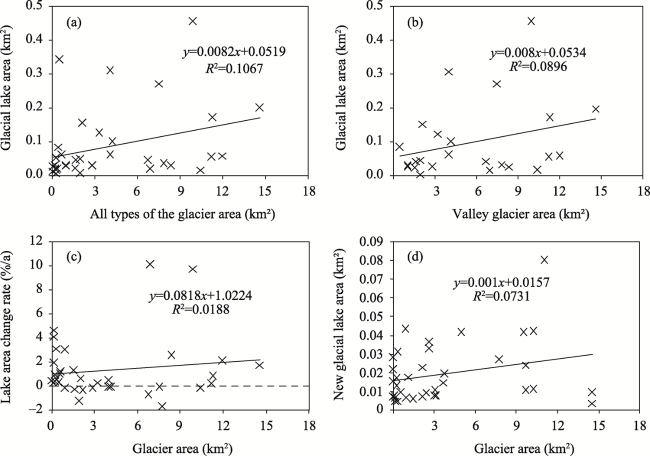
Figure 10 The relationships between the scales and changes in the glacial lake area and the scales of types of lake-terminating glaciers (a. Between the increased glacial lake area and all types of lake-terminating glacier areas; b. Between the increased glacial lake area and the valley lake-terminating glacier area; c. Between the change rates in the glacial lake area and the scales of lake-terminating glacier areas; d. Between new glacial lake areas and the scales of lake-terminating glacier areas)
Table 3 Variations in glacial lakes with different types of lake-terminating glaciers in the eastern Tianshan Mountains during 1990-2015
Glacier type Lake type Number change Area change (km²)
Valley glacier Increased/Extinct lakes 30/7 0.51/−0.09
New/Extinct lakes 30/1 0.54/−0.08
Cirque glacier Increased/Extinct lakes 10/0 0.13/0
New/Extinct lakes 7/1 0.08/−0.004
Hanging glacier Increased/Extinct lakes 2/0 0.04/0
New/Extinct lakes 4/0 0.07/0
Even with the continuous expansion of glacial lakes, a few lakes had shrunk and even completely disappeared in the eastern TS (Table 4). For example, seven glaciers shrunk during 1990-2015 and two glacial lakes disappeared, which overall accounted for an approximate areal decrease of 0.10 km2 (9.89%). In the Barkol Range, one glacial lake disappeared, likely owing to the disappearance of the connecting mother glacier, which was proven by comparing inventories from the 1960/70s and the 2010s. The other glacial lake that disappeared may have been affected by the open channel forced by increased glacial meltwater from the upper contract glaciers (three large valley glaciers and two hanging glaciers). Based on the combined Landsat images and the high-resolution World-View 2 imagery, the lake area was larger in 1990, while since 2000, hardly any lake boundary can be located. Moreover, several small lakes appeared in the downstream regions, and obvious streamlines were found between the old lake basin and these smaller lakes, further confirming the disappearance of the glacial lake. The average slope of the streamline in the upper part of the glacial lake was approximately 13.63°. In response to a warming climate and subsequent rapid glacier shrinkage, a continuous increase in meltwater may affect or destroy lake basins in downstream regions.
Table 4 Variations in the newly formed and extinct glacial lakes in the eastern and central Tianshan Mountains during 1990-2015
Regions Eastern Tianshan Central Tianshan
New lakes Extinct lakes New lakes Extinct lakes
Number change 41 −2 67 −72
Area change (km²) 0.70 −0.02 0.73 −0.77

5.3 Expansion rates of glacial lakes in the eastern TS and other alpine regions

Under global warming, positive expansion trends in alpine glacial lakes have generally been observed (Sakai and Fujita, 2017; Maurya et al., 2018; Shugar et al., 2020; Wang et al., 2020). From 1990 to 2018, total glacial lake number, area and volume around the world increased by 53%, 51% and 48%, respectively. Currently, the formation rate of new glacial lakes (number and area) in the Alps represents an eight-fold increase since the Little Ice Age (Buckel et al., 2018). Moreover, proglacial lakes in many regions of the Andes Mountains have been developing in response to glacier recession (Cook et al., 2016). A notable number increase (43%) in glacial lakes and areal extent (7%) were also detected in the central and Patagonian Andes from 1986 to 2016 (Narama et al., 2018). Likewise, a 35% increase in glacial lake volume was found in the northern Andes for 2015-2018 compared to 1990-1999 (Shugar et al., 2020). In the Hindu Kush Himalayan region, 92% of total surface water was determined to be supplied by glacier-snow meltwater (Brown et al., 2014). In response to a warming climate, sustained glacier shrinkage in the Himalayas Mountains has gradually expanded to more than 5000 glacial lakes (Veh et al., 2020).
In HMA, glacial lakes exhibited total area increases of 15.2% during 1990-2018 (Wang et al., 2020). In contrast, glacial lakes in the Hindu Kush and the Karakorum decreased by 20%-65% during 1990-2009 (Gardelle et al., 2011). Compared to other mountains, those glacial lakes in the TS showed a relatively higher expansion rate. For example, proglacial lakes expanded in area by 94% during the 1990s-2015 (Zheng et al., 2019), while 40.8% of the glacial lakes in the Amu Darya River basin exhibited a growing trend (Mergili et al., 2013). Glacial lakes above 3100 m in the Djungarskiy Alatau region contributed 82.89% to the total alpine lake number (Kapitsa et al., 2017). It is worth noting that the expansion of glacial lakes in the eastern TS since 1990 contributed nearly half of the area expansion for the entire TS (Wang et al., 2013).
Compared to those in other TS ranges, glacial lakes in the eastern TS mainly increased in number. Many glacial lakes were detected in other parts of the TS. For example, 67 new glacial lakes were detected in the Tomor region of the central TS, which features large-scale glaciers (Figures 11a and 11b). This represents an increase of 56.30% and 12.47% in the lake number and area, respectively, during the study period. However, in the same region, the number of glacial lakes that disappeared increased to 72, which represents a decrease of 60.50% and is equivalent to the total glacial lake area reduction (13.16%) (Table 4). In the eastern TS, the number of glacial lakes increased by 40 (67.8%), with an area expansion of 22.39%; only two glacial lakes disappeared in this region, which corresponded to an area decrease of less than 1%.
The analysis of the Tomor region of the TS from 1990 to 2010 showed that the disappeared glacial lakes were mainly concentrated in the valleys and were situated on the surface of the valley glaciers. The concentrations were particularly evident in the southeastern portion of the TS (Figure 11c). Several typical glacial lakes in valley basins were then compared to explore the reasons for their disappearance. In one case, the Merzbacher Lake area decreased significantly during 1990-2000 owing to the advancement of the upper northern Inylchek glacier between October 12 and November 13, 1996, with its terminal surging by approximately 3.7 km (Figures 11e-11g). In addition, recent increases in glacial lake outburst floods have resulted in substantial water loss by releasing the main river and disturbing the basins of downstream glacial lakes, which may largely be caused by sediment carried by outburst floods.
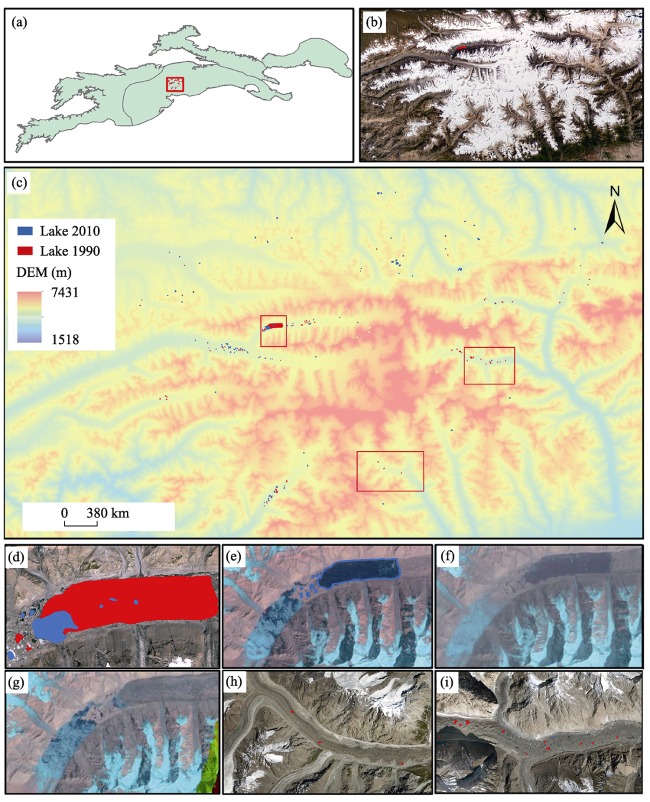
Figure 11 Glacial lake variations in the Tomor region, central Tianshan Mountains from 1990 to 2010 (a and b. Distribution of glaciers; c. Glacial lake variations during 1990-2010; d. Merzbacher Lake variations during 1990-2010; e, f, and g. Variations in areas of the Merzbacher Lake and its upper Inylchek glacier in August 22, 1989, September 1, 1996, and July 18, 1997, respectively; h and i. Extinct supraglacial lakes on the surface of the big valley glaciers during 1990-2010; the images were acquired in 2015/2016.)
As shown in Figures 11h and 11i, many glacial lakes (supraglacial lakes) disappeared on the surfaces of long, large-scale valley glaciers in the TS. Supraglacial lakes are generally unstable water bodies that form on glacier ice, because their spatial and temporal distributions are highly constrained by glacier hydrology and their locations may vary year to year. In contrast, no supraglacial lakes were found in the eastern TS, which may be due to the stability of lake-terminating glaciers and lake basins. In the study region, new glacial lakes in the eastern TS were concentrated in the upper valley glaciers. Jia et al. (2013) suggested that most of these new glacial lakes are proglacial lakes that were formed by glaciation and damming in valleys. Clearly, the new lakes were formed because of meltwater increases from the upper glaciers.
Meanwhile, owing to regional differences, other factors may also affect lake changes, such as lake depth, surface conditions, and infiltration into the lake basin. Daiyrov et al. (2018) discussed lake changes in relation to lake surface conditions and ground infiltration in the Issyk-Kul basin in the Terskey and Kungoy ranges in the northern TS. The authors found that the new, extinct, and temporary lakes varied considerably in these mountains and that the variations were not directly driven by local short-term changes in summer temperature, precipitation, or glacier recession. Instead, they appear to be influenced mainly by regional geomorphological conditions. Buckel et al. (2018) noted that the distribution of glacial lakes at certain elevations in the Alps was controlled by the erosion and deposition dynamics of glaciers rather than the size of the glaciated area.
To gain a better understanding of the changes occurring in glacial lakes across the entire TS, we examined alpine glacial lakes within 10 km of the glacier termini, during 1990-2015. Among the four TS regions, the highest increase in the number and areal expansion of glacial lakes was observed in the eastern TS. Specifically, the number of lakes in the eastern TS increased by 71.93%, and their area expanded by 44.90%, yielding growth rates of 2.88%/a and 1.80%/a, respectively. The northern and western TS regions exhibited expansion rates of 1.57%/a and 0.92%/a, respectively, while glacial lakes in central TS exhibited the slowest expansion at a rate of 0.85%/a (Figure 12). However, different lake types develop and respond differently to climate change, which makes it difficult to monitor the continuous replenishment effect of glacial meltwater or precipitation from upstream sources, such as supraglacial, proglacial, extraglacial, and non-glacial lakes.
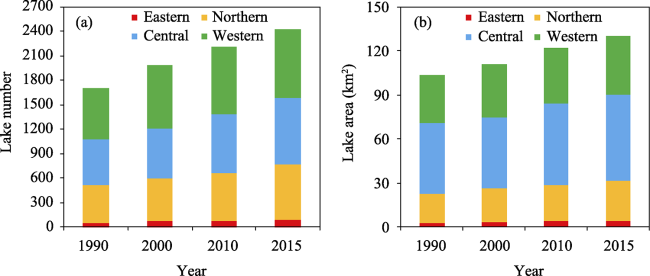
Figure 12 Variations in the number and area of glacial lakes in the Tianshan Mountains between 1990 and 2015 (a. Variations in the glacial lake number; b. Variations in the glacial lake area)
As shown in Figure 13, both proglacial and extraglacial lakes exhibited more notable expansion rates compared to non-glacial lakes. These rates were 6.47%/a, 5.51%/a, 3.49%/a, and 1.44%/a for the eastern, western, northern, and central TS, respectively. Spatially, the extraglacial and non-glacial lakes in the eastern TS exhibited higher expansion rates of 2%/a and 1.75%/a, respectively, in comparison to those in other TS regions (Figures 13c and 13d). While it is noteworthy that there were no areal changes in the supraglacial lakes in the eastern and northern TS, this was mainly attributable to the lack of supraglacial lakes in these regions. In the central TS, the supraglacial lakes exhibited a slightly negative trend during the study period, with rates of −0.35%/a, while the lakes in the western TS exhibited a slightly positive trend, at a rate of 0.06%/a (Figure 13a).
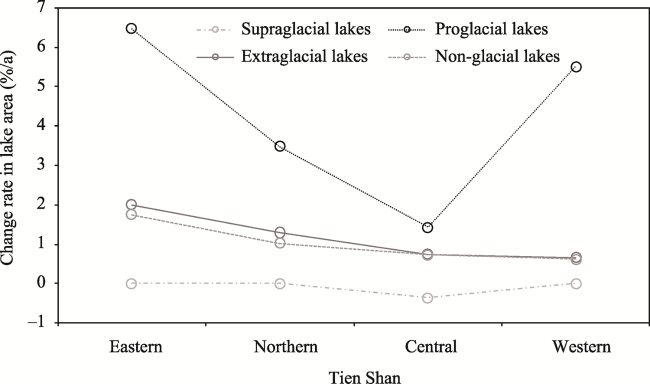
Figure 13 Annual changing rates of different types of alpine lake areas across the Tianshan Mountains from 1990 to 2015
Overall, the variations in different types of alpine lakes across the four TS regions indicate the lakes’ heightened sensitivity to climate change and glacier shrinkage; this was particularly true for the proglacial lakes and the eastern TS. Glacial lakes in this region are small to medium and are located at lower altitudes, which makes them rapidly responsive to climate change. In addition, stable upper glaciers and downstream lake basins provide suitable conditions for the expansion of the lake area. The highest expansion rate of non-glacial lakes may have been caused by increases in precipitation or snow meltwater from the upper regions.

5.4 Potential effects on water resources

The presence and expansion of glacial lakes could prevent water loss from interannual or annual changes in glacier or snow meltwater, as a considerable amount of meltwater from glacier-snow is retained by glacial lake expansion (Wang et al., 2016). For example, recent water storage in the TP showed an increasing trend, which Zhang et al. (2013) attributed to the increased water mass in lakes, particularly in the central region. Deng et al. (2018) also discovered the expanded lakes have drove increasing terrestrial water storage in the TP during 2002-2016. These alpine lakes are mainly distributed in higher altitudes with lower temperatures, which makes it unlikely that the water loss was caused by strong evaporation, given that the process of evaporation is less robust at higher altitudes.
Water storage changes in alpine lakes have a major influence on the sustainable utilization and management of water resources in downstream regions. In analyzing water storage changes in the TS since 2003, Chen et al. (2016) and Deng et al. (2019) discovered that the decreasing water storage in the central TS was mainly related to glacier mass loss, which has proved mainly related to climatic warming, especially east of 80°E. Meanwhile, shrinking glaciers caused by rising temperatures were the primary cause of the decrease in water storage in the southern TP since 2012, which was related to greater precipitation amounts and lake expansion in recent years (Deng et al., 2018). Water storage loss in the eastern TS is not much greater than that in the central and northern TS under a warming climate. Further, the loss may be attributable to the higher increase and expansion trend in glacial lakes in the eastern TS compared with the other TS regions. The significant numerical increase and areal expansion of glacial lakes in the eastern mountains are naturally accompanied by a significant water reserve from glacier meltwater. Hence, the water will still be reserved in the mountains and thus delay the water loss for a time. In contrast, the continued disappearance and shrinkage of the glacial lakes in the Tomor region in recent years will aggravate the loss in water resources for total water storage.

6 Conclusions

In this study, we investigated spatiotemporal changes in alpine lakes across the eastern TS during the 1990-2015 period. As of 2015, 105 alpine lakes covering a total area of 4.04 ± 0.27 km2 were cataloged in the eastern TS, 91 of which were glacial lakes, accounting for 86.67% and 93.55% of the total lake number and area, respectively. From 1990 to 2015, the total alpine lake number and area increased by 64.06% and 47.92%, respectively. During 1990-2000, alpine lakes exhibited an accelerated expansion trend, with glacial and non-glacial lake areas increasing by 0.77 ± 0.71 km2/10a and 0.16 ± 0.10 km2/10a, respectively. During 2000-2010, the glacial lakes exhibited a slower rate of 0.13 ± 0.80 km2/10a, while the non-glacial lake area shrank by 0.17 ± 0.10 km2/10a. Interestingly, since 2010, the expansion rates of the glacial and non-glacial lakes have shown aggravated trends, at rates of 0.68 ± 1.74 km2/10a and 0.18 ± 0.20 km2/10a, respectively. The alpine lakes changed in different ways. During 1990-2015, the expansion rate of glacial lakes was 0.49 ± 0.09 km2/10a, which accounted for 94.17% of total alpine lake area expansion, while non-glacial lakes experienced intermittent expansion at a rate of 0.04 ± 0.04 km2/10a.
Compared to those in other parts of the TS, the glacial lakes in the eastern TS exhibited a notable expansion trend, which was due to the increase in glacial meltwater from small and medium glaciers and meltwater from the snow pack, as these are more sensitive to climate change. In general, among the four defined lake types across the TS from 1990 to 2015, proglacial and extraglacial lakes exhibited more notable expansion rates than non-glacial lakes, particularly in the eastern TS. The new and expanded glacial lakes in the eastern TS were mainly concentrated before the larger valley-type glaciers and had obviously originated from the increased glacial meltwater supply caused by higher temperatures. Overall, widespread rises in temperature and glacial wastage were the primary causes of the steady expansion of glacial lakes, especially for those linked to small and medium glaciers distributed in the eastern TS, where warming has increased rapidly.

Acknowledgments

We sincerely thank Dr. Wang Xin from Hunan University of Science and Technology for providing glacial lake area data from 1990 to 2010.

Supplementary Material

Supplementary figures

Figure S1 Variations in annual temperature and precipitation at different elevations across the Tianshan Mountains region from 1990 to 2015 (a. Variations in temperature; b. Variations in precipitation; c. Box plots of annual temperature trends; d. Box plots of annual precipitation trends)
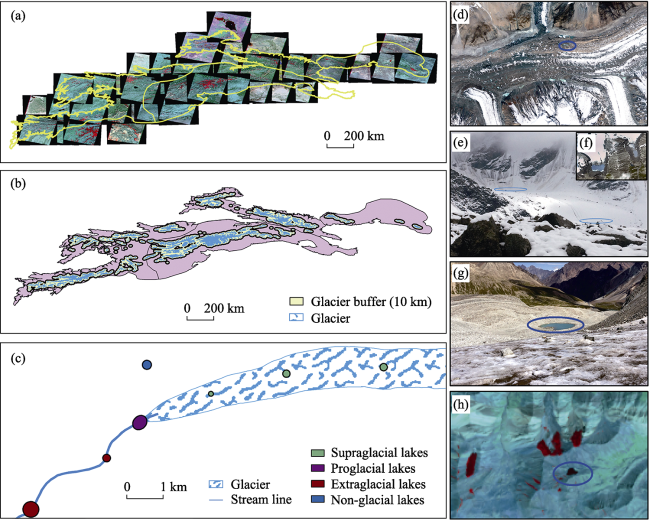
Figure S2 Diagram showing classification of alpine lakes across the Tianshan Mountains (TS) region (a. The available Landsat images used in the TS during 2015; b. These alpine lakes within a distance of 10-km glacier buffer were extracted in the TS; c. The position of different types of alpine lakes to the glaciers; d, e, f, g and h. Imagery and photos of supraglacial lakes, proglacial lakes, extraglacial lakes and non-glacial lakes in the TS)

Supplementary methodological information

Snow depth data

In this study, the Long-Term Snow Depth Product for China (LSDPC), with a spatial resolution of 0.25°, provided by the Cold and Arid Regions Sciences Data Center at Lanzhou during 1979-2015, was used to observe SCA and SD change. The original dataset were retrieved from the scanning multichannel microwave radiometer (SMMR, 1979-1987), special sensor microwave/imager (SSM/I, 1987-2007), and special sensor microwave imager/ sounder (SSMI/S, 2008-2015), which were provided by the National Snow and Ice Data Center (NSIDC). However, since the sensors are mounted on different platforms, there may be inconsistencies in the data, cross-calibration of the bright temperature may improve the consistency. Compared to the SSM/I and SSMI/SSD datasets, the dataset has higher accuracy and lower biases (Dai et al., 2015), which are adjusted and validated using the meteorological stations, regarding frost-cover, the liquid water content in snow layer, vegetation, and surface water bodies. The accuracy of the LSDPC has been greatly improved by cross-calibrating of bright temperature of different sensors; it has also been improved through applying a modified Chang algorithm that uses the decision-tree method (Che et al., 2008; Dai et al., 2015).

Snow cover area mapping calculation

Snow is considered a regionally important buffer in the hydrological system against drought and could mitigate the speeds of a warming climate. Hence, the response of Snow cover area to climate change has a greater influence on the regional hydrological process. The length of snow cover area duration is an indicator of snow phenology and has either a greater or lesser effect on the regulation of the hydrological system (Yang et al., 2019). In this study, normal SCAD is recorded as the number of days annually (January 1 to December 31) when SD exceeded 1.0 cm (Ke et al., 2016) from 1979-2015. This can be expressed as shown in Equations (1-3):
$~SCA{{D}_{j}}=\sum\nolimits_{i=1}^{m}{({{S}_{i}})}$
${{S}_{i}}=~\left\{ \begin{matrix} 1,\ {{S}_{i}}\ge 1 \\ ~~0,\ {{S}_{i}}<1 \\ \end{matrix} \right.$
$~FS{{C}_{i}}=\frac{~TN{{P}_{i}}}{N}\text{*}100$
where SCADj is the snow cover area duration in year j (d); m is the number of days beginning with January 1 and ending with December 31 for any given year within the study period; Si is the snow depth of the pixel value, such that if Si < 1, we give it a new value of 0 (indicating no snow cover), whereas if Si ≥ 1, we give it a new value of 1 (indicating snow cover); FSCi is the snow cover area (%) in day i of the study area; TNPi is the total number of these pixels (Si ≥ 1) in day i; N is the total pixel number of the study area.

Identifying different lake types (across the Tianshan region)

Many different types of alpine lakes (mainly glacial lakes) develop in the TS region. These different lake types do not develop and respond to climate change in the same way and may be completely different, which make it difficult to monitor the continuous replenishment effect of glacier meltwater or precipitation from the upstream. As a result, such different types of alpine lakes may cause large errors in the results. Therefore, to accurately analyze the factors of glacial lake expansion in the TS and intuitively monitor the main driving factors, four types of alpine lakes (supraglacial lakes, proglacial lakes, extraglacial lakes and non-glacial lakes) were identified and classified in the entire TS in detail (Figure S2), based on the literature the characteristics of glacial lakes in the TS, and combined the high-resolution WorldView-2, Google Earth and Landsat TM/ETM+/OLI imagery and resolution of 30 m DEM data.
In this study, supraglacial lakes usually in the small sizes forms on the glacier surface and dams by the ice, they mainly appear in the termini of the valley glaciers with the large-scale areas and lengths (Figures S2c and S2d). For the proglacial lakes, which are directly controlled by the advance or retreat of their mother glaciers (Figures S2c, S2e and S2f). In addition, these extraglacial lakes are positioned in front of the glaciers without a direct connection to the glacier termini, but these lakes are directly fed by the glacier meltwater, particularly by these valley glaciers, and many extraglacial lakes in front of the glacier termini from several meters to kilometers you can find (Figures S2c and S2g). For non-glacial lakes, we defined these lakes could not receive the glacier meltwater and no stream lines found between the non-glacial lakes and the upper mother-glacier (Figures S2c and S2h).

Supplementary References

Che T, Li X, Jin R et al., 2008. Snow depth derived from passive microwave remote-sensing data in China. Annals of Glaciology, 49(1): 145-154.
Dai L Y, Che T, Ding Y J, 2015. Inter-calibrating SMMR, SSM/I and SSMI/S data to improve the consistency of snow-depth products in China. Remote Sensing, 7(6): 7212-7230.
Ke C Q, Li X C, Xie H J et al., 2016. Variability in snow cover phenology in China from 1952 to 2010. Hrdrology and Earth System Sciences, 20: 755-770.
Yang T, Li Q, Ahmad S et al., 2019. Changes in snow phenology from 1979 to 2016 over the Tianshan Mountains, Central Asia. Remote Sensing, 11(5): 499.
[1]
Aizen V B, Kuzmichenok V A, Surazakov A B et al., 2007. Glacier changes in the Tien Shan as determined from topographic and remotely sensed data. Global and Planetary Change, 56(3): 328-340.

DOI

[2]
Allen R G, Pereira L S, Raes D et al., 1998. Crop Evapotranspiration: Guidelines for Computing Crop Water Requirements, FAO Irrigation and Drainage Paper 56, Food and Agric, Organ, Rome.

[3]
Bolch T, 2007. Climate change and glacier retreat in northern Tien Shan (Kazakhstan/Kyrgyzstan) using remote sensing data. Global and Planetary Change, 56(1): 1-12.

DOI

[4]
Brown M E, Racoviteanu A E, Tarboton D G et al., 2014. An integrated modeling system for estimating glacier and snow melt driven streamflow from remote sensing and earth system data products in the Himalayas. Journal of Hydrology, 519: 1859-1869.

DOI

[5]
Brun F, Berthier E, Wagnon P et al., 2017. A spatially resolved estimate of High Mountain Asia glacier mass balances from 2000 to 2016. Nature Geoscience, 10(9): 668-673.

DOI

[6]
Buckel J, Otto J C, Prasicek G et al., 2018. Glacial lakes in Austria: Distribution and formation since the Little Ice Age. Global and Planetary Change, 164: 39-51.

DOI

[7]
Cai X R, Li Z Q, Zhang H et al., 2021. Vulnerability of glacier change in the Tianshan Mountains region of China. Journal of Geographical Sciences, 31(10): 1469-1489.

DOI

[8]
Chen H Y, Chen Y N, Li W H et al., 2019. Quantifying the contributions of snow/glacier meltwater to river runoff in the Tianshan Mountains, Central Asia. Global and Planetary Change, 174: 47-57.

DOI

[9]
Chen Y N, Li W H, Deng H J et al., 2016. Changes in Central Asia’s water tower: Past, present and future. Scientific Reports, 6: 35458.

DOI

[10]
Cheng W M, Wang N, Zhao S M et al., 2016. Growth of the Sayram Lake and retreat of its water-supplying glaciers in the Tianshan Mountains from 1972 to 2011. Journal of Arid Land, 8(1): 13-22.

DOI

[11]
Cook S J, Kougkoulos I, Edwards L A et al., 2016. Glacier change and glacial lake outburst flood risk in the Bolivian Andes. The Cryosphere, 10(5): 2399-2413.

DOI

[12]
Daiyrov M, Narama C, Yamanokuchi T et al., 2018. Regional geomorphological conditions related to recent changes of glacial lakes in the Issyk-Kul Basin, northern Tien Shan. Geosciences, 8(3): 99.

DOI

[13]
Deng H J, Chen Y N, 2017. Influences of recent climate change and human activities on water storage variations in Central Asia. Journal of Hydrology, 544: 46-57.

DOI

[14]
Deng H J, Chen Y N, Li Y, 2019. Glacier and snow variations and their impacts on regional water resources in mountains. Journal of Geographical Sciences, 29(1): 84-100.

DOI

[15]
Deng H J, Pepin N C, Liu Q et al., 2018. Understanding the spatial differences in terrestrial water storage variations in the Tibetan Plateau from 2002 to 2016. Climatic Change, 151(3/4): 379-393.

DOI

[16]
Engel Z, Šobr M, Yerokhin S A, 2012. Changes of Petrov Glacier and its proglacial lake in the Akshiirak massif, central Tien Shan, since 1977. Journal of Glaciology, 58(208): 388-398.

DOI

[17]
Falatkova K, Šobr M, Neureiter A et al., 2019. Development of proglacial lakes and evaluation of related outburst susceptibility at the Adygine ice-debris complex, northern Tien Shan. Earth Surface Dynamics, 7(1): 301-320.

DOI

[18]
Fang Y, Cheng W M, Zhang Y C et al., 2016. Changes in inland lakes on the Tibetan Plateau over the past 40 years. Journal of Geographical Sciences, 26(4): 415-438.

DOI

[19]
Farinotti D, Longuevergne L, Moholdt G et al., 2015. Substantial glacier mass loss in the Tien Shan over the past 50 years. Nature Geoscience, 8(9): 716-722.

DOI

[20]
Gardelle J, Arnaud Y, Berthier E, 2011. Contrasted evolution of glacial lakes along the Hindu Kush Himalaya mountain range between 1990 and 2009. Global and Planetary Change, 75(1): 47-55.

DOI

[21]
Hall D K, Bayr K J, Schöner W et al., 2003. Consideration of the errors inherent in mapping historical glacier positions in Austria from the ground and space (1893-2001). Remote Sensing of Environment, 86(4): 566-577.

DOI

[22]
Hanshaw M N, Bookhagen B, 2014. Glacial areas, lake areas, and snow lines from 1975 to 2012: status of the Cordillera Vilcanota, including the Quelccaya Ice Cap, northern central Andes, Peru. The cryosphere, 8(2): 359-376.

DOI

[23]
He Y, Yang T B, Ji Q et al., 2015. Glacier variation in response to climate change in Chinese Tianshan Mountains from 1989 to 2012. Journal of Mountain Science, 12(5): 1189-1202.

DOI

[24]
IPCC, 2013. Working Group I Contribution to the IPCC Fifth Assessment Report, Climate Change 2013: The Physical Science Basis: Summary for Policymakers. Cambridge: Cambridge University Press.

[25]
Jia Y, Chen X, Cao L Z et al., 2013. Glacial lake changes and its relation with climate change in Bogda Mountains of Tienshan during 1990-2012. The International Academic Symposium on Remote Sensing and Social Development Conference, 101-110.

[26]
Kapitsa V, Shahgedanova M, Machguth H et al., 2017. Assessment of evolution and risks of glacier lake outbursts in the Djungarskiy Alatau, Central Asia, using Landsat imagery and glacier bed topography modelling. Natural Hazards and Earth System Sciences, 17(10): 1837-1856.

[27]
Lei Y Yao, T Bird, B W et al., 2013. Coherent lake growth on the central Tibetan Plateau since the 1970s: Characterization and attribution. Journal of Hydrology, 483(3): 61-67.

DOI

[28]
Li B, Li Y, Chen Y et al., 2020. Recent fall Eurasian cooling linked to North Pacific sea surface temperatures and a strengthening Siberian high. Nature Communications, 11(1): 5202.

DOI PMID

[29]
Li B L, Zhu A X, Zhang Y C et al., 2006. Glacier change over the past four decades in the Middle Chinese Tien Shan. Journal of Glaciology, 52(178): 425-432.

DOI

[30]
Luo Y, Wang X L, Piao S L et al., 2018. Contrasting streamflow regimes induced by melting glaciers across the Tien Shan - Pamir - North Karakoram. Scientific Reports, 8(1): 16470.

DOI PMID

[31]
Maurya A S, Rai S P, Joshi N et al., 2018. Snowmelt runoff and groundwater discharge in Himalayan rivers: A case study of the Satluj River, NW India. Environmental Earth Sciences, 77(19): 694.

DOI

[32]
Mergili M, Müller J P, Schneider J F, 2013. Spatio-temporal development of high-mountain lakes in the headwaters of the Amu Darya River (Central Asia). Global and Planetary Change, 107: 13-24.

DOI

[33]
Narama C, Daiyrov M, Duishonakunov M et al., 2018. Large drainages from short-lived glacial lakes in the Teskey Range, Tien Shan Mountains, Central Asia. Natural Hazards and Earth System Sciences, 18(4): 983-995.

[34]
Narama C, Kääb A, Duishonakunov M et al., 2010. Spatial variability of recent glacier area changes in the Tien Shan Mountains, Central Asia, using Corona (-1970), Landsat (-2000), and ALOS (-2007) satellite data. Global and Planetary Change, 71(1/2): 42-54.

DOI

[35]
Niederer P, Viktor B, Natasha E et al., 2008. Tracing glacier wastage in the northern Tien Shan (Kyrgyzstan/Central Asia) over the last 40 years. Climatic Change, 86(1): 227-234.

DOI

[36]
Petrov M A, Sabitov T Y, Tomashevskaya I G et al., 2017. Glacial lake inventory and lake outburst potential in Uzbekistan. Science of the Total Environment, 592: 228-242.

DOI

[37]
Pritchard H D, 2019. Asia’s shrinking glaciers protect large populations from drought stress. Nature, 569(7758): 649-654.

DOI

[38]
Qiao B J, Zhu L P, 2019. Difference and cause analysis of water storage changes for glacier-fed and non-glacier-fed lakes on the Tibetan Plateau. Science of the Total Environment, 693: 133399.

DOI

[39]
Qin D H, Yao T D, Ding Y J et al., 2016. Glossary of Cryospheric Science. Beijing: China Meteorological Press, 11. (in Chinese)

[40]
Rabus B, Eineder M, Roth A et al., 2003. The shuttle radar topography mission: A new class of digital elevation models acquired by spaceborne radar. ISPRS Journal of Photogrammetry and Remote Sensing, 57(4): 241-262.

DOI

[41]
Ragettli S, Immerzeel W W, Pellicciotti F, 2016. Contrasting climate change impact on river flows from high-altitude catchments in the Himalayan and Andes mountains. Proceedings of the National Academy of Sciences, 113(33): 9222-9227.

DOI

[42]
Sakai A, Fujita K, 2017. Contrasting glacier responses to recent climate change in High-mountain Asia. Scientific Reports, 7(1): 13717-13718.

DOI PMID

[43]
Shen Y J, Shen Y J, Fink M et al., 2018. Trends and variability in streamflow and snowmelt runoff timing in the southern Tianshan Mountains. Journal of Hydrology, 557: 173-181.

DOI

[44]
Shi Y F, 2008. Concise Glacier Inventory of China. Shanghai: Shanghai Popular Science Press. (in Chinese)

[45]
Shugar D H, Burr A, Haritashya U K et al., 2020. Rapid worldwide growth of glacial lakes since 1990. Nature Climate Change, 10(10): 939-945.

DOI

[46]
Song C Q, Huang B, Richards K et al., 2014. Accelerated lake expansion on the Tibetan Plateau in the 2000s: Induced by glacial melting or other processes? Water Resources Research, 50(4): 3170-3186.

DOI

[47]
Song C Q, Sheng Y W, 2016. Contrasting evolution patterns between glacier-fed and non-glacier-fed lakes in the Tanggula Mountains and climate cause analysis. Climatic Change, 135(3/4): 1-15.

DOI

[48]
Sorg A, Bolch T, Stoffel M et al., 2012. Climate change impacts on glaciers and runoff in Tien Shan (Central Asia). Nature Climate Change, 2(10): 725-731.

DOI

[49]
Treichler D, Kääb A, Salzmann N et al., 2019. Recent glacier and lake changes in High Mountain Asia and their relation to precipitation changes. The Cryosphere, 13(11): 2977-3005.

DOI

[50]
Veh G, Korup O, Walz A, 2020. Hazard from Himalayan glacier lake outburst floods. Proceedings of the National Academy of Sciences, 117(2): 907-912.

DOI

[51]
Wang X, Ding Y J, Liu S Y et al., 2013. Changes of glacial lakes and implications in Tian Shan, central Asia, based on remote sensing data from 1990 to 2010. Environmental Research Letters, 8(4): 44052.

DOI

[52]
Wang X, Guo X Y, Yang C D et al., 2020. Glacial lake inventory of High-mountain Asia in 1990 and 2018 derived from Landsat images. Earth System Science Data, 12(3): 2169-2182.

DOI

[53]
Wang X, Liu Q H, Liu S Y et al., 2016. Heterogeneity of glacial lake expansion and its contrasting signals with climate change in Tarim Basin, Central Asia. Environmental Earth Sciences, 75(8): 1-11.

DOI

[54]
Wang X W, Gong P, Zhao Y Y et al., 2013. Water-level changes in China’s large lakes determined from ICESat/GLAS data. Remote Sensing of Environment, 132: 131-144.

DOI

[55]
Woolway R I, Kraemer B M, Lenters J D et al., 2020. Global lake responses to climate change. Nature Reviews Earth & Environment, 1(8): 388-403.

[56]
Wu K, Liu S, Jiang Z et al., 2020. Surging dynamics of glaciers in the Hunza Valley under an equilibrium mass state since 1990. Remote Sensing, 12(18): 2922.

DOI

[57]
Xing W C, Li Z Q, Zhang H et al., 2017. Spatial-temporal variation of glacier resources in Chinese Tianshan Mountains since 1959. Acta Geographica Sinica, 72(9): 1594-1605. (in Chinese)

[58]
Yang T, Li Q, Ahmad S et al., 2019. Changes in snow phenology from 1979 to 2016 over the Tianshan Mountains, Central Asia. Remote Sensing, 11(5): 499.

DOI

[59]
Yang X, Pavelsky T M, Allen G H, 2020. The past and future of global river ice. Nature, 577(7788): 69-73.

DOI

[60]
Yao J Q, Mao W Y, Chen J et al., 2021. Recent signal and impact of wet-to-dry climatic shift in Xinjiang, China. Journal of Geographical Sciences, 31(9): 1283-1298.

DOI

[61]
Yao X, Liu S Y, Han L et al., 2018. Definition and classification system of glacial lake for inventory and hazards study. Journal of Geographical Sciences, 28(2): 193-225.

DOI

[62]
Ye Z, Liu H, Chen Y et al., 2017. Analysis of water level variation of lakes and reservoirs in Xinjiang, China using ICESat laser altimetry data (2003-2009). Plos One, 12(9): e183800.

[63]
Zhang G Q, Bolch T, Allen S et al., 2019a. Glacial lake evolution and glacier-lake interactions in the Poiqu River basin, central Himalaya, 1964-2017. Journal of Glaciology, 65(251): 347-365.

DOI

[64]
Zhang Q F, Chen Y N, Li Z et al., 2020. Recent changes in water discharge in snow and glacier melt-dominated rivers in the Tienshan Mountains, Central Asia. Remote Sensing, 12(17): 2704.

DOI

[65]
Zhang G Q, Yao T D, Chen W F et al., 2019b. Regional differences of lake evolution across China during 1960s-2015 and its natural and anthropogenic causes. Remote Sensing of Environment, 221: 386-404.

DOI

[66]
Zhang G Q, Yao T D, Piao S L et al., 2017. Extensive and drastically different alpine lake changes on Asia’s high plateaus during the past four decades. Geophysical Research Letters, 44(1): 252-260.

DOI

[67]
Zhang G Q, Yao T D, Xie H J et al., 2013. Increased mass over the Tibetan Plateau: From lakes or glaciers? Geophysical Research Letters, 40(10): 2125-2130.

DOI

[68]
Zhang G Q, Yao T D, Xie H J et al., 2015. An inventory of glacial lakes in the Third Pole region and their changes in response to global warming. Global and Planetary Change, 131: 148-157.

DOI

[69]
Zheng G X, Bao A M, Li J L et al., 2019. Sustained growth of high mountain lakes in the headwaters of the Syr Darya River, Central Asia. Global and Planetary Change, 176: 84-99.

DOI

Outlines

/