Research Articles

Perception of pleasure in the urban running environment with street view images and running routes

  • ZHANG An , 1, 2 ,
  • SONG Liuyi 1, 2 ,
  • ZHANG Fan 3
Expand
  • 1. State Key Laboratory of Resources and Environmental Information System, Institute of Geographic Sciences and Natural Resources Research, CAS, Beijing 100101, China
  • 2. College of Resources and Environment, University of Chinese Academy of Sciences, Beijing 100190, China
  • 3. Department of Civil and Environmental Engineering, The Hong Kong University of Science and Technology, Hong Kong, China

Zhang An (1982-), Associate Professor, specialized in cartography and GIS. E-mail:

Received date: 2022-03-07

  Accepted date: 2022-09-13

  Online published: 2022-12-25

Supported by

China’s National Key Research and Development Program(2017YFB0503500)

National Natural Science Foundation of China(41901321)

Abstract

The urban environment affects human behavior and health. Most studies on the feelings of street spaces have not considered a specific kind of realistic scene, such as running. To overcome this limitation, we explored the relationship between the urban environment and the pleasure of running. We collected 8260 street view images from 153 running routes in Beijing and invited more than 400 volunteers of different genders and ages to rate their sense of pleasure in street view images of the urban running environment through an online survey. Then, the proportion of visual elements in street images was extracted based on semantic segmentation, and the landscape was divided. Finally, a linear mixed model was used to predict the pleasure scores of different gender and age groups for different landscapes. The results show significant differences in the pleasure scores for different landscapes and age groups. Middle-aged people's sense of pleasure was lower than that of the young and the elderly. More greenery was associated with a higher pleasure score, while the proportion of urban elements such as buildings was negatively correlated with the pleasure score. The results indicate that running in a natural landscape is pleasurable and beneficial for mental health.

Cite this article

ZHANG An , SONG Liuyi , ZHANG Fan . Perception of pleasure in the urban running environment with street view images and running routes[J]. Journal of Geographical Sciences, 2022 , 32(12) : 2624 -2640 . DOI: 10.1007/s11442-022-2064-8

1 Introduction

With the acceleration of global urbanization, 68% of the world’s population is expected to live in cities by 2050 (United Nations, 2018). Rapid urbanization increase the risk factors of illness (Gong et al., 2012), especially those related to the environment and society. In particular, urbanization induces mental health problems. According to the Chinese National Health and Health Survey released in 2012, the prevalence of mental health diseases in urban areas reached 6% (Yang et al., 2018). Urban residents in China are more psychologically depressed than ever (Gupta et al., 2016).
Environmental psychology refers to people’s subjective feelings and psychological judgments about their environment and its changes. People’s perception of the public environment can impact people’s external behavior, physical health, and mental health (Moser et al., 2003). In recent years, studies on local environment perception of small samples have been carried out, and an on-site manual survey is one of the main study methods. Several studies have focused on people’s feelings when they are exposed to different street spaces (Jiang et al., 2014; Tang et al., 2016). However, these studies have often been labor- and cost-intensive.
Map service providers such as Google, Baidu, and Tencent have provided panoramic street views. Street view images combined with deep learning technology can provide a city’s complex and specific geospatial information (Zhang et al., 2019), such as the tree coverage, building form, sky view factor, and green visual ratio (Yin et al., 2016; Seiferling et al., 2017; Helbich et al., 2021; Xia et al., 2021), which can be similar to what people see at the scene (Gebru et al., 2017; Middel et al., 2019). The urban perception based on street view images has become possible (Li et al., 2020). Previous studies have found that the green visual ratio and motor vehicle lanes significantly impact street safety (Liu, 2016). Physical activity and community cohesion positively correlate with the street view greening index. Stress perception and environmental pollution are also significantly correlated with the street view greening index (Lowe, 1999). Human perceptions of a large-scale urban region can be measured using machine learning (Zhang et al., 2018). However, human perceptions and emotions are extraordinarily complex and affected by many factors (Luo et al., 2012). Most research has not considered a specific kind of realistic scene, such as running. Running is a popular physical exercise and involves an effective method of aerobic breathing. A suitable urban environment can provide people with a pleasant sensory experience and affect activities such as running.
We used Beijing as the research area to study the human perception of pleasure in urban running scenes. We collected street view images along the running routes and identified the type and proportion of urban visual elements in the running environment through image semantic segmentation methods. We combined the pleasure perception scores of invited volunteers using some street view images in the running environment, using an online questionnaire. The contributions of various visual elements in the street view of the running scene to the pleasure of running were quantified. The research results encourage people to find pleasant recreation spaces in urban areas and provide constructive suggestions for a healthy city.

2 Data and method

2.1 Data sources and data acquisition

2.1.1 Running routes

In this study, we selected 153 running routes in the central urban area of Beijing in Adidas Runtastic, a running App (https://www.runtastic.com/) that can monitor and record the user’s activity information and provide other route information query functions. There were 527 participants. The number of some popular running track users was 25. The selected running route data can represent the runners’ preferences for these regions to a certain extent. To obtain the true viewing range of the runner, we calculated the azimuth of each running route point according to the direction of the track (Figure 1). The azimuth is the horizontal angle from the north direction line of a point to the target direction line in a clockwise direction, the true north is 0°.
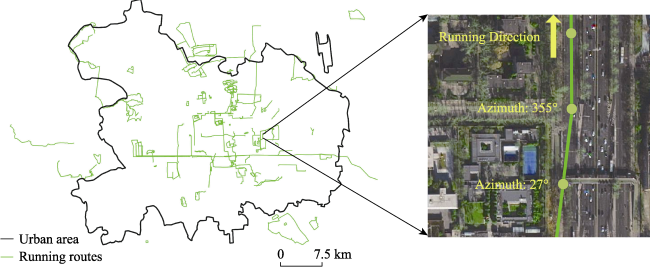
Figure 1 Schematic diagram of running routes in Beijing

2.1.2 Street view images

The street view images were collected from the Baidu map, and 10,232 sampling points were obtained on the running track at 100-m intervals. The sampling method of 100-m intervals can better retain the visual information in an urban space along the route and reduce the repetition as much as possible. The calculated azimuth of running route points was used as the street view image’s sampling perspective to reproduce the runners’ current perspective range. Owing to the closure of some road sections and other reasons, some street view images were missing. Finally, 8260 valid sample points of street view images were obtained.

2.1.3 Questionnaire evaluation

Based on the Tencent questionnaire platform (https://wj.qq.com/), we conducted a questionnaire to invite volunteers to self-assess their sense of pleasure in street view images of the urban running environment. The street view images of 101 sampling points were randomly selected. The questionnaire set the basic demographic options of age and gender, randomly displayed 10 street view images to the volunteers, and required the volunteers to evaluate their pleasure in each image. Referring to previously developed psychological scales (Moser et al., 2003), we measured pleasure on five levels. The higher the score, the stronger the perception of pleasure in the street view image.
Table 1 Pleasure scales
Scores 1 2 3 4 5
Corresponding emotion Very bad Bad Not bad Pleasant Very pleasant
The questionnaire was distributed on social media, and 446 valid questionnaires were received. Of the volunteers, 65.7% were between 10 and 29 years old, 29.6% were 30-49 years old, and 4.7% were over 50 years old. A total of 4460 pleasure-rating samples were collected from valid questionnaires, and the average pleasure scores of 12 age-gender groups on each street view image were counted. Some street view images lacked the scores of individual age and gender groups. For example, the men and women samples aged 20-29 years covered 101 sampling points’ street images, while the men samples aged 10-19 years only covered 70 street images. Therefore, we finally obtained 881 valid samples.
Table 2 Statistics of questionnaire survey results
Age Number of questionnaire samples Number of street view samples
for effective evaluation
Men Women Total Men Women Total
10-19 7 9 16 70 75 145
20-29 100 177 277 101 101 202
30-39 51 32 83 101 98 199
40-49 22 27 49 91 87 178
50-59 6 3 9 42 26 68
60 and above 6 6 12 45 44 89
Average 30 27 29
Total samples 192 254 446 1212
Valid samples 192 254 446 881

2.2 Method

The street view images in the actual running routes in Beijing were obtained through Baidu Street View API (https://lbsyun.baidu.com/). First, the street view image was segmented semantically to identify the proportions of different visual elements. The street view images were then divided into three categories according to the visual proportion of buildings and plants: urban landscape, transitional landscape, and natural landscape. Then, a questionnaire was designed to invite volunteers from the Internet to evaluate the pleasure of street view images, and information such as the gender and age of volunteers was collected. Correlation analysis was conducted to determine the factors that significantly affected people’s enjoyment rating of street view images. The mixed linear model was established to predict the landscape pleasure of the running environment (Figure 2).
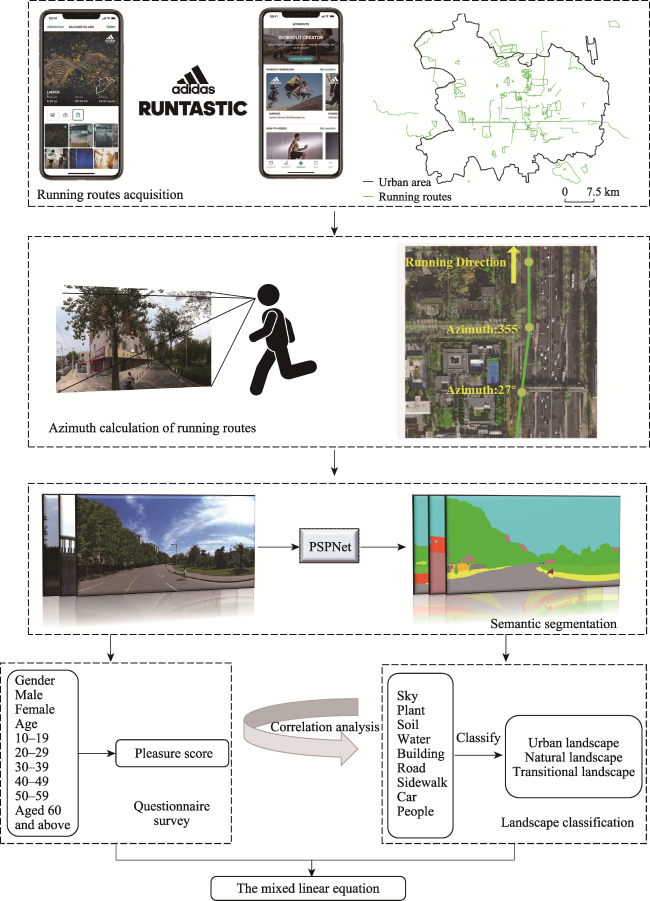
Figure 2 Graphical summary

2.2.1 Semantic image segmentation

People perceive the surrounding environment by receiving light reflected from the visible spectrum of objects. Computers need to understand the geographical environment elements of the street view through semantic segmentation, such as cars, people, and roads. Based on the PyTorch deep learning framework and CUDA computing platform, we used the PSPNet scene analysis network model (Zhao et al., 2017) to perform semantic segmentation on the acquired Baidu street view image (Figure 3.1). The PSPNet model with the ADE20K training image dataset input the image, extracted the feature information of the image through the pre-trained ResNet, collected the context information of the image through the four-layer pyramid pooling module, and fused it into the prior global information. Finally, the mapping feature information obtained by the pyramid was fused with the original feature information and convolved to obtain the 150 visual elements and their proportions (Zhao et al., 2017). This study randomly allocated 80% of the data to the training set, 10% of the data to the validation set, and 10% to the test set. The validation set was used to screen the optimal model, and the test set was used to test the optimal performance of the model. The mean intersect over union (IoU) of the PSP model on the ADE20K dataset reached 44.47%, which is much higher than that of the previous separate ResNet model (41.68%). Finally, we used the trained model to test street view images and calculate the proportions of 17 major visual elements. As shown in Figure 3.2, the 17 visual elements were combined and reclassified to obtain nine categories: sky, vegetation, water, bare soil, buildings, roads and appendages, sidewalks, cars, and people. Buildings, roads, and their accessories were classified as urban elements, and the landscape types were divided according to the proportion of plant elements and urban elements in each street view image (Figure 3.3):
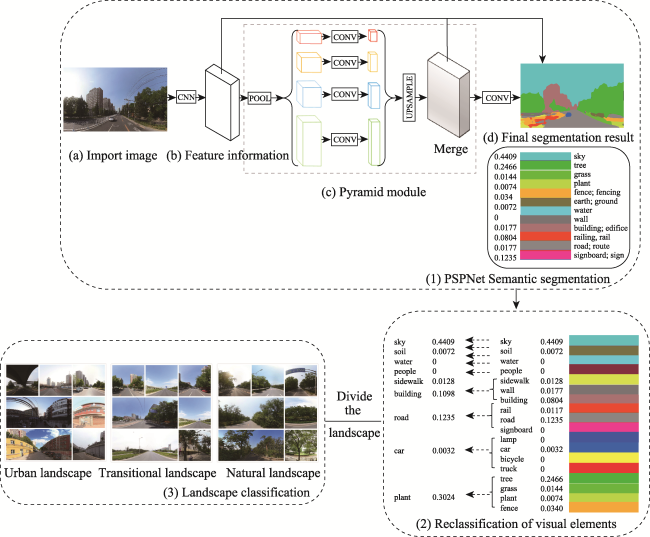
Figure 3 Classification method of scene visual elements
(1) Urban landscape: The proportion of vegetation elements was less than 30%, and the proportion of urban elements was greater than 30%;
(2) Natural landscape: The proportion of vegetation elements was greater than 30%, and the proportion of urban elements was less than 30%;
(3) Transitional landscape: Other landscapes between urban and natural landscapes.
According to this classification method, among the 101 sampling points’ street view images finally used in the questionnaire, 26 were urban landscapes, 32 were natural landscapes, and the other 43 were transitional landscapes.

2.2.2 Mixed linear model

Significant differences existed in the pleasure evaluation of different types of landscapes by specific groups of people. There was also a significant correlation between the pleasure scores of street view images and their visual elements. Therefore, taking the pleasure scores as the dependent variable and the visual elements significantly related to the pleasure scores as the fixed effect, the combination of the volunteers’ age and gender (six age groups with every two genders, 12 groups in total) was used as a random effect. The mixed linear model regressed the pleasure scores of different landscapes:
$\text { Type }_{\text {score }}^{\text {**k }}=a \times p_{\text {plant }}^{\text {p*k }}+b \times p_{\text {building }}^{\text {**k }}+c \times p_{\text {road }}^{\text {**k }}+d+G_{\text {age }}: G_{\text {gender }}$
where Type indicates the type of landscape, including urban landscape, transitional landscape, and natural landscape. a, b, and c represent the coefficient of the visual element, and d represents the model’s intercept. Gage and Ggender represent the age group and gender, Gage:Ggender represents a combination of the two.

3 Results

3.1 Analysis of pleasure score results

The street view images in the questionnaire were randomly selected on the actual running routes. The spatial distribution of the average pleasure scores of the 101 sampling points’ street view images is shown in Figure 4. Among them, the street view with the lowest average score of pleasure was located in the west of Chaoyang District, with a score of 2.24; the street view with the highest pleasure score was located in the southeast of Haidian District, with a score of 4.32. The street view sampling points of the questionnaire were mainly concentrated in districts of Dongcheng, Xicheng, Chaoyang, and Haidian, which were evenly distributed in space. The pleasure scores of street view images in Dongcheng, Xicheng, and Chaoyang were relatively high, and the sampling points in the northwest corner of Haidian were relatively low.
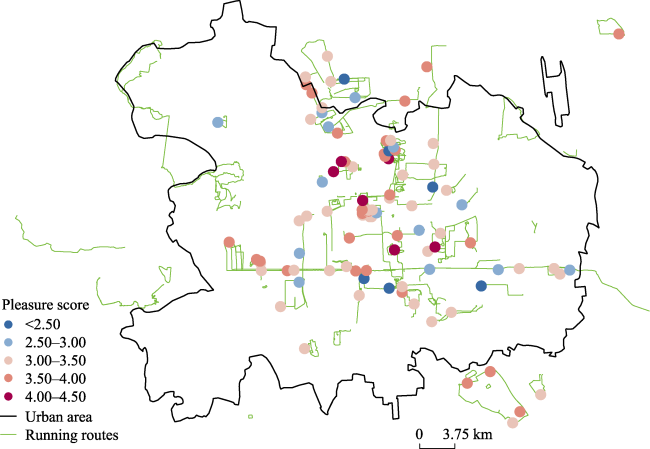
Figure 4 Spatial distribution of pleasure score results

3.1.1 Pleasure scores of specific people on different landscapes

The final 881 valid samples were classified, and the overall score results of pleasure were obtained by gender, age, and landscape type.
As shown in Figure 5a, the overall pleasure score of women was slightly higher than that of men. The Mann-Whitney U test was conducted on the pleasure score of the two gender groups (Table 3), and it was found that there was no significant difference in the pleasure score of the two gender groups (p > 0.1).
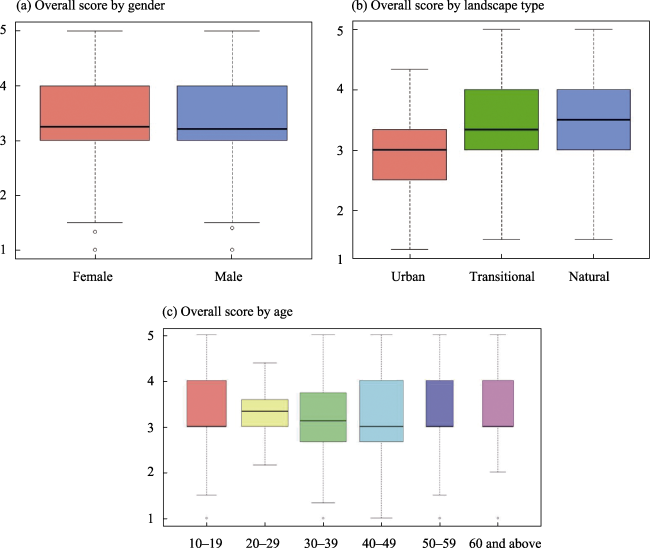
Figure 5 Overall results of pleasure score
Table 3 Difference test of pleasure score between men and women
Gender Samples Average of rank Sum of rank p-value
Men 450 449.30 186336 0.319
Women 431 432.33 202185
The overall pleasure score of the natural landscape was the highest, followed by the overall pleasure score of the transitional landscape. The overall pleasure score of the urban landscape was the lowest (Figure 6b). The Mann-Whitney U test was used to test the significance of the mean pleasure score of each landscape type. The results are shown in Table 4. There are significant differences between the pleasure score results of each possible set of two landscapes (p < 0.000), indicating significant differences in the impact of different landscape types on the perception of pleasure.
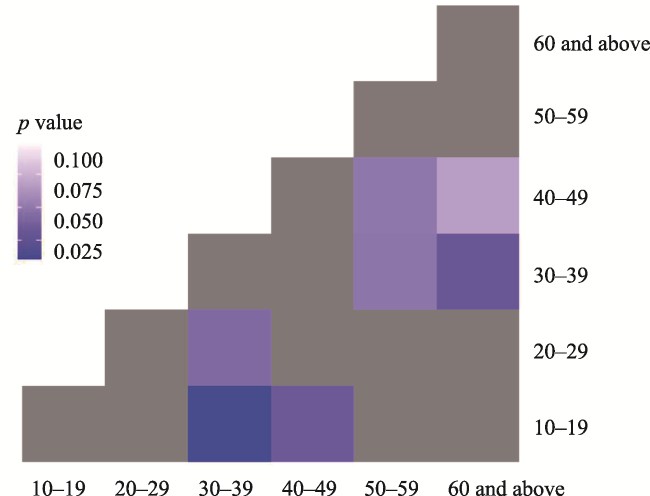
Figure 6 Difference tests of pleasure scores in different age groups
Table 4 Difference test of the pleasure score between the urban landscape, transitional landscape, and natural landscape
Samples Average of rank Sum of rank
Urban 231 248.88 57490.5
Transitional 386 344.98 133162.5
p p < 0.000
Urban 231 187.88 43401
Natural 264 300.6 79359
p p < 0.000
Transitional 386 304.11 117387.5
Natural 264 356.77 94187.5
p p < 0.000
With the increase of age, the pleasure score decreased first and then increased. The Mann-Whitney U test was used to test whether there was a significant difference between the mean values of pleasure scores of six different groups of age (Figure 6). In Figure 6, the gray portion indicates no significant difference between the two (p > 0.1), while the greater the intensity of blue, the smaller the p-value, and the higher the confidence of a significant difference between the two. In addition, there was a significant difference between the young people aged 10-29 years and middle-aged people aged 30-39 (p < 0.05). This indicates that the two groups have significantly different perceptions of pleasure. Moreover, middle-aged people aged 30-49 years had different perceptions from older adults aged over 50 years (p < 0.05).
The age and gender attributes of volunteers were cross-analyzed with the landscape types. Table 5 summarizes the pleasure score of people of different genders for street images of different landscape types. For urban and natural landscapes, men’s pleasure scores were slightly higher than women’s scores (2.92 > 2.82, 3.62 > 3.56), while the two genders had the same pleasure score on the transitional landscape. Both transitional and natural landscapes had higher pleasure scores than the urban landscapes, indicating that urban landscapes induce more negative emotions in people than natural or transitional ones. The pleasure score of the natural landscape (3.58) was also significantly higher than that of the transitional landscape (3.34), which indicates that the natural landscape induces the most pleasure in people.
Table 5 Pleasure scores of different gender groups on different landscapes
Urban landscape Transitional landscape Natural landscape
Men 2.92 3.41 3.62
Women 2.82 3.43 3.56
Total average 2.90 3.34 3.58
Total standard deviation 0.77 0.76 0.77
The differences in the pleasure scores among people of different ages were relatively complex. In Figure 7, the pleasure scores in the longitudinal direction are high on both ends and low in the middle. This is because compared with young individuals and the elderly, middle-aged people aged 30-59 years tended to give lower pleasure scores. In the horizontal direction, the pleasure scores show an increasing trend from left to right. As the proportion of plant elements in the street view image increased and the proportion of urban elements decreased, the pleasure scores gradually increased.
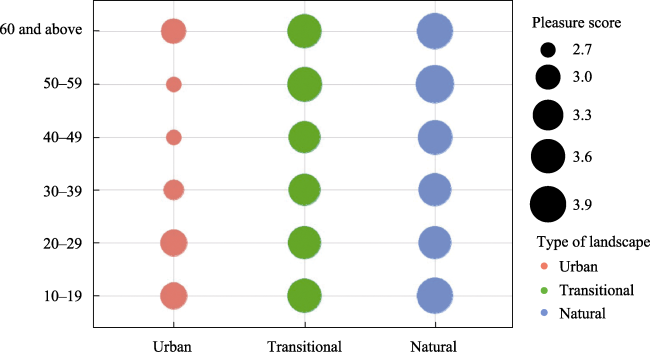
Figure 7 Different age groups’ pleasure scores for different landscape types

3.1.2 Correlation of visual elements with pleasure scores

Each street view image was finally reclassified into nine visual elements: sky, plants, water, soil, buildings, roads, sidewalks, vehicles, and people. As the two visual elements, namely vehicles and people, in the street view image were entirely affected by the sampling time, they were not considered here; many street view images did not contain water elements. Therefore, they were not considered either. Spearman’s Rho was used to explore the correlation between six visual elements in different landscape types and pleasure scores, as shown in Figure 8.
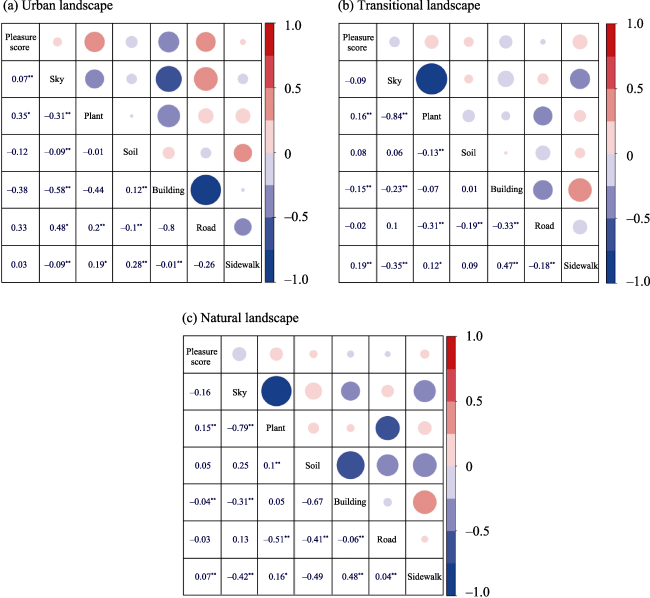
Figure 8 Correlation between visual elements and pleasure scores (**p < 0.01, *p < 0.05)
The correlation between pleasure scores and visual elements was different in different landscapes. In the urban landscapes, plants, buildings, and roads were significantly correlated with the pleasure scores (p < 0.01). Plants and roads showed a positive correlation with pleasure scores, and the positive correlation coefficient between plants and pleasure scores was the largest (0.36). However, there was a negative correlation between buildings and pleasure scores; the negative correlation coefficient was −0.37. In transitional landscapes, the pleasure scores were significantly correlated with plants, buildings, and sidewalks (p < 0.01). The positive correlation coefficient between sidewalks and pleasure scores was the largest (0.19), while the positive correlation coefficient between plants and pleasure scores was 0.16. The negative correlation coefficient between buildings and pleasure scores was −0.15. In natural landscapes, the pleasure scores were significantly correlated with plants and buildings (p < 0.01). The positive correlation coefficient between plants and pleasure scores was lower than that between urban and transitional landscapes, only 0.16. Moreover, the negative correlation coefficient between buildings and pleasure scores was lower than that between urban and transitional landscapes. In addition, there was a significant negative correlation between the sky and plants (p < 0.01), which may have been caused by mutual shielding between the two, that is, the sky blocks the view of plants, and vice versa, reducing the amount of pleasure that can be obtained from either source. There was also a similar relationship between the sky and buildings.

3.2 Mixed linear model of pleasure score

The mixed linear model regressed the pleasure scores of the urban, transitional, and natural landscapes. Table 6 shows the regression coefficients in the mixed linear models.
Table 6 Coefficients in the mixed linear models
Plant Building Road Sidewalk Sky
Urban 2.10*** −0.27*** 2.82**
Transitional 1.39*** −5.45*** 7.11***
Natural 0.20** −0.90*
The values of Gage:Ggender are shown in Table 7.
Table 7 Intercept of specific population
Landscape Gender Age 10-19 20-29 30-39 40-49 50-59 60 and above
Urban Men 0.018 0.099 0.010 −0.079 −0.001 0.139
Women 0.089 0.045 −0.066 −0.079 −0.038 −0.135
Transitional 0.075 −0.006 −0.133 −0.080 0.045 0.098
Natural 0.011 −0.028 −0.017 −0.009 0.025 0.018
Surban, Stransitional, and Snatural are the pleasure scores of the urban, transitional, and natural landscapes, respectively. pplant, pbuilding, proad, and psidewalk are the proportions of plants, buildings, roads, and sidewalks in the street view image, respectively. Gage:Ggender is the ratio of people of a specific age to people of a specific gender.
The symbol *** indicates that the significance level is 0, ** indicates that the significance level is 0.01, and * indicates that the significance level is 0.05.
Table 8 shows the goodness of fit in the mixed linear models. R2m, R2c, and R2 are the fixed effect, random effect, and the overall adjusted model.
Table 8 Goodness of fit of the pleasure regression model
R2m R2c R2
Urban 0.17 0.20 0.20
Transitional 0.13 0.15 0.20
Natural 0.03 0.03 0.03
In establishing the mixed linear model, it was found that only the age groups contributed to the interpretation of the pleasure scores (Table 7), which is consistent with the previous finding that there was no significant difference in the pleasure scores of different genders. As shown in Table 8, in the mixed linear models of the urban landscape and transitional landscape, the interpretation degree R2c to the model was 0.20 and 0.15, respectively, which are more significant values than the interpretation degree R2m (0.17 and 0.13). In the mixed linear model of the natural landscape, the interpretation degree of demographic and visual elements was the same, 0.03. Overall, the fitting effect of the regression model of pleasure in the urban and transitional landscapes was better than natural landscape, and R2 was 0.20, while the R2 of the natural landscape was only 0.03.

4 Discussion

4.1 Group differences in perceiving the environment

Demographic factors usually affect people’s self-evaluation of emotion to a certain extent. Since the late 1990s, many studies on the relationship between demographic factors and emotion have been conducted (DeNeve et al., 1998; Hayes et al., 2003). The differences between the two most basic demographic characteristics of gender (Gulian et al., 1986; Xiao et al., 2019) and age (Zhang et al., 2007) may determine how we perceive the environment. In particular, young people and the elderly have always been distinguished and studied separately (Freeman et al., 2015; Von Humboldt and Leal, 2017a; 2017b; Zajenkowski, 2021). In addition, people of different ages and genders have different opportunities to use public spaces, which results in different pleasure benefits (Lachowycz et al., 2013; Chen et al., 2021). Therefore, it is necessary to systematically analyze the relationship between demographic variables (such as gender and age group) and subjective emotions.
In this study, the men’s pleasure scores were slightly higher than those of women in perceiving the urban and natural landscapes, while the two genders’ pleasure scores for transitional landscapes were the same. Compared with young people and the elderly, middle-aged people tended to give lower pleasure scores. This situation was pronounced in urban landscapes: young people aged 10-29 years and older adults aged 60 years and over had higher pleasure scores, indicating that their perception of the urban landscape was less sensitive than that of middle-aged people aged 30-59 years. In addition, children aged 10-19 years and middle-aged and older adults aged over 50 years had a better perception of natural landscape pleasure and tended to give higher pleasure scores, while people aged 20-39 years had a poor perception of natural landscape pleasure. Middle-aged people usually withstand more pressure, both socially and in day-to-day survival. High-risk people with mental health problems, who usually have more negative psychology (Chung et al., 2016; Zhang et al., 2021), tend to have lower pleasure scores than low-risk people.

4.2 Influence of visual elements on pleasure scores

In the correlation analysis of visual elements and pleasure scores, there were differences among different landscape types. Although the pleasure scores were significantly positively correlated with plants, the correlation coefficients in the urban landscape were more significant than those in the transitional landscape and more extensive than those in the natural landscape (0.36 > 0.16 > 0.15). In addition, the negative correlation coefficient between the pleasure scores and buildings also increased gradually (−0.37 < −0.15 > −0.03). The proportion of green plants in the urban landscape was the lowest. Still, the correlation coefficient between green plants and pleasure scores was the largest, indicating that the fewer the green plants, the greater the positive effect of green plants on pleasure scores. Similarly, the more buildings there are, the more likely the buildings are to have a negative effect on pleasure scores.
In the mixed linear models of the three landscape types, plant elements significantly positively affected the pleasure scores. The higher the proportion of plants in the street view images, the higher the pleasure scores, which indicates that green spaces have a role in guiding peoples’ positive emotions. Visual contact with natural green elements such as trees, grass, and flowers have a therapeutic effect on people’s mental health (MacKerron et al., 2013; Kang et al., 2019). However, the regression coefficient of plants in the urban landscape was the largest (2.10), followed by that in the transitional landscape (1.39), and that in the natural landscape was the smallest (0.20). This is consistent with the results of the correlation analysis. The pleasure scores did not simply increase with the proportion of plants. Previous studies revealed correlations with the same trends but did not consider differences in landscape types (Jiang et al., 2014). Building elements negatively impacted people’s sense of pleasure in the mixed linear regression of the urban and transitional landscapes. The pleasure score decreased with the increase of building proportion, especially in the transitional landscape. Buildings cover many natural elements visually, and the more significant the proportion of buildings, the more unpleasant emotions that are caused. The proportion of roads significantly affected the pleasure score in the urban landscape, and the regression coefficient was 2.82. This indicates that compared with the disordered electric poles, walls, and other elements in the urban landscape, orderly and tidy roads can play a role in inducing pleasure. In the transitional landscape, the proportion of sidewalks also significantly positively affected the pleasure score, and the regression coefficient was 7.11. The sidewalk is the part of the road separated by curbs or guardrails and other similar pedestrian facilities. It can provide a safe running environment and is also related to the aesthetic design of the street (Humpel et al., 2002; Heath et al., 2006; Huang et al., 2020).
The mixed linear models obtained in this study can predict the running pleasure of different people in different areas of urban space and can guide people in selecting suitable running routes, according to the results. Therefore, when running outdoors, people can choose streets with more green plants and sidewalks and avoid running routes with more buildings as much as possible. Suitable running routes can relieve pressure and elicit more pleasure through the influence of the natural environment. In addition, in the renewal and transformation of the urban environment, we should pay more attention to the distribution of urban space. Buildings, roads, other facilities, and natural plants in the streets should be rationally arranged, such as by increasing the planting of shrubs and flowers and dismantling illegal buildings and walls, to create a reasonable and comfortable urban space rather than arbitrarily expanding it.

4.3 Research limitations

This study had the following limitations. First, the street view images collected through the online map platform were not scenes of the runners at the present time; so, the results may have been affected by natural conditions, such as weather and related events, that would not apply in the present. Second, the volunteers of the pleasure questionnaire were not runners but online volunteers. There may be deviations in their subjective feelings. Third, in addition to gender and age, factors such as education, income, and living environment may also affect people’s running pleasure. Moreover, as the questionnaire was distributed on the Internet, the obtained samples were focused on the age group of 20-49 years, which may have caused a particular sample bias. Furthermore, while many previous studies have analyzed random walking environments, we did not compare running environments with them here. Finally, although we found a strong correlation between visual elements and running pleasure and demonstrated a fixed effect on pleasure perception in different age and gender groups, the fitting degree, R2, of the linear model was generally low. In follow-up work, we will increase the sample size and determine whether there are other more suitable models.

5 Conclusion

This study explored the relationship between subjective pleasure and the objective visual features of the built environment through mixed linear regression analysis. The pleasure score of people of different ages and genders in unknown places can be predicted by the proportion of scene elements.
The study results indicate that the average pleasure score of women is slightly higher than that of men, but there is no statistically significant difference between the two. The pleasure score of the natural landscape is greater than that of the transitional landscape and urban landscape, and there are also significant differences between the latter two. With the increase of age, the pleasure score first decreases and then increases. Middle-aged people usually feel less pleasure than young and older adults. Different visual elements have different effects on pleasure scores. Natural elements such as green plants positively affect pleasure scores, while urban elements such as buildings have adverse effects. In the urban landscape, the influence of natural elements is the largest, whereas this influence is the smallest in the natural landscape. Finally, the demographic characteristics (gender and age) have a high model interpretation when predicting the pleasure score.
[1]
Chung J K, Plitman E, Nakajima S et al., 2016. Depressive symptoms and small hippocampal volume accelerate the progression to dementia from mild cognitive impairment. Journal of Alzheimer’s Disease, 49(3): 743-754.

[2]
Daniel W, 1990. Spearman Rank Correlation Coefficient. Applied Nonparametric Statistics. 2nd ed. Boston: PWS-Kent.

[3]
DeNeve K M, Cooper H, 1998. The happy personality: A meta-analysis of 137 personality traits and subjective well-being. Psychological Bulletin, 124(2): 197.

DOI PMID

[4]
Gebru T, Krause J, Wang Y et al., 2017. Using deep learning and Google Street View to estimate the demographic makeup of neighborhoods across the United States. Proceedings of the National Academy of Sciences, 114(50): 13108-13113.

DOI

[5]
Gong P, Liang S, Carlton E J et al., 2012. Urbanisation and health in China. The Lancet, 379(9818): 843-852.

DOI

[6]
Gulian E, J Thomas, 1986. The effects of noise, cognitive set and gender on mental arithmetic performance. British Journal of Psychology, 77(4): 503-511.

DOI

[7]
Gupta S, Goren A, Dong P et al., 2016. Prevalence, awareness, and burden of major depressive disorder in urban China. Expert Review of Pharmacoeconomics & Outcomes Research, 16(3): 393-407.

[8]
Hayes N, Joseph S, 2003. Big 5 correlates of three measures of subjective well-being. Personality and Individual Differences, 34(4): 723-727.

DOI

[9]
Heath G W, Brownson R C, Kruger J et al., 2006. The effectiveness of urban design and land use and transport policies and practices to increase physical activity: A systematic review. Journal of Physical Activity and Health, 3(Suppl.1): S55-S76.

DOI

[10]
Helbich M, Poppe R, Oberski D et al., 2021. Can’t see the wood for the trees? An assessment of street view- and satellite-derived greenness measures in relation to mental health. Landscape and Urban Planning, 214: 104181.

DOI

[11]
Huang X, Cao X, Yin J et al., 2020. The influence of urban transit and built environment on walking. Acta Geographica Sinica, 75(6): 1256-1271. (in Chinese)

DOI

[12]
Humpel N, Owen N, Leslie E, 2002. Environmental factors associated with adults’ participation in physical activity: A review. American Journal of Preventive Medicine, 22(3): 188-199.

PMID

[13]
Jiang B, Chang C-Y, Sullivan W C, 2014. A dose of nature: Tree cover, stress reduction, and gender differences. Landscape and Urban Planning, 132: 26-36.

DOI

[14]
Kang Y, Jia Q, Gao S et al., 2019. Extracting human emotions at different places based on facial expressions and spatial clustering analysis. Transactions in GIS, 23(3): 450-480.

DOI

[15]
Lachowycz K, Jones A P, 2013. Towards a better understanding of the relationship between greenspace and health: Development of a theoretical framework. Landscape and Urban Planning, 118: 62-69.

DOI

[16]
Li D, Guo W, Chang X et al., 2020. From earth observation to human observation: Geocomputation for social science. Journal of Geographical Sciences, 30(2): 233-250.

DOI

[17]
Liu Y, 2016. Revisiting several basic geographical concepts: A social sensing perspective. Acta Geographica Sinica, 71(4): 12. (in Chinese)

[18]
Lowe D G, 1999. Object recognition from local scale-invariant features. Proceedings of the Seventh IEEE International Conference on Computer Vision, IEEE, 2: 1150-1157.

[19]
Luo Y, Wu T, Ruolei G, 2012. Studies on neural correlates of emotion and cognition. Bulletin of the Chinese Academy of Sciences, (Suppl.1): 11.

[20]
MacKerron G, Mourato S, 2013. Happiness is greater in natural environments. Global Environmental Change, 23(5): 992-1000.

DOI

[21]
Mann H B, Whitney D R, 1947. On a test of whether one of two random variables is stochastically larger than the other. The Annals of Mathematical Statistics, 50-60.

[22]
Middel A, Lukasczyk J, Zakrzewski S et al., 2019. Urban form and composition of street canyons: A human-centric big data and deep learning approach. Landscape and Urban Planning, 183: 122-132.

DOI

[23]
Moser G, Uzzell D, 2003. Environmental psychology. Comprehensive Handbook of Psychology Assessment, 5: 419-445.

[24]
Seiferling I, Naik N, Ratti C et al., 2017. Green streets: Quantifying and mapping urban trees with street-level imagery and computer vision. Landscape and Urban Planning, 165: 93-101.

DOI

[25]
Spearman C, 1961. The proof and measurement of association between two things. International Journal of Epidemiology, 39(5): 1137-1150.

DOI

[26]
Tang J, Long Y, Zhuo W et al., 2016. Measuring quality of street space, its temporal variation and impact factors: An analysis based on massive street view images. Landscape and Urban Planning, 191(5): 6.

[27]
United Nations, 2018. Revision of World Urbanization Prospects. New York: United Nations.

[28]
Von Humboldt S, Leal I, 2017a. Older adults’ adjustment to aging: The impact of sense of coherence, subjective well-being and socio-demographic, lifestyle and health-related factors. European Psychiatry, 41(Suppl.1): S666-S667.

[29]
Von Humboldt S, Leal I, 2017b. Validation of a measure of positive and negative affect for use with cross-national older adults. European Psychiatry, 41(Suppl.1): S666.

[30]
Ward A L, Freeman C, McGee R, 2015. The influence of transport on well-being among teenagers: A photovoice project in New Zealand. Journal of Transport & Health, 2(3): 414-422.

[31]
Xia Y, Yabuki N, Fukuda T, 2021. Sky view factor estimation from street view images based on semantic segmentation. Urban Climate, 40: 100999.

DOI

[32]
Xiao J, Hilton A, 2019. An investigation of soundscape factors influencing perceptions of square dancing in urban streets: A case study in a county level city in China. International Journal of Environmental Research and Public Health, 16(5): 840.

DOI

[33]
Yang J, Siri J G, Remais J V et al., 2018. The Tsinghua-Lancet Commission on Healthy Cities in China: Unlocking the power of cities for a healthy China. The Lancet, 391(10135): 2140-2184.

DOI

[34]
Yin L, Wang Z, 2016. Measuring visual enclosure for street walkability: Using machine learning algorithms and Google Street View imagery. Applied Geography, 76: 147-153.

DOI

[35]
Yuan Y, Chen Y, Liu Y et al., 2021. The neighborhood effect of residential greenery on residents’ self-rated health: A case study of Guangzhou, China. Acta Geographica Sinica, 76(8): 1965-1975. (in Chinese)

DOI

[36]
Zajenkowski M, 2021. How do teenagers perceive their intelligence? Narcissism, intellect, well-being and gender as correlates of self-assessed intelligence among adolescents. Personality and Individual Differences, 169: 109978.

DOI

[37]
Zhang C, Chen X, Wang S et al., 2021. Using CatBoost algorithm to identify middle-aged and elderly depression, national health and nutrition examination survey 2011-2018. Psychiatry Research, 306: 114261.

DOI

[38]
Zhang F, Zhou B, Liu L et al., 2018. Measuring human perceptions of a large-scale urban region using machine learning. Landscape and Urban Planning, 180: 148-160.

DOI

[39]
Zhang L, Pei T, Chen Y et al., 2019. A review of urban environmental assessment based on street view images. Journal of Geo-information Science, 21(1): 46-58.

[40]
Zhang M, Kang J, 2007. Towards the evaluation, description, and creation of soundscapes in urban open spaces. Environment and Planning B: Planning and Design, 34(1): 68-86.

DOI

[41]
Zhao H, Shi J, Qi X et al., 2017. Pyramid scene parsing network. Proceedings of the IEEE Conference on Computer Vision and Pattern Recognition, 2881-2890.

Outlines

/