Research Articles

Planning hierarchical hospital service areas for maternal care using a network optimization approach: A case study in Hubei, China

  • TAO Zhuolin , 1 ,
  • CHENG Yang , 1, * ,
  • BAI Lingyao 1 ,
  • FENG Ling 2 ,
  • WANG Shaoshuai 2
Expand
  • 1. Faculty of Geographical Science, Beijing Normal University, Beijing 100875, China
  • 2. Department of Obstetrics and Gynecology, Tongji Hospital, Tongji Medical College, Huazhong University of Science and Technology, Wuhan 430074, China
* Cheng Yang (1982‒), PhD and Associate Professor, specialized in health geography. E-mail:

Tao Zhuolin (1990‒), PhD, specialized in spatial accessibility and optimization of public services, urban and regional development. E-mail: .

Received date: 2021-11-29

  Accepted date: 2022-06-09

  Online published: 2022-12-25

Supported by

National Natural Science Foundation of China(41671497)

Abstract

Improving maternal health is one of the Sustainable Development Goals. Hospital service areas (HSAs), which contain most hospitalization behaviors at the local scale, are crucial for health care planning. However, little attention has been given to HSAs for maternal care and the hierarchy structure. Considering Hubei, central China, as a case study, this study aims to fill these gaps by developing a method for delineating hierarchical HSAs for maternal care using a network optimization approach. The approach is driven by actual patient flow data and has an explicit objective to maximize the modularity. It also establishes the hierarchical structure of maternal care HSAs, which is fundamental for the planning of hierarchical maternal care and referral systems. In our case study, 45 secondary HSAs and 22 tertiary HSAs are delineated to achieve maximal modularity. The HSAs perform well in terms of indices such as the Localization Index and Market Share Index. Furthermore, there is a complementary relationship between secondary and tertiary hospitals, which suggests the need for referral system planning. This study can provide evidence for the validity of the HSA and the planning of maternal care HSAs in China. It also provides transferable methods for planning hierarchical HSAs in other developing countries.

Cite this article

TAO Zhuolin , CHENG Yang , BAI Lingyao , FENG Ling , WANG Shaoshuai . Planning hierarchical hospital service areas for maternal care using a network optimization approach: A case study in Hubei, China[J]. Journal of Geographical Sciences, 2022 , 32(12) : 2577 -2598 . DOI: 10.1007/s11442-022-2062-x

1 Introduction

Improving maternal health is one of the eight Millennium Development Goals (MDGs), including reducing the maternal mortality ratio by three-quarters between 1990 and 2015 and achieving universal access to reproductive health by 2015. By the target date of 2015, however, maternal mortality only declined globally by 45 percent since 1990, and only half of pregnant women in developing regions received the recommended minimum of four antenatal care visits. It fell far short of the targets, although significant progress has been made (UN, 2015). Significant differences exist in the health status of women and children between urban and rural areas and among various regions or subgroups (Lewis and Longley, 2012; Kpienbaareh et al., 2019). The Sustainable Development Goals (SDGs) adopted by the UN in 2015 reaffirmed the reduction of maternal and newborn mortality as global priorities in the coming decades (UN, 2020). The presence of a skilled birth attendant during delivery and emergency obstetric care are important actions to prevent most maternal deaths in developing countries (UN, 2013). In China, maternal health and its regional equality have been substantially improved in recent decades (Liang et al., 2019). However, maternal health is still facing with challenges such as high-risk parturient, especially with the increasing number of advanced-age parturient after the implementation of the “two-child” policy since 2016 (Hu et al., 2017).
Appropriate units or areas are fundamental for the analysis, planning and management of health care resources. Generally, functional areas based on the patterns of actual health care behavior are widely considered more accurate and reliable than traditional geographic units such as administrative areas and census units (Sofianopoulou et al., 2012; Kilaru et al., 2015; Zhao et al., 2018; Wang et al., 2020). The hospital service area (HSA) is a typical functional area that contains most hospitalization behaviors (Wennberg and Cooper, 1998; Klauss et al., 2005; Jia et al., 2015). In other words, most patients seek health care services within the boundaries of HSAs. The World Health Organization (WHO, 1991) calls for local-scale provision of health care resources, which has been put into practice in many countries (Shortt and Moore, 2006; Lewis and Longley, 2012). HSAs represent responses to the global goal to promote local utilization of health care resources and to reduce the cost of seeking health care (Goodman et al., 1997; Basu and Friedman, 2007). A recent study fully demonstrates that HSAs are proper units for analyzing the spatial behavior of health care service utilization and capturing its spatial variation (Wang et al., 2021b). In the field of health-related studies, HSAs play fundamental roles in small area analyses regrading geographical variation in the delivery, utilization and performance of health care services (Wennberg and Gittelsohn, 1973; Ashton et al., 1999; Zhang et al., 2012; Rosenberg et al., 2016). HSAs provide valuable evidence for the planning and governance of health care services (Klauss et al., 2005). Therefore, it is of great academic and practical importance to rationally and scientifically delineate HSAs.
Several methods have been developed for delineating HSAs. The first group includes proximity-based and gravity-based methods, which merely consider geographic factors in HSA planning (Xiong and Luo, 2017). However, these methods fail to reflect the fundamental local-hospitalization characteristic of HSAs because actual utilization behaviors are not considered. The second type of method, also the most widely used, is a patient flow-based method, which delineates HSAs based on the actual utilization behavior or patient flows to hospitals. A typical flow-based method is the famous Dartmouth method (Wennberg and Cooper, 1998). The Dartmouth method was improved and applied in Switzerland (Klauss et al., 2005). However, the operation of these methods relies on mutual procedures and arbitrary settings and calls for a more sound theoretical foundation (Jia et al., 2015; Hu et al., 2018). Thirdly, some studies have made efforts in combining the gravity-based Huff model and actual patient flows (Jia et al., 2015, 2017a, 2017b). This method first calibrates the Huff model using actual patient flows and then uses the calibrated model to predict the probability that patients select each hospital.
Recently, Hu et al. (2018) proposed a network optimization approach to delineating HSAs that treats patient flows between demand units and hospitals as networks and pursues an optimal division of the network by applying community detection algorithm. The algorithm aim to maximize the flows within each community (i.e., HSA) and minimize the flows between communities by optimizing the so-called modularity index (Newman and Girvan, 2004). Wang et al. (2021a) advanced the method by incorporating geographic contiguity and minimum size constraints. It has also been applied in the delineation of cancer service areas (Wang et al., 2020).
Existing studies on HSAs, however, still have some limitations. First, few studies have paid attention to the hierarchical structure of HSAs. It is well known that health care and referral system is hierarchical, which is fundamental for the planning of HSAs. Jia et al. (2017b) made attempts to delineate two-level HSAs by applying a Huff mode calibrated by actual patient flows. However, the hierarchical structure of HSAs was not fully investigated in their study and the network optimization method has not been applied to analyze hierarchical HSAs. Second, little attention has been given to HSAs for maternal care. As pointed out by Jia et al. (2017b), hospitalization behaviors and HSAs may differ across different types of health care services. It remains underresearched whether the concept of HSA and the methods for delineating HSAs would apply to maternal care. Third, existing implementations of and studies on HSAs are limited to the contexts of Western developed countries, with little attention given to the feasibility of HSAs in the contexts of developing countries, where the health care service system is less developed.
Given the above limitations, this study aims to demarcate hierarchical HSAs for maternal care by applying a network optimization algorithm and actual patient flows. By leveraging a case study in Hubei Province, China, it also intends to investigate the validity and applicability of the concept of HSA in developing countries like China. This study further develops a three-stage procedure to establish the hierarchical structure of HSAs based on the spatial relationship between HSAs at different levels.

2 Methods and data

2.1 Network optimization approach to delineating HSAs

Network optimization has been widely applied in the study on spatial structures of socio-economic networks (Chen et al., 2018; Liu et al., 2018). The network optimization approach was first introduced by Hu et al. (2018) to delineate HSAs. This method considers hospitalization behaviors as a network, with the demand units (towns in this study) and hospitals as nodes and patient flows between towns and hospitals as edges. Each HSA is a community generated by the community detection algorithms. It has an explicit objective to maximize the patient flows within communities (i.e., HSAs) and minimize the flows between communities (Newman and Girvan, 2004; Zhao et al., 2011), which is considered a key superiority of the network optimization approach over traditional approaches (Hu et al., 2018; Wang et al., 2021a).
The modularity index proposed by Newman and Girvan (2004) is the most widely used measure of the quality of community structures. It is calculated by comparing the ratio of intracommunity flows in the actual network to the ratio in a random network. The modularity Q for a weighted network can be calculated as (Newman, 2004):
$Q=\frac{1}{2 m} \sum_{i j}\left(A_{i j}-\frac{k_{i} k_{j}}{2 m}\right) \delta\left(c_{i}, c_{j}\right)$
where Aij is the weight of the edge between node i and j; m = ½ΣijAij represents the total weights in the whole network; ki = ΣjAij represents the total weights of the edges connected with node i (i.e., the degree of node i); ci is the community to which node i is assigned; and δ(ci, cj) equals 1 when ci = cj or 0 when cicj. A larger Q indicates a better performance of the division of communities. In actual networks, modularity Q commonly ranges between 0.3 and 0.7 (Newman and Girvan, 2004; Newman, 2006).
The modularity optimization problem formulated in Formula (1) can be solved by a series of algorithms called community detection algorithms (Fortunato, 2010). Among these, the Louvain algorithm developed by Blondel et al. (2008) is one of the most widely used and has advantages in calculation efficiency. Furthermore, the Louvain algorithm is scale-flexible, which means that solutions consisting of any number of HSAs can be generated by the algorithm. This characteristic is useful for researchers and policy-makers to delineate HSAs and evaluate their performance at various scales (Hu et al., 2018). Lambiotte et al. (2015) further proposed an improvement of the Louvain algorithm by incorporating a resolution parameter. Analysts can obtain results with different numbers of HSAs by simply adjusting the resolution parameter.
Given the above strengths, the Louvain algorithm with resolution parameters (Blondel et al., 2008; Lambiotte et al., 2015) is selected to solve the network optimization problem in this study. The algorithm is operated in Gephi 0.9.2 (Bastian et al., 2009), a widely used, efficient and free software for complex network analyses. By setting different values of the resolution parameter, scenarios with different numbers of HSAs were generated, each of which had a modularity Q value. The best scenario can be sorted out based on the maximal modularity Q.

2.2 Methods for establishing the hierarchical structure of HSAs

Health care services, including maternal care services, are usually organized in a hierarchical manner. In other words, the facilities providing health care services are classified into various levels. In China, health care facilities are organized by a typical three-level structure (Lu et al., 2019; Song et al., 2019; Tao et al., 2020a). The primary health care facilities provide basic health care services while secondary and tertiary hospitals are responsible for more complicated health care services. The two-way referral system between different levels of health care facilities is also important for the system (Lu et al., 2019). Considering that HSAs are the basic spatial units where health care services are organized, the hierarchical characteristics of HSAs should be attached with great importance.
The hierarchical structure of HSAs refers to the corresponding relationships between HSAs of various levels, which can be represented by how the boundaries of HSAs of various levels overlap with each other. Most maternal care services are provided and utilized at tertiary and secondary hospitals, which will be presented in the next section. Therefore, only two-level (i.e., tertiary and secondary) maternal care services and HSAs are considered in this study. The hierarchical structure of HSAs can be established following a three-step procedure:
(1) The hospitals and their hospitalization trips are divided into subgroups by the levels of hospitals. In this study, two levels of hospitals are considered, i.e., tertiary and secondary hospitals, according to the official classification of hospitals in China.
(2) The network optimization approach is conducted separately for tertiary and secondary hospitals to delineate tertiary and secondary HSAs.
(3) The spatial relationship between HSAs at each level is analyzed by overlapping their boundaries on the same map. As shown by the example in Figure 1, there may be three basic types of relationships between tertiary and secondary HSAs, i.e., the one-to-one, one-to-many, or many-to-one relationships. In addition, there may exist more complex situations where the one-to-many and many-to-one relationships are combined. As illustrated in Figure 1(e), the hierarchical structure of HSAs can be established using a mapping graph based on the above relationships. In the graph, each line connecting a tertiary HSA and a secondary HSA means that the two HSAs are spatially overlapped.
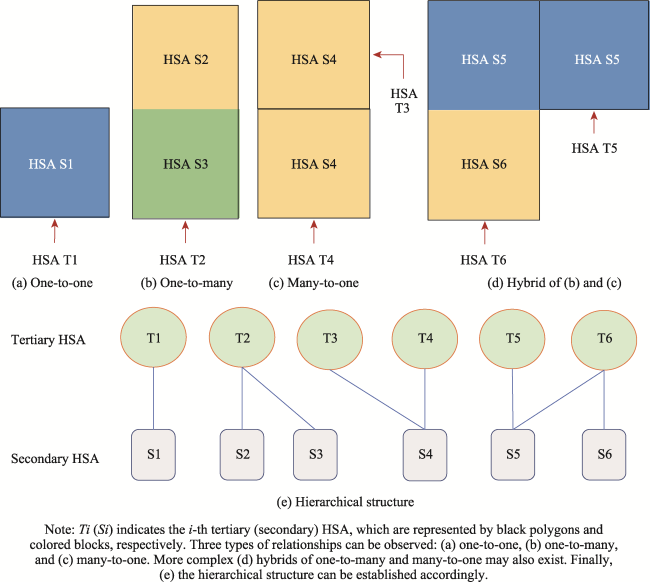
Figure 1 Illustration examples of various hierarchical structures of HSAs
Essentially, the hierarchical structure of HSAs reflects the organization of hierarchical diagnosis and referral system of health care services. The hierarchical structure can provide knowledge-based evidences for referral system planning for maternal care. According to the goal of establishing a hierarchical health care system, tertiary hospitals are designated to provide high-level treatments to difficult and miscellaneous clinical cases. Referrals from low-level hospitals to tertiary hospitals are a key component to maintain the hierarchical system. In such systems, patients are encouraged to select lower-level health care facilities (secondary hospitals for maternal care in this study), and then referred to higher-level facilities (i.e., tertiary hospitals) if needed. Therefore, the hierarchical structure of HSAs can act as a basis of the arrangements of referrals between secondary and tertiary hospitals. As for the one-to-one and one-to-many structures, a tertiary HSA contains one or multiple secondary HSAs, respectively, indicating that all patients served by the secondary HSAs should be referred to the corresponding tertiary HSA. As for the many-to-one and the hybrid structures, however, a secondary HSA is overlapped with multiple tertiary HSAs. This means that the demand nodes (towns in this study) that constitute the secondary HSA are divided into multiple tertiary HSAs. Accordingly, patients served by the secondary HSA should be referred to multiple tertiary HSAs, which tends to make the hierarchical diagnosis and referral system more complex.
Note that individuals’ health care-seeking behaviors might be influenced by many factors. Potential data errors and the small sample problem can also lead to some anomalies in the results. Therefore, the HSAs delineated above can be further optimized to make the hierarchical structure clearer and assure better consistency between HSAs and administrative boundaries. The adjustments are mainly conducted for the many-to-one hierarchical structure due to its difficulty in organization of referrals. Two types of adjustments can be adopted to optimize the hierarchical structure:
(1) The secondary HSA can be divided into multiple parts based on the boundaries of the corresponding tertiary HSAs and administrative boundaries. In most cases of the many-to-one relationship, the corresponding secondary HSA covers multiple prefecture cities, while the tertiary HSAs match well with prefecture boundaries. In these cases, dividing the secondary HSA can make it better matching the boundaries of tertiary HSAs and administrative divisions.
(2) If the tertiary HSAs relating to the same secondary HSA are spatially contiguous and their sizes are relatively small, they can be merged into one tertiary HSA. Then the hierarchical structure will be transformed into the one-to-one or one-to-many structures.
However, the above adjustments are merely exploratory attempts to optimize the hierarchical structure of HSAs. More information, including decision-makers’ experiences, is needed to determine which solution should be adopted in the practice.

2.3 Indices for characterizing HSAs

The delineated HSAs can be characterized and evaluated from various perspectives. Following existing studies (Klauss et al., 2005; Kilaru et al., 2015; Hu et al., 2018), a set of indices was calculated in this study to quantify the multidimensional characteristics of maternal care HSAs in Hubei.
The first two indices are the total served population (TSP) and the total supply of each HSA. The former is represented by the population of women of child-bearing age, while the latter is represented by total obstetrics beds (TOB) provided in each HSA.
The supply-demand ratio (SDR) of maternal care in each HSA can be further calculated by dividing TOB by TSP. The SDR is a measure of accessibility. Therefore, the analysis of SDR can demonstrate the usefulness of HSAs as fundamental units for evaluating health care accessibility. Existing studies commonly measure SDR based on administrative units (Tao et al., 2020b). This would undoubtedly overlook cross-boundary health care utilization behaviors and lead to bias in the measurement of accessibility.
The localization index (LI) and market share index (MSI) are the two most widely used indices for measuring the localization pattern of behaviors (Goodman et al., 2003; Klauss et al., 2005; Kilaru et al., 2015). The former measures the localization pattern from the patient side (i.e., demand nodes), while the latter is from the destination or supply side. LI is measured by the proportion of patients living in an HSA that utilize the health care services provided in the same HSA (Guagliardo et al., 2004). MSI measures the proportion of patients treated in the hospitals in an HSA who also reside in the HSA (Kilaru et al., 2015).
For each HSA, despite the patient flows within each HSA, there may be both inflows of patients into the HSA from outside and outflows of patients beyond the HSA. A net patient inflow (NPI) index is developed in this study by subtracting the outflows from the inflows. A positive NPI indicates that the HSA can attract patients from other HSAs, possibly due to its high service quality. Otherwise, a negative NPI means that patients residing in the HSA tend to be attracted by other HSAs.

2.4 Study area and data

In China, after the implementation of the “two-child” policy in 2016, the demand for fertility has been gradually freed, and maternal and child health are facing new challenges (Li et al., 2019; Tao et al., 2020b). Chinese governments have attached great importance to the equalization of health services and the establishment of a hierarchical diagnosis and treatment system (SC, 2016; HCAPC, 2019). Hubei Province, China, is selected to conduct the case study. Both interregion disparities and urban-rural disparities in socioeconomic status and maternal care provision can be observed in Hubei Province, which makes it an appropriate study area. Hubei Province is located in central China, with a total population of 59.02 million and 0.74 million newborns in 2017 (HPBS, 2018). It is divided into 17 prefecture- level administrative divisions. Wuhan, located in the eastern part of Hubei, is the provincial capital. Town-level population data were collected from the 6th National Population Census of China. Town-level population densities are shown in Figure 2. The ratio of women of child-bearing age to the total population was estimated based on the five-year age group population and gender ratio data at the county level. Based on the county-level ratios and town-level population, the town-level female population of child-bearing age is estimated.
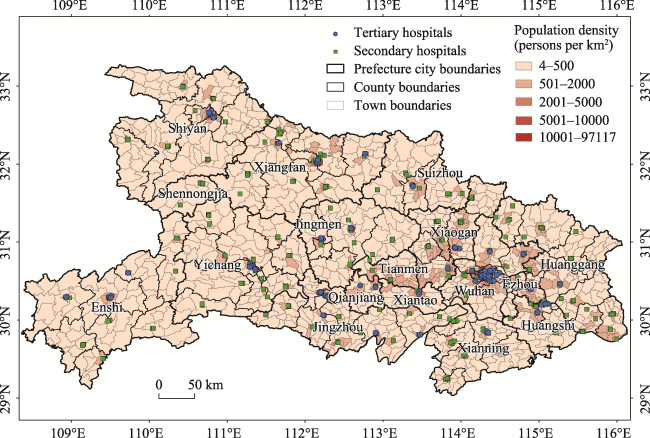
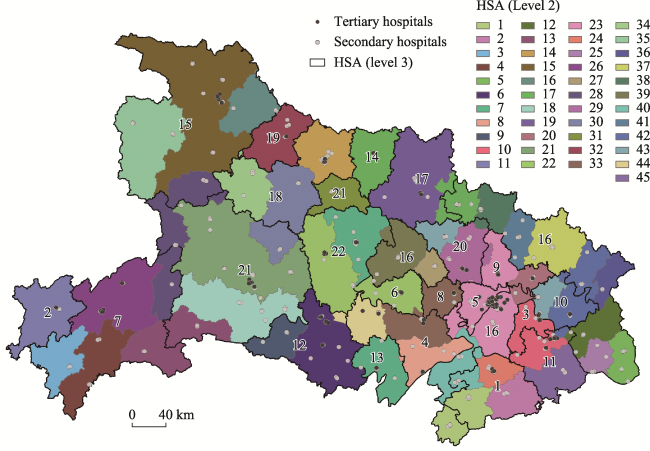
Figure 2 Distribution of population and tertiary and secondary hospitals in Hubei
The hospital data in 2016 were collected from the Health Commission of Hubei Province. This dataset includes the name, number of obstetrics beds and address of each hospital. The majority of the obstetric beds were allocated to tertiary (22.18%) and secondary hospitals (46.69%). Therefore, only tertiary and secondary hospitals are included in this study. There are 108 tertiary hospitals and 313 secondary hospitals in Hubei. The total number of obstetrics beds was 16,998. The average number of obstetrics beds for tertiary and secondary hos-pitals are 51 and 37, respectively. The coordinates of hospitals were obtained based on their addresses by using the geocoding Application Programming Interface (API) of Baidu Map.
The medical record data were obtained from the Health Commission of Hubei Province, which contains tracking information on antenatal care contacts during pregnancy and delivery care in 2016. Furthermore, each hospitalization trip from the residence address of the patient to the hospital can also be extracted from the records. The individual records were then aggregated at the town level by summing up the individual records according to the patients’ residence addresses. In other words, the patient flow from each town to each hospital was calculated. There were 688,514 inpatient discharge records in 2016, among which 581,790 (84.5%) had necessary attributes and could be spatialized and included for analysis. There were 13,023 and 12,870 town-hospital pairs with positive patient flow (i.e., at least 1 hospitalization record) to secondary and tertiary hospitals, respectively. The distribution of these patient flows will be shown and analyzed in the Results section.
Before the implementation of the Louvain algorithm, some examinations and adjustments of the patient flow matrix are needed. First, several towns had no patient records in the 2016 dataset. As a result, they were disconnected from other nodes in the network and therefore produced isolated communities. To address this issue, a hospitalization trip was mutually added from each of such towns to the hospital that attracts the largest patient flow from its neighborhood towns. Second, several towns had only 1 inpatient record linked to a distant hospital. As a result, these towns were assigned to an HSA far away from them. This may be caused by statistical errors or small sample bias. Similarly, mutual adjustments were performed to link these towns to appropriate HSAs. After these adjustments, the boundaries of some HSAs were still geographically discontinuous. Therefore, visual checks and adjustments were conducted to assure the geographic contiguity of HSAs by merging discontinuous towns into the neighboring HSA.

3 Results

3.1 Geographical patterns of maternal care patient flows

The distributions of maternal care patient flows are visualized in Figure 3. It can be observed that there are obvious local hospitalization patterns in the patient flows to tertiary and secondary hospitals. In other words, the majority of patient flows to a hospital are concentrated in the areas around it. The distribution of patient flows is closely related to the distribution of hospitals. However, the pattern is different for tertiary and secondary hospitals.
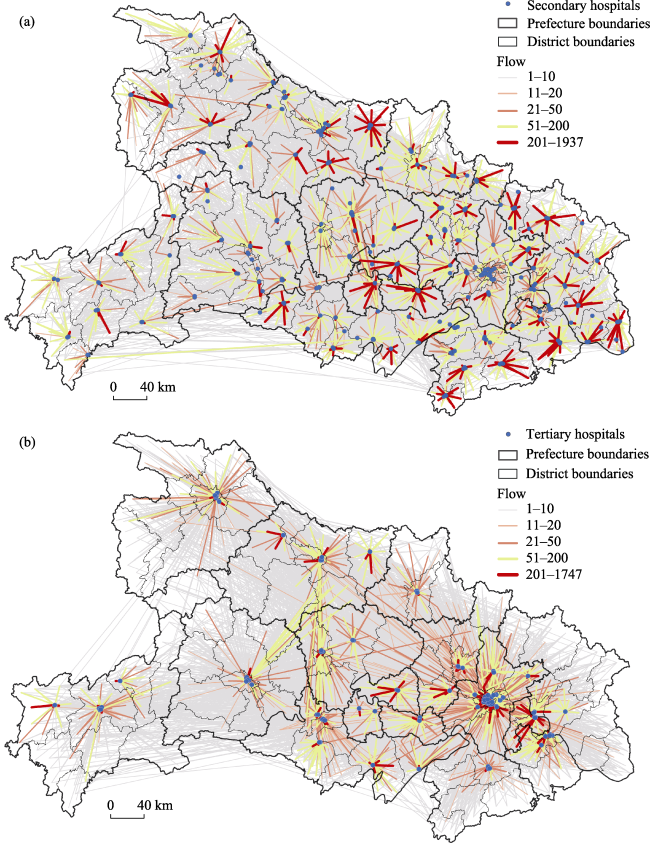
Figure 3 Distribution of maternal care patient flows to (a) secondary and (b) tertiary hospitals in Hubei
As shown in Figure 3a, the secondary hospitals have a larger amount and are more scattered across space than the tertiary hospitals. They are relatively denser in central and eastern Hubei, where the population density is also higher. Similarly, more patient flows to secondary hospitals are distributed in central and eastern Hubei than in other regions. Meanwhile, the sizes of patient flows are larger in central and eastern Hubei than in western Hubei. This uneven pattern is also obvious for the distribution of the largest flows (containing more than 200 patients).
The administrative boundaries have significant effects on the distribution of patient flows to secondary hospitals. In China, secondary hospitals are configured at the county level. There is at least 1 secondary hospital in most counties in Hubei. Most patient flows with a weight larger than 20 are distributed within the county where the destination hospital is located. The concentration of patient flows to secondary hospitals within prefecture boundaries is more obvious, with only a very small proportion of cross-prefecture boundary flows.
In contrast, there are fewer tertiary hospitals (approximately 1/3 of secondary hospitals) in Hubei. As shown in Figure 3b, their concentrations in central and eastern Hubei were more obvious. There are more long-distance patient flows to tertiary hospitals than to secondary hospitals. That is, tertiary hospitals serve patients from a larger area than secondary hospitals. The distribution of patient flows to tertiary hospitals is quite uneven, most of which are concentrated in eastern Hubei, especially in Wuhan and its surrounding cities, including Ezhou, Huangshi, Xiaogan and Tianmen.
The tertiary hospitals are commonly configured at the prefecture level. Therefore, the tertiary hospitals are mainly located in the central city of each prefecture city and are designated to serve the patients within the prefecture city, while other peripheral counties are not equipped with a tertiary hospital. However, there are still a substantial amount of patient flows to tertiary hospitals crossing the prefecture boundaries, which means that some patients choose to seek maternal care from hospitals outside of the prefecture city in which they reside. The potential reason may be that the quality of service is quite unbalanced. Therefore, a considerable proportion of patients have to seek high-quality maternal care across the prefecture boundaries.

3.2 Tertiary and secondary maternal care HSAs

3.2.1 Determining the optimal division of HSAs

To determine the optimal number and division of HSAs, the Louvain algorithm was run under different resolution parameter values. The maximal modularity was calculated in each scenario. Based on these scenarios, the relationships between the number of HSAs and the corresponding modularity for secondary and tertiary hospitals are visualized in Figure 4. The modularity increases at first and then decreases with the increase in the number of HSAs. This trend holds for both secondary and tertiary hospitals, which is also similar to the findings revealed by Hu et al. (2018) in the United States. Therefore, it is possible to determine the optimal division of HSAs as the one with the maximal modularity.
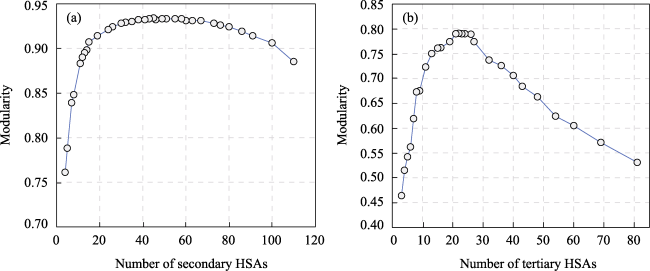
Figure 4 The relationships between the numbers of HSAs and modularity for secondary (left) and tertiary (right) hospitals
The maximal modularity for secondary HSAs is 0.934, which is a quite high level, indicating a very strong localization pattern and regularity in the network of patient flows to secondary hospitals. The maximal modularity corresponds to 45 secondary HSAs. The maximal modularity for tertiary HSAs is 0.791, which is lower than that for secondary HSAs.
This reflects that the structure of patient flows to tertiary hospitals is more complex and faces more uncertainty. Twenty-two tertiary HSAs are delineated under maximal modularity. The remaining analyses are based on the maximal-modularity divisions of HSAs.

3.2.2 Distribution of secondary HSAs

There are 313 secondary hospitals equipped with obstetrics beds in Hubei, which are delineated into 45 HSAs. On average, each secondary HSA consists of 7 secondary hospitals and serves a population of 1.3 million. The boundaries of the 45 secondary HSAs are shown in Figure 5. It is noteworthy that no constraint has been set to assure geographic contiguity in the modularity optimization algorithm, but the resulting HSAs show quite a high geographic contiguity. This again demonstrates that the pattern of patient flows to secondary hospitals is quite regular, which provides a solid foundation for the delineation and implementation of HSAs. Furthermore, there is a high consistency between the boundaries of secondary HSAs and the county-level administrative boundaries. Most secondary HSAs are composed of one or several counties. Only very few counties are divided into multiple parts that belong to different HSAs. This consistency provides great convenience for the operation of HSA-related policies in practice.
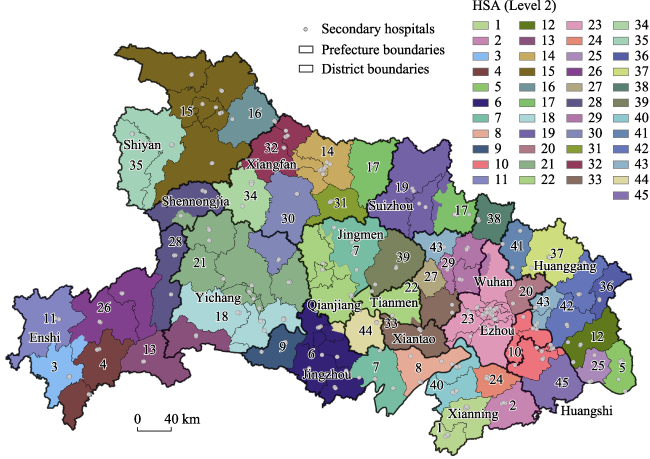
Figure 5 Secondary HSAs delineated by network optimization in Hubei

3.2.3 Distribution of tertiary HSAs

The 108 tertiary hospitals are delineated into 22 HSAs. On average, each tertiary HSA consists of 4.9 tertiary hospitals and serves 2.7 million people. As shown in Figure 6, there is also considerable geographic contiguity in the boundaries of tertiary HSAs. However, the sizes of tertiary HSAs vary more greatly than secondary HSAs, indicating that the difference in service quality and capacity across tertiary hospitals is more obvious. Notably, tertiary HSA #16 covers quite a broad territory, including not only the southeastern part of Wuhan, where the destination hospitals are located but also the eastern and northern parts of Huanggang, the northern part of Xiaogan, the eastern part of Suizhou, the adjacent area between Xiaogan and Jingmen, and the western and southern parts of Xianning. These separate parts are approximately 150 km away from the hospitals. This reflects the strong radiation capability of the high-quality hospitals in Wuhan, which is an important health care center in Hubei and even in central China. Despite tertiary HSA #16, two more HSAs are also delineated in Wuhan, i.e., HSA #5 and #9. Inconsistency exists between the boundaries of tertiary HSAs and the prefecture-level boundaries to some extent, indicating that cross-prefecture health care-seeking behaviors occur frequently. Some tertiary HSAs (e.g., #4, #16 and #21) cover multiple prefecture cities, while in some cities, multiple tertiary HSAs coexist (e.g., #10 and # 16 in Huanggang, #4, #12 and #13 in Jingzhou, #14, #18, #19 and #21 in Xiangfan, and #5, #9 and #16 in Wuhan).
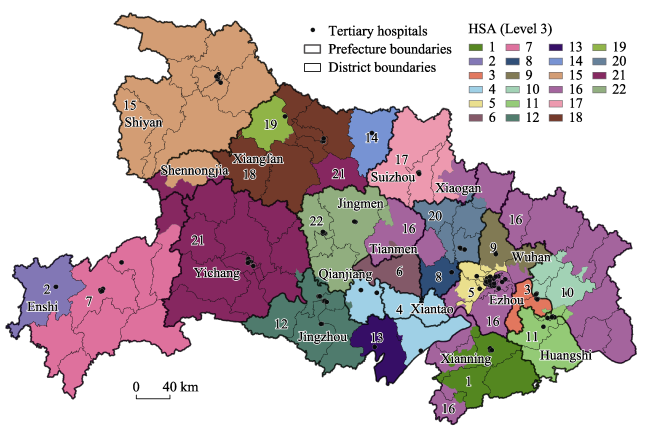
Figure 6 Tertiary HSAs delineated by network optimization in Hubei

3.3 Characteristics of the HSAs for maternal care

3.3.1 The sizes of HSAs

Figure 7 shows the TSP, TOB and SDR indices for the secondary and tertiary HSAs. Secondary HSAs vary greatly in TSP and TOB. The maximal and minimum TSP are 2.88 million and 70 thousand women of child-bearing age, while the maximal and minimum TOB are 853 and 97 beds, respectively. The mean TSP and TOB are 368 thousand persons and 255 beds, respectively. The maximal TSP appears at #23 secondary HSA, which contains most towns in Wuhan. Population density and demand for maternal care are also quite high in Wuhan. After excluding the maximal TSP, however, the standard deviation of TSP significantly decreases from 432 thousand to 211 thousand persons. The situation is similar for tertiary HSAs. The maximal TSP appears in tertiary HSA #16, which is centered in Wuhan. After excluding the maximal TSP, the standard deviation of the TSP of tertiary HSAs decreases to 375 thousand persons, which is approximately 49% of the mean TSP.
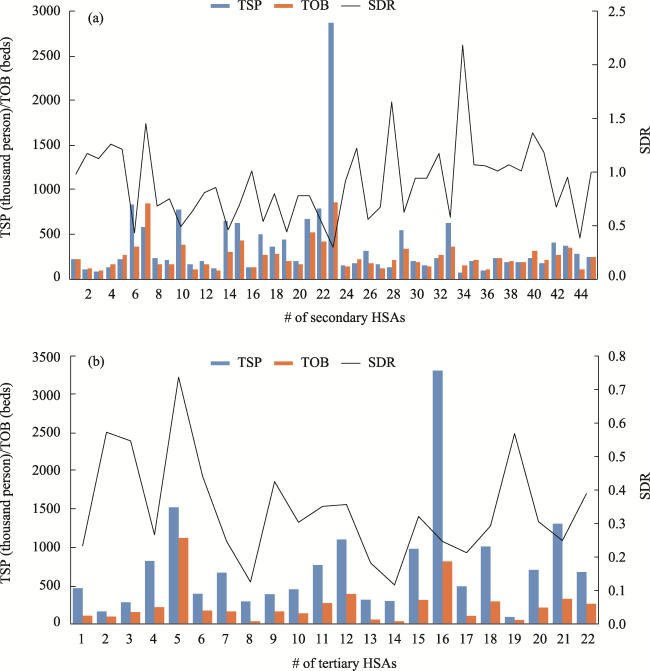
Figure 7 TSP, TOB and SDR of secondary and tertiary HSAs
The correlation coefficients between TOB and TSP for secondary and tertiary hospitals are 0.78 and 0.80, indicating that there is a considerable match between the distributions of maternal care demand and supply at the HSA scale. This is further confirmed by the distribution of SDR across HSAs, which is much more even than TSP and TOB. The coefficient of variation (CV) of SDR is 0.40 and 0.45 for secondary and tertiary HSAs, respectively. In summary, although the demand for maternal care is highly uneven in Hubei, HSAs may be appropriate units to balance maternal care supply and demand and to promote equal accessibility.

3.3.2 Demand-supply balance within HSAs

As shown in Figure 8, the distributions of SDR of secondary and tertiary HSAs are both spatially uneven, and there is an obvious mismatch between them. The SDR of secondary HSAs is lowest along the corridor area in central Hubei, including Ezhou, Wuhan, Xiantao, Tianmen, Qianjiang, and the adjacent area between Jingmen and Jingzhou. A low SDR can also be observed in Suizhou and Xiangyang. In contrast, the high SDR of tertiary HSAs is mainly located in similar areas, including Ezhou, Wuhan, Tianmen and Jingmen. The correlation coefficient between the two SDRs is -0.34. This indicates that a complementary relationship exists between the maternal care services provided by secondary and tertiary hospitals. In other words, in areas with lower accessibility to secondary (or tertiary) maternal care services, demanders tend to be compensated with relatively higher accessibility to tertiary (or secondary) services. Such a complementary relationship can help promote the overall equity of maternal care in Hubei.
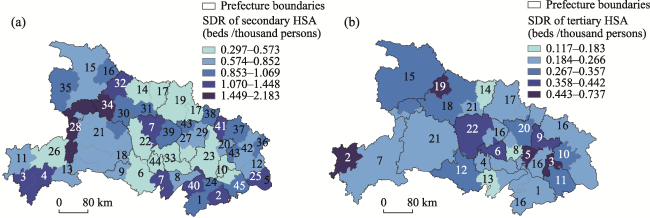
Figure 8 The distribution of SDR of secondary and tertiary HSAs in Hebei

3.3.3 Localization pattern of HSAs

To characterize the localization pattern of HSAs, the LI, MSI and NPI indices were calculated and are shown in Figure 9. For secondary HSAs, LI and MSI are both larger than 0.9, indicating a very solid localization pattern in the health care-seeking behaviors within secondary HSAs. The distributions of LI and MSI of secondary HSAs are relatively similar, which further demonstrates the stability of HSAs in containing maternal care behaviors. The LI and MSI of tertiary HSAs are lower than those of secondary HSAs, especially in the #9 secondary HSA and #16 tertiary HSA, which are both located in Wuhan. LI and MSI (0.688 and 0.716, respectively) are much lower than other HSAs. Except for the two HSAs, however, the LI and MSI of the other tertiary HSAs are larger than 0.829 and 0.808, respectively. This indicates that there is also a relatively high localization degree for tertiary HSAs. In the meantime, some high-quality hospitals in Wuhan show strong attraction toward patients from other cities. Similarly, the largest positive NPI is also observed in the HSAs in Wuhan. It can be clearly revealed by the above analysis that Wuhan acts as the regional health care center in Hubei Province.
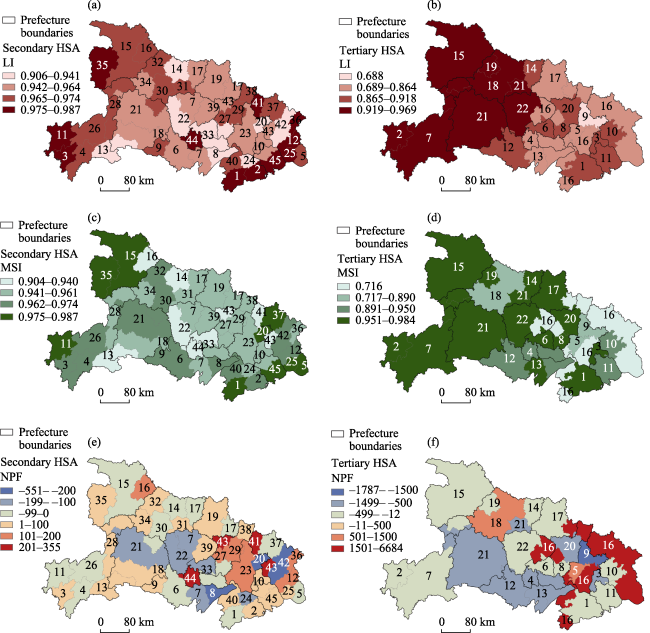
Figure 9 LI, MSI and NPI of secondary and tertiary HSAs in Hubei

3.4 Hierarchical structure of maternal care HSAs

3.4.1 Spatial relationships between secondary and tertiary HSAs

In Figure 10, the boundaries of tertiary and secondary HSAs are shown simultaneously. In most areas, a tertiary HSA commonly contains one or multiple secondary HSAs. In this situation, the relationship between tertiary and secondary HSAs meets our expectations and is in favor of the promotion of the hierarchical and referral system. However, there are also some cases where secondary HSAs intersect with tertiary HSAs, which makes it more difficult to establish a hierarchical and referral system.
Figure 10 Tertiary HSAs overlaid with secondary HSAs in Hubei (Note: the labeled figures represent the numbers of tertiary HSAs)

3.4.2 Visualizing the hierarchical structure of HSAs

To visualize the relationship between tertiary and secondary HSAs more clearly, an abstract mapping graph is drawn (Figure 11). In the graph, each line indicates that the two connected HSAs have overlapping areas. Three types of relationships can be observed from the graph. The first type is the one-to-one relationship, which means a tertiary HSA is related to only one secondary HSA. There is only one such pair of HSAs, i.e., #2 tertiary HSA and #11 secondary HSA.
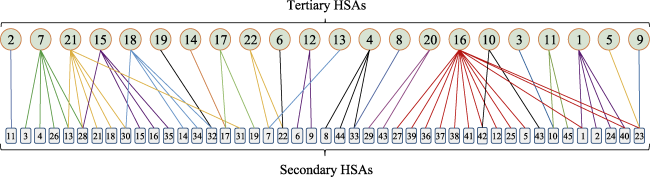
Figure 11 Mapping graph of the relationship between tertiary and secondary HSAs
The second type is the one-to-many relationship, which means that one tertiary HSA is related to multiple secondary HSAs. This relationship is the most common one, which can be found in tertiary HSAs #1, #4, #7, #11, #12, #15, #16, #17, #18, #21, and #22, especially in #16 tertiary HSA: 13 secondary HSAs are related to it.
The third type is the many-to-one relationship, which means multiple tertiary HSAs are related to the same secondary HSA. This appears in #1, #7, #10, #17, #23, #28, #30, #32, #33, and #40 secondary HSAs. However, a secondary HSA is only related to 3 tertiary HSAs at most.
It is noteworthy that some HSAs may simultaneously follow the one-to-many and many-to-one relationships, making the hierarchical structure of maternal care HSAs more complex. As for these situations, the many-to-one structures can be adjusted by dividing secondary HSAs or by merging tertiary HSAs according to the procedures proposed in Section 2.2.

3.4.3 Adjusted tertiary and secondary HSAs based on consistency

Based on the optimal HSAs, some adjustments can be made regarding the many-to-one relationship to improve the hierarchy structure of HSAs. In most cases of the many-to-one relationship, the corresponding secondary HSA covers multiple prefecture cities, while the tertiary HSAs match well with prefecture boundaries. This situation occurs in #7, #10, #13, #17, #22, #28, #30, #33 and #42 secondary HSAs. To improve the consistency between the boundaries of secondary and tertiary HSAs and prefecture cities, these secondary HSAs are divided into multiple parts according to prefecture boundaries. Secondary HSA #23 in Wuhan is also divided into several parts for two reasons. First, as shown in Figure 7, it has quite large sizes of demand population and obstetric beds supply, which might pose a big challenge to the management of HSAs. Second, it is related to three tertiary HSAs, following the many-to-one relationship. This structure also makes it difficult to manage the hierarchical diagnosis and referral system. As a result, another 13 secondary HSAs are generated. The total number of secondary HSAs is 58. Two tertiary HSAs, #19 and #16 (the Xianning part), are smaller than the corresponding secondary HSAs and therefore enlarged to assure the consistency of secondary and tertiary HSAs.
As shown in Figure 12, the relationship between these adjusted secondary and tertiary HSAs is quite clear. Most tertiary HSAs cover multiple secondary HSAs, while in some cases, the boundaries of tertiary HSA and secondary HSA overlap. The referral system from secondary HSAs to tertiary HSAs can be easily established based on the adjusted HSAs. Furthermore, the adjusted HSAs also match the prefecture boundaries quite well, which provides great convenience to the implementation of HSAs by the government.
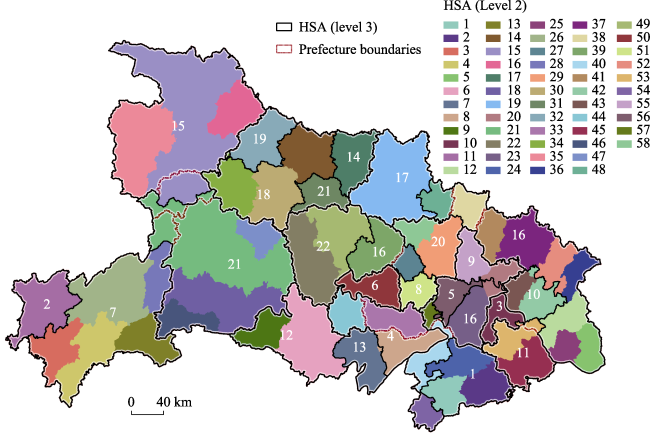
Figure 12 Adjusted tertiary and secondary HSAs based on consistency in Hubei

4 Discussion

The results show some specific characteristics of the health care service system and HSAs in China. Some “giant” HSAs, which contain a mass of obstetric beds and serve a large population and area, can be observed in Wuhan. The distribution of maternal care services (especially high-level services) is uneven in Hubei, with many tertiary hospitals concentrated in Wuhan. Meanwhile, Wuhan also has the highest population density, deriving intensive local demand for maternal care. Maternal care accessibility (measured as the supply-demand ratio within an HSA) is quite low in the HSAs in Wuhan. Furthermore, the service quality is relatively high for hospitals in Wuhan, which attracts many patients from other cities. This can be clearly demonstrated by the positive NPI of HSAs in Wuhan. The local and regional maternal care demand induced very intense competition for the services provided by the hospitals in Wuhan. This may be partially due to the insufficient and uneven provision of maternal care services currently in Hubei, which is common in the contexts of developing countries.
It is noteworthy that no constraints have been incorporated in the network optimization algorithm, but the resulting boundaries of HSAs show considerable geographic contiguity. Moreover, the functional boundaries of HSAs match the administrative boundaries to a certain extent. However, the relationship between HSA boundaries and administrative boundaries is quite complex and varies across different regions. This indicates that traditional analyses based on administrative units may lead to biased findings. Our analyses reveal considerable cross-boundary patient flows for maternal care. Many HSAs simultaneously contain the jurisdiction areas of multiple prefecture cities. This calls for intercity cooperation to promote the implementation of HSA-related policies.
As for the hierarchical structure of HSAs, our analyses clearly demonstrate that the hierarchical structure of HSAs is useful for understanding the organization of hierarchical health care services and the referrals between different levels. In this study, a complementary relationship between secondary and tertiary hospitals is revealed by the negative correlation between their accessibility at the HSA scale. A mapping graph is created to more clearly visualize the relationship between tertiary and secondary HSAs. Three types of relationships, i.e., the one-to-one, one-to-many, and many-to-one relationships, are observed in the analysis. The former two types of relationships favor the establishment and operation of hierarchical health care systems, while the third type of relationship is more complicated. To strengthen the applicability of HSAs in practice, some additional adjustments to the many-to-one relationship are further made. The adjusted secondary and tertiary HSAs show quite a clear hierarchy structure and match well with administrative boundaries, which is crucial for the establishment of the health care referral system.
Promoting maternal and child health is a key policy goal that draws great attention around the world. In China, the “Healthy China 2030” strategy highlights the hierarchical health care and referral system in the improvement of health care delivery. Countermeasures such as the hospital alliance have been proposed to engender universal health care accessibility and eliminate health inequality. However, little evidence has been provided by existing studies for the planning of the hierarchical health care and referral system in the Chinese context. This study fills this gap by delineating and characterizing HSAs for maternal care based on actual utilization behaviors. HSAs are reliable functional areas for planning, evaluating and managing maternal care services. The hierarchical structure between secondary and tertiary HSAs can act as a scientific baseline for the planning of hospital alliances and the referral system. Each tertiary HSA can be treated as a hospital alliance for maternal care. The tertiary hospitals within the same tertiary HSA and the corresponding secondary hospitals can be combined into a hospital alliance. Secondary and tertiary maternal care services and the referrals between them are suggested to be organized within the boundaries of tertiary HSAs.
Overall, although HSAs have drawn recurrent attention from studies in developed countries, little is known about their applicability and performance in developing contexts. To the best of our knowledge, this study is one of the earliest studies on the hierarchical structure of HSAs, on maternal care HSAs, and on HSAs in developing countries such as China. It verifies the transferability of the concept of HSA and the network optimization approach to delineating HSAs for maternal care and in China. It also contributes to the international literature by proposing an approach to establishing, visualizing and analyzing the hierarchical structure of HSAs.
There are some limitations to this exploratory study. First, constraints such as geographic contiguity and minimal and maximal sizes are not incorporated in the network optimization process. In future studies, more advanced algorithms can be applied to improve the delineation of HSAs, e.g., the spatially constrained Louvain and Leiden algorithm developed by Wang et al. (2021a). Second, the result of the network optimization approach has not been compared with other alternatives, e.g., the Dartmouth approach and the Huff-based approach. Future studies can make further efforts to compare the performance of different approaches to delineating HSAs in China. Third, although the hierarchy of maternal care is analyzed in this study, more studies are still needed to investigate the functions of tertiary and secondary hospitals and their impacts on the health care-seeking behaviors and HSAs.

5 Conclusions

This study formulates a set of methods for delineating hierarchical HSAs for maternal care, which can support the planning of a hierarchical health care and referral system. Based on a case study in Hubei Province, China, it verifies the feasibility and validity of the concept of HSA and the network optimization approach to delineating HSAs in the contexts of developing countries. In the case study, 45 secondary HSAs and 22 tertiary HSAs are delineated to achieve maximal modularity. The HSAs delineated by the network optimization approach can generate comparably high localization (measured by LI and MSI) of patient flows, as in the studies in developed countries (e.g., Jia et al., 2015; Klauss et al., 2005; Kilaru et al., 2015). The LI and MSI indices are both higher than 0.9 for secondary HSAs. For tertiary HSAs, the LI and MSI indices are higher than 0.83 and 0.81, respectively, except for one HSA in Wuhan. The LI and MSI of the exceptional HSA are 0.69 and 0.72, respectively, which also reach acceptable levels. This demonstrates the applicability of the network optimization approach in delineating HSAs for maternal care in the Chinese context or other developing contexts. It also provides evidence for the possible implementation of referral system planning and related policy-making in China.
[1]
Ashton C M, Petersen N J, Souchek J et al., 1999. Geographic variations in utilization rates in Veterans Affairs hospitals and clinics. New England Journal of Medicine, 340(1): 32-39.

PMID

[2]
Bastian M, Heymann S, Jacomy M, 2009. Gephi:An open source software for exploring and manipulating networks. Proceedings of the International AAAI Conference on Web and Social Media, 3(1): 361-362.

[3]
Basu J, Friedman B, 2007. A re-examination of distance as a proxy for severity of illness and the implications for differences in utilization by race/ethnicity. Health Economics, 16(7): 687-701.

DOI PMID

[4]
Chen W, Liu W, Ke W et al., 2018. Understanding spatial structures and organizational patterns of city networks in China: a highway passenger flow perspective. Journal of Geographical Sciences, 28(4): 477-494.

DOI

[5]
Fortunato S, 2010. Community detection in graphs. Physics Reports, 486(3): 75-174.

DOI

[6]
Goodman D C, Fisher E, Stukel T A et al., 1997. The distance to community medical care and the likelihood of hospitalization: is closer always better? American Journal of Public Health, 87(7): 1144-1150.

PMID

[7]
Goodman D C, Mick S S, Bott D et al., 2003. Primary care service areas: A new tool for the evaluation of primary care services. Health Services Research, 38(1): 287-309.

DOI

[8]
Guagliardo M F, Jablonski K A, Joseph J G et al., 2004. Do pediatric hospitalizations have a unique geography? BMC Health Services Research, 4(1): 2.

PMID

[9]
Healthy China Action Promotion Committee (HCAPC), 2019. Healthy China Action (2019-2030). Available at: http://www.gov.cn/xinwen/2019-07/15/content_5409694.htm. Accessed 3 June 2021. (in Chinese)

[10]
Hu Y, Cheng F, Chen Y, 2017. Risk factors for advanced pregnancy with second child and prepregnancy evaluation. China Medicine and Pharmacy, 7(20): 247-250.

[11]
Hu Y, Wang F, Xierali I M, 2018. Automated delineation of hospital service areas and hospital referral regions by modularity optimization. Health Services Research, 53(1): 236-255.

DOI PMID

[12]
Hubei Provincial Bureau of Statistics (HPBS), 2018. Hubei Statistical Yearbook 2018. Beijing: China Statistics Press.

[13]
Jia P, Wang F, Xierali I M, 2017a. Using a Huff-based model to delineate hospital service areas. The Professional Geographer, 69(4): 522-530.

DOI

[14]
Jia P, Wang F, Xierali I M, 2017b. Delineating hierarchical hospital service areas in Florida. Geographical Review, 107(4): 608-623.

DOI

[15]
Jia P, Xierali I M, Wang F, 2015. Evaluating and re-demarcating the hospital service areas in Florida. Applied Geography, 60(6): 248-253.

DOI

[16]
Kilaru A S, Wiebe D J, Karp D N et al., 2015. Do hospital service areas and hospital referral regions define discrete health care populations? Medical Care, 53(6): 510-516.

DOI PMID

[17]
Klauss G, Staub L, Widmer M et al., 2005. Hospital service areas: A new tool for health care planning in Switzerland. BMC Health Services Research, 5(1): 33.

DOI

[18]
Kpienbaareh D, Atuoye K N, Ngabonzima A et al., 2019. Spatio-temporal disparities in maternal health service utilization in Rwanda: What next for SDGs? Social Science & Medicine, 226(4): 164-175.

DOI

[19]
Lewis D J, Longley P A, 2012. Patterns of patient registration with primary health care in the UK national health service. Annals of the Association of American Geographers, 102(5): 1135-1145.

DOI

[20]
Li H, Xue M, Hellerstein S et al., 2019. Association of China’s universal two child policy with changes in births and birth related health factors: national, descriptive comparative study. The BMJ, 366(21): l4680.

[21]
Liang J, Li X, Kang C et al., 2019. Maternal mortality ratios in 2852 Chinese counties, 1996-2015, and achievement of Millennium Development Goal 5 in China: A subnational analysis of the Global Burden of Disease Study 2016. Lancet, 393(10168): 241-252.

DOI PMID

[22]
Liu Z, Wang T, Sun Z et al., 2018. The structure and evolution of trade relations between countries along the Belt and Road. Journal of Geographical Sciences, 28(9): 1233-1248.

DOI

[23]
Lu C, Zhang Z, Lan X, 2019. Impact of China’s referral reform on the equity and spatial accessibility of healthcare resources: A case study of Beijing. Social Science & Medicine, 235(8): 112386.

DOI

[24]
McLafferty S, Widener M, Chakrabarti R et al., 2012. Ethnic density and maternal and infant health inequalities:Bangladeshi immigrant women in New York City in the 1990s. Annals of the Association of American Geographers, 102(5): 893-903.

[25]
Newman M E, 2004. Analysis of weighted networks. Physical Review E, 70(5): 56131.

DOI

[26]
Newman M E, 2006. Modularity and community structure in networks. Proceedings of the National Academy of Sciences of the United States of America, 103(23): 8577-8582.

PMID

[27]
Newman M E, Girvan M, 2004. Finding and evaluating community structure in networks. Physical Review E, 69(2): 26113.

DOI

[28]
Rosenberg B L, Kellar J A, Labno A et al., 2016. Quantifying geographic variation in health care outcomes in the United States before and after risk-adjustment. PLoS One, 11(12): e166762.

[29]
Shortt N K, Moore A J, 2006. Functional localities: An integrated spatial approach towards health care locality definition. GeoJournal, 67(1): 27-40.

DOI

[30]
Sofianopoulou E, Rushton S, Rubin G et al., 2012. Defining GP practice areas based on true service utilisation. Health & Place, 18(6): 1248-1254.

[31]
Song X, Deng W, Zhou P et al., 2019. Spatial equity and influences of two-level public healthcare resources: A background to hierarchical diagnosis and treatment reform in China. Acta Geographica Sinica, 74(6): 1178-1189. (in Chinese)

[32]
Tao Z, Cheng Y, Du S et al., 2020a. Accessibility to delivery care in Hubei Province, China. Social Science & Medicine, 260(9): 113186.

DOI

[33]
Tao Z, Cheng Y, Liu J, 2020b. Hierarchical two-step floating catchment area (2SFCA) method: Measuring the spatial accessibility to hierarchical healthcare facilities in Shenzhen, China. International Journal of Equity in Health, 19(1): 164.

DOI

[34]
State Council of the People’s Republic of China (SC), 2015. Guiding opinions on propelling the building of a hierarchical diagnosis and treatment system. Beijing. Available at: http://www.gov.cn/zhengce/content/ 2015-09/11/content_10158.htm. Accessed 3 June 2021. (in Chinese)

[35]
UN, 2013. 2013 Fact sheet of Millennium Development Goals and beyond 2015. Available at: https://www. un.org/millenniumgoals/pdf/Goal_5_fs.pdf. Accessed 3 June 2021.

[36]
UN, 2015. The Millennium Development Goals Report 2015. Available at: https://www.undp.org/content/ undp/en/home/librarypage/mdg/the-millennium-development-goals-report-2015.html. Accessed 3 June 2021.

[37]
UN, 2020. Sustainable Development Goals. Available at: https://www.un.org/sustainabledevelopment/. Accessed 3 June 2021.

[38]
Wang C, Wang F, Onega T, 2021a. Network optimization approach to delineating health care service areas: Spatially constrained Louvain and Leiden algorithms. Transactions in GIS, 25(2): 1065-1081.

DOI

[39]
Wang C, Wang F, Onega T, 2021b. Spatial behavior of cancer care utilization in distance decay in the Northeast region of the U.S. Travel Behaviour and Society, 24(7): 291-302.

DOI

[40]
Wang F, 2020. Why public health needs GIS: a methodological overview. Annals of GIS, 26(1): 1-12.

DOI PMID

[41]
Wang F, Wang C, Hu Y et al., 2020. Automated delineation of cancer service areas in Northeast region of the United States: A network optimization approach. Spatial and Spatio-temporal Epidemiology, 33(6): 100338.

DOI

[42]
Wennberg J, Gittelsohn A, 1973. Small area variations in health care delivery: A population-based health information system can guide planning and regulatory decision-making. Science, 182(4117): 1102-1108.

PMID

[43]
Wennberg J E, Cooper M M, 1998. The Dartmouth Atlas of Health Care 1998. Chicago: American Hospital Publishing,Inc.

[44]
World Health Organisation (WHO), 1991. Sundsvall statement on supportive environments for health. 3rd International Conference on Health Promotion, 9-15 June 1991, Sundsvall, Sweden. Available at: https://www.who.int/healthpromotion/conferences/previous/sundsvall/en/.

[45]
Xiong X, Luo L, 2017. Use of geographical information systems for delimiting health service areas in China. Geospatial Health, 12(1): 486.

DOI PMID

[46]
Zhang Y, Baik S H, Fendrick A M et al., 2012. Comparing local and regional variation in health care spending. New England Journal of Medicine, 367(18): 1724-1731.

DOI

[47]
Zhao X, Wang W, Wan W, 2018. Regional differences in the health status of Chinese residents: 2003-2013. Journal of Geographical Sciences, 28(6): 741-758.

DOI

[48]
Zhao Y, Levina E, Zhu J, 2011. Community extraction for social networks. Proceedings of the National Academy of Sciences of the United States of America, 108(18): 7321-7326.

DOI PMID

Outlines

/