
Journal of Geographical Sciences >
Spatial analyses of factors affecting household structure in Chinese cities: The case of three-generation lineal households
|
Li Ting (1982-), PhD and Professor, specialized in demography and family studies. E-mail: li.ting@ruc.edu.cn |
Received date: 2021-07-27
Accepted date: 2021-09-17
Online published: 2022-12-25
Supported by
National Social Science Foundation of China(20BRK043)
Household structure is an important aspect of family change during China’s modernization process. Existing literature has demonstrated significant associations between various factors and household structure, but the spatial variation in these relationships has not been examined. Using the 2010 Chinese population census data and geographically weighted regression (GWR) model, this study explored the spatial patterns of three-generation lineal households, a functionally important household type in China, and its influencing factors. There was significant heterogeneity in the distribution of three-generation lineal households. Socioeconomic, demographic, and cultural factors were all significantly related to the proportion of three-generation lineal households, but the relationships are place-specific in terms of direction and magnitude. These results suggest that the distribution of Chinese household structures cannot be explained by a single framework of family modernization theory but is determined by the interplay of various local characteristics. Especially, population migration plays an equally important role in affecting household structure than socioeconomic development in China. This work contributes to the family literature by highlighting the spatial heterogeneity in the impact of varying factors on household structure. Beyond the classic modernization theory, it sets a contextualized framework for understanding how Chinese household change in response to the rapid social transformation.
LI Ting , LIU Tao , LIU Jiajie , CHENG Tianyi . Spatial analyses of factors affecting household structure in Chinese cities: The case of three-generation lineal households[J]. Journal of Geographical Sciences, 2022 , 32(12) : 2560 -2576 . DOI: 10.1007/s11442-022-2061-y
Table 1 Descriptive statistics of variables |
| Variable | Observations | Mean | Std. dev. | Min | Max | VIF |
|---|---|---|---|---|---|---|
| Dependent variable | ||||||
| Three-generation lineal household (%) | 332 | 16.89 | 6.08 | 3.03 | 37.54 | |
| Independent variables | ||||||
| Socioeconomic indicator | 332 | 0.00 | 1.00 | -2.77 | 2.66 | 4.41 |
| Standardized housing price (%) | 332 | 20.98 | 9.43 | 1.90 | 97.54 | 1.29 |
| Population aged 0-14 (%) | 332 | 17.28 | 4.67 | 8.28 | 31.86 | 2.78 |
| Population aged 65+ (%) | 332 | 8.65 | 1.94 | 1.79 | 16.50 | 1.97 |
| Immigration (%) | 332 | 10.49 | 11.55 | 0.74 | 79.92 | 3.55 |
| Emigration (%) | 332 | 18.34 | 6.97 | 1.54 | 41.77 | 1.17 |
| Minority (%) | 332 | 15.25 | 25.79 | 0.01 | 97.19 | 1.77 |
Table 2 Global spatial autocorrelation analysis results |
| Variables | Moran’s I | Z-score | P |
|---|---|---|---|
| Three-generation lineal household | 0.420 | 12.431 | 0.000 |
| Socioeconomic indicator | 0.438 | 12.983 | 0.000 |
| Standardized housing price | 0.147 | 4.582 | 0.000 |
| Population aged 0-14 | 0.633 | 18.718 | 0.000 |
| Population aged 65+ | 0.608 | 18.017 | 0.000 |
| Immigration | 0.331 | 9.955 | 0.000 |
| Emigration | 0.283 | 8.408 | 0.000 |
| Minority | 0.746 | 22.109 | 0.000 |
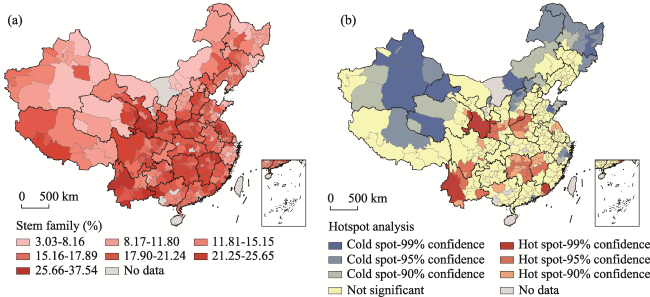
Figure 1 Spatial distribution (a) and hotspot analysis (b) of three-generation lineal households |
Table 3 Estimation results of OLS regression model |
| Variable | Coefficient | Standard error |
|---|---|---|
| Socioeconomic indicator | -2.813*** | 0.593 |
| Standardized housing price | 0.018 | 0.034 |
| Population aged 0-14 | 0.052 | 0.101 |
| Population aged 65+ | 0.145 | 0.205 |
| Immigration | -0.060 | 0.046 |
| Emigration | -0.123*** | 0.044 |
| Minority | -0.051*** | 0.015 |
| Constant | 18.013*** | 3.007 |
| Observations | 332 | |
| Adj. R2 | 0.287 | |
| F | 20.043*** | |
| AICc | 2038.797 | |
Note: *p<0.1; **p<0.05; ***p<0.01 |
Table 4 Estimation results of GWR model |
| Minimum | Lower quartile | Median | Upper quartile | Maximum | DIFF of criterion | |
|---|---|---|---|---|---|---|
| Socioeconomic indicator | -6.476 | -1.704 | -0.241 | 1.081 | 2.448 | nonstationary |
| Standardized housing price | -0.386 | -0.113 | 0.040 | 0.208 | 0.329 | nonstationary |
| Population aged 0-14 | -1.363 | -0.650 | -0.090 | 0.256 | 0.627 | nonstationary |
| Population aged 65+ | -1.349 | -0.726 | -0.473 | -0.268 | 0.355 | nonstationary |
| Immigration | -0.563 | -0.345 | -0.253 | -0.192 | -0.014 | stationary |
| Emigration | -0.312 | -0.169 | -0.100 | -0.058 | 0.135 | stationary |
| Minority | -1.046 | -0.012 | 0.018 | 0.039 | 1.004 | stationary |
| Intercept | 5.509 | 20.105 | 32.019 | 37.577 | 47.423 | nonstationary |
| Adjusted R2 | 0.547 | |||||
| AICc | 1930.237 | |||||
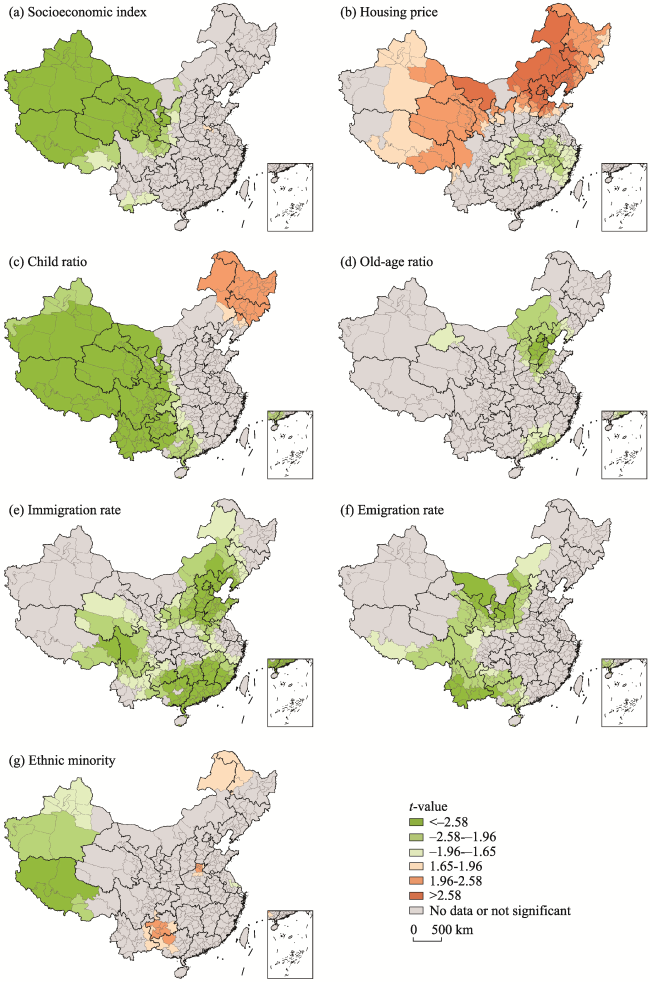
Figure 2 Estimated results of GWR model |
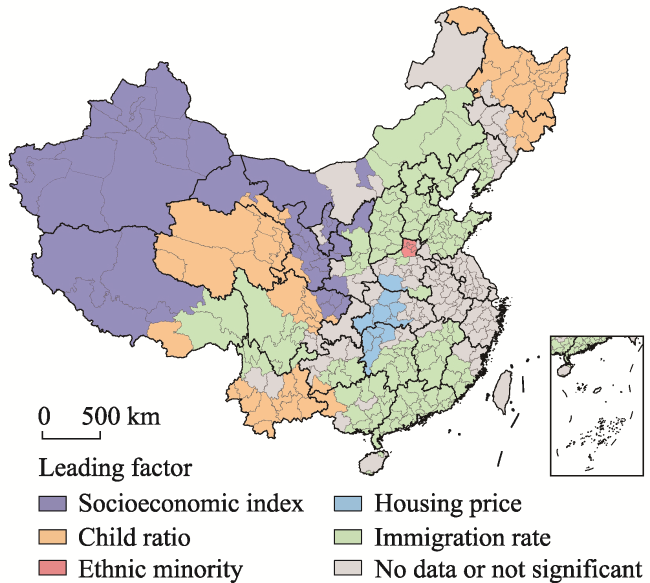
Figure 3 Spatial distribution of local leading influencing factors |
| [1] |
|
| [2] |
|
| [3] |
|
| [4] |
|
| [5] |
|
| [6] |
|
| [7] |
|
| [8] |
|
| [9] |
|
| [10] |
|
| [11] |
|
| [12] |
|
| [13] |
|
| [14] |
|
| [15] |
|
| [16] |
|
| [17] |
|
| [18] |
|
| [19] |
|
| [20] |
|
| [21] |
|
| [22] |
|
| [23] |
|
| [24] |
|
| [25] |
|
| [26] |
|
| [27] |
|
| [28] |
|
| [29] |
|
| [30] |
|
| [31] |
|
| [32] |
|
| [33] |
|
| [34] |
|
| [35] |
|
| [36] |
|
| [37] |
|
| [38] |
|
| [39] |
|
| [40] |
|
/
| 〈 |
|
〉 |