Research Articles

The spatial patterns and determinants of internal migration of older adults in China from 1995 to 2015

  • LIU Ye , 1, 2, 3 ,
  • HUANG Cuiying 1, 2, 3 ,
  • WU Rongwei , 1, 4, * ,
  • PAN Zehan 5 ,
  • GU Hengyu 6
Expand
  • 1. School of Geography and Planning, Sun Yat-sen University, Guangzhou 510275, China
  • 2. Guangdong Key Laboratory for Urbanization and Geo-simulation, Sun Yat-sen University, Guangzhou 510275, China
  • 3. Guangdong Provincial Engineering Research Center for Public Security and Disaster, Guangzhou 510275, China
  • 4. Population Development and Policy Research Center, Chongqing Technology and Business University, Chongqing 400067, China
  • 5. School of Social Development and Public Policy, Fudan University, Shanghai 200433, China
  • 6. Department of Geography and Resource Management, The Chinese University of Hong Kong, Hong Kong SAR, China
* Wu Rongwei (1989-), PhD and Associate Professor, specialized in population geography and urban geography. E-mail:

Liu Ye (1986-), PhD and Professor, specialized in population geography, urban geography and health geography. E-mail:

Received date: 2021-12-24

  Accepted date: 2022-08-25

  Online published: 2022-12-25

Supported by

National Natural Science Foundation of China(42001153)

National Natural Science Foundation of China(42001161)

Abstract

Although China was one of the countries with the fastest-growing aging population in the world, limited scholarly attention has been paid to migration among older adults in China. The full picture of their migration in the entire country over time remains unknown. This study examines the spatial patterns of older interprovincial migration flows and their drivers in China over the period 1995 to 2015, using four waves of census data and intercensal population sample survey data. Results from eigenvector spatial filtering negative binomial regressions indicate that older adults tend to migrate away from low cost-of-living rural areas to high cost-of-living urban and rural areas, moving away from areas with extreme temperature differences. The location of their grandchildren is among the most important attractions. Our findings suggest that family-oriented migration is more common than amenity-led migration among retired Chinese older adults, and the cost-of-living is an indicator of economic opportunities for adult children and the quality of senior care services.

Cite this article

LIU Ye , HUANG Cuiying , WU Rongwei , PAN Zehan , GU Hengyu . The spatial patterns and determinants of internal migration of older adults in China from 1995 to 2015[J]. Journal of Geographical Sciences, 2022 , 32(12) : 2541 -2559 . DOI: 10.1007/s11442-022-2060-z

1 Introduction

All regions of the world are nowadays experiencing population aging. It is expected that, by the middle of this century, the world’s population aged 60 years and older will reach 2.1 billion, occupying 22% of the world’s population. The degree and pace of population aging varies substantially by country, and Eastern Asia is among the fastest-aging region around the world (UNDESA, 2020). Although population aging may decrease the rate of migration as older adults are less willing to migrate than their younger counterparts, there is a rise in the migration of older population in developed countries (Zaiceva, 2014; Holecki et al., 2020). While some theories (e.g. three-stage developmental framework) have been put forward to explain the mechanism behind migration among older people in developed countries, whether this theory is applicable in fast-aging developing countries remains unknown.
As one of the countries with the fastest aging population, China has witnessed a dramatic growth in its older population over the past few decades. The increase in the older population is accompanied by the growth of the older migrant population. Data from China’s population censuses and 1% population sample surveys show that the scale of the migrant population aged 60 and over has increased rapidly from 5.03 million in 2000 to 13.04 million in 2015, with an average annual growth rate of 6.6%. Meanwhile, the share of migrants aged 60 and over in the total older population increased from 3.87% in 2000 to 5.88% in 2015. The surge of migration of older adults within China has brought about great challenges to the current social welfare system, as welfare in China is bonded to the hukou system, which imposes constraints on migration by excluding migrants from access to local public goods and services (Chan and Buckingham, 2008; Wang et al., 2015). The rapid concentration of older adults in large cities such as Shanghai and high-amenity areas such as Hainan Island has imposed a growing fiscal burden and new sources of revenue (from sectors such as hospitality, leisure, and healthcare) upon local governments. Despite the dramatic increase in volume, migration among older adults in China has drawn limited attention from academia, and little research has been done to examine factors driving this type of migration using nationwide datasets across periods of time. Therefore, investigating the change in spatial pattern of the migration of older would not only fill the literature gap on China’s internal migration but also provide a reference for the equitable allocation of public resources and the construction of an age-friendly society.
Against the backdrop of population aging, a growing body of research has investigated the change in the spatial patterns of migration of older adults in Western developed countries. Although the spatial pattern of the largest migration flows of older adults varies from one country to another, a common trend is observed: the older population tends to move from colder to warmer regions, from big cities to small towns and rural areas, and from higher to lower cost-of-living areas (Longino, 1982; Golant, 1990; Lin, 1999; Frey et al., 2000; Stockdale and MacLeod, 2013; Pytel and Rahmonov, 2019). Some scholars found that the direction and volume of the largest migration flows of older adults in developed countries changed over time, implying that the drivers of and constraints on migration of older adults changed over different periods of time (Conway and Rork, 2016). One typical example is the decline in propensity for migration from colder to warmer regions by 2.5% in the United States from 1980 to 2010 (Conway and Rork, 2016).
Migration researchers have explained why older generations move away from the place they used to work to elsewhere after retirement in developed countries. The most popular theory of migration of older adults is the three-stage developmental model, which indicates that amenity-led migration normally occurs for relatively young, healthy, and married couples, and migration toward adult children and institutions (e.g. health care institutions, hospitals, community centres, etc.) occurs when older adults experienced chronic disability and widowhood (Litwak and Longino, 1987). Another theory that explains the amenity-led migration of older adults after retirement is the spatial equilibrium model of migration (Graves and Mueser, 1993). This theory indicates that household migration occurs in response to the combination of both economic conditions and the quality of life including location-specific amenities (e.g. climate, landscape, public services, crime). The theory of the ‘modified extended family’ (MEF) examines the impact of family ties other than couple and pre-adulthood children (e.g. kinship between adult children and their parents) on migration behaviours, suggesting that older adults tend to follow their adult children for home care (Litwak and Longino Jr, 1987; Liaw et al., 2002). The ‘escalator region’ hypothesis indicates that the South East region of England plays the role of ‘upward social class escalator’ in the United Kingdom (Fielding, 1992). Specifically, the ‘escalator region’ attracts potentially upwardly young adults from the rest of the country and enables them to rapidly move up the social ladder along with local young adults. When they reach near-retirement age, they migrate away from the ‘escalator region’ to other regions.
The above theories have been tested by empirical studies on the migration of older adults in developed countries. Conway and Rork (2011) examined the role of individual characteristics such as disability, being a veteran, and socioeconomic status in shaping the interstate migration behaviour of older adults in the United States from 1970 to 2000 and found that disability status had grown in importance, while veteran and socioeconomic status had declined or remained stable. Liaw, Frey et al. (2002) applied a linked-lives perspective to the study of location choices of older migrants in the United States, showing that the location of their grown-up children was among the most important migration attractions for older generations. Additionally, location-specific amenities such as housing prices, aged care facilities, crime rates, and climatic conditions have drawn attention from researchers in the field of older migration (Walters, 2002; Whisler et al., 2008; Park and Kim, 2015). For example, Park and Kim (2015) found that housing prices, welfare facilities, and changes in community composition shaped the out-migration decision of Korean older adults. Whisler et al. (2008) indicated that college-educated older adults favour regions with low crime rates and mild climates.
The past two decades have seen an increase in scholarly interest in applying gravity-type models to understand the drivers of internal migration in China (Fan, 2007; Liu and Shen, 2014b; Shen, 2015; Shen, 2016; Liu and Shen, 2017; Gu et al., 2021; Pu et al., 2019; Gu and Shen, 2021). While the economic disparity between more and less developed regions and between large cities and small towns and rural areas has been found to be the main driver of Chinese internal migration since the mid-1990s, recent studies have investigated the role of location-specific amenities in driving migration (Liu and Shen, 2014a; Liu et al., 2015; Liu and Shen, 2017; Yang et al., 2017; Gu and Shen, 2021). Another important determinant of internal migration is strong social ties between potential migrants at the place of origin and their family members, relatives, friends, and fellow villagers at the destination (Fan, 2007; Liang, 2016; Huang et al., 2018; Deng et al., 2020). Traditional gravy-type models are based on the assumption of independence among migration flows, failing to take into account the processes of migration decision-making: first, an individual compares all sets of potential destinations, chooses one from all sets of destinations, and then compares all destinations within the selected set and chooses the final destination (hierarchical choice process); second, individuals who move to the same destination and whose place of origin is spatially close to each other tend to be affected by similar intervening opportunities (Stouffer, 1960; Pellegrini and Fotheringham, 2002; Chun, 2008). Recognising that network autocorrelation exists in the residuals of spatial interaction data of migration, recent studies have used eigenvector spatially filtered gravity-type models to estimate the volumes of interregional migration in China (Shen, 2016; Liu and Shen, 2017; Gu et al., 2019; Gu and Shen, 2021).
While a large body of literature has described and explained the spatial patterns of internal migration among older adults in developed countries and among all ages combined in China, little research has been done to investigate the mechanisms behind internal migration of older adults in China, the largest developing economy in the world, using nationwide datasets across periods of time. The drivers of and constraints on the migration of older adults may differ between China and developed countries due to different economic, social, cultural, and institutional contexts (Dou and Liu, 2017; Kou et al., 2018; Chen and Wang, 2020). In the Chinese case, enjoying a seasonal lifestyle has been found to be retirees’ primary motive for flocking to Sanya (‘the phenomenon of snowbirds’), a city renowned for its tropical climate and beautiful bays (Kou et al., 2018; Chen and Wang, 2020; Chen and Bao, 2021). Other drivers of migration of older adults include returning to their hometown after retirement, searching for better social services, and following their grown-up children who move to metropolitan areas (Dou and Liu, 2017). Hukou restrictions in large cities may lead to the return of the migration of older adults. Stringent hukou restrictions in large Chinese cities limit migrants’ access to goods and benefits provided by the local authority, and migrants without a local hukou may have little willingness to stay in these cities when they get old (Tang and Feng, 2015; Huang et al., 2021).
Despite some merits, prior studies on migration among older Chinese adults have some limitations. First, they are based on either qualitative data collected in one city (e.g. Sanya) through face-to-face interviews or quantitative data from a wave of nationally representative surveys covering a certain number of prefectures (e.g. China Health and Retirement Longitudinal Study, CHARLS), but the full picture of migration of older adults of the entire country is still unknown. Second, they examined a single (economic, amenity, or policy-related) location-specific factor underlying migration of older adults, thereby failing to consider multiple factors at both origins and destinations. Third, they do not unravel how the spatial patterns and determinants of migration of older adults change over time by using cross-sectional data collected at a single point in time.
To address these gaps, this study examines the spatial patterns of older migration in China from to 1995-2015 and identifies their location-specific determinants, drawing upon four waves of data derived from China’s population censuses and 1% population sample surveys. In particular, this study uses eigenvector spatial filtering (ESF) negative binomial regression models (NBRM) to examine location-specific factors that propel or impede interprovincial migration among older people. This study enhances our knowledge about migration pattern of older adults in China by providing a comprehensive and dynamic picture and by simultaneously considering multiple location-specific factors underlying migration of older adults in both origin and destination regions.

2 Data, variables and methodology

2.1 Data source

This study focused on 30 out of 34 provinces (including autonomous regions, municipalities, and special administrative regions) in China (Figure 1). Tibet, Taiwan, Hong Kong, and Macao were not considered because of data unavailability. The migration data in this study were primarily gathered from the public use microdata sample of the national censuses (“Census”) and the 1% national population sample surveys (“Survey”) in the period 2000-2015. The microdata sample of 2000 Census, 2005 Survey, 2010 Census, and 2015 Survey datasets contain 1.18 million, 2.59 million, 1.27 million, and 1.37 million observations, respectively, accounting for 0.095%, 0.2%, 0.095% and 0.1% of the total population at the time of enumeration. We defined older adults as those who had reached the statutory retirement age, that is, men over 60 years of age and women over 50 (note that the statutory retirement age for female professionals/cadres is 55) at the beginning of each five-year interval (i.e. 1995-2000, 2000-2005, 2005-2010 and 2010-2015). Older interprovincial migrants referred to older adults whose province of residence at the time of the survey was different from five years ago. Migration flow data were generated by aggregating province-level statistics, where the sampling weight of each province was considered. There are 870×4=3480 expected migration flows between pairs of 30 provinces for the four time periods. We were not able to count the number of intra-provincial migrants, as related information was not available from Chinese census/surveys until 2015.
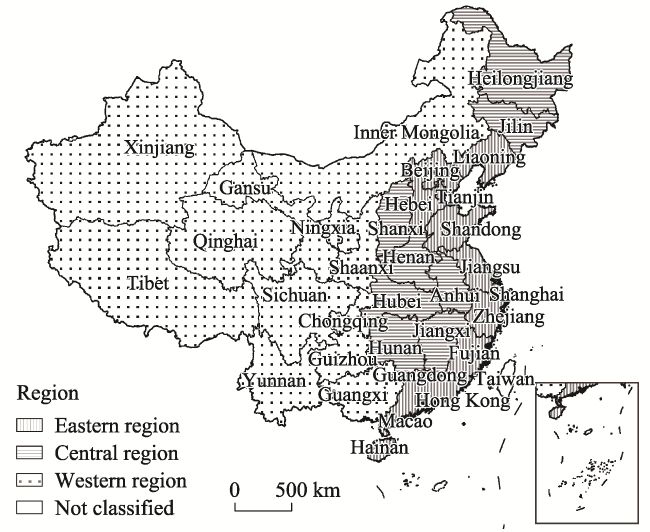
Figure 1 Administrative divisions of provincial-level regions in China

2.2 Variables

The dependent variable of the models was the number of older adults migrating from one province to another. Independent variables included distance between older migrants’ origin and destination province, the older population stock, consumption expenditure, climatic amenities, medical facilities, and the stock of migrant children (Table 1). These variables captured information on gravity-related factors, amenity-related factors, and family-related factors. The theoretical basis for the amenity-related factors is the three-stage developmental model and the spatial equilibrium model of migration, which explains the effect of location-specific amenities on older adults’ migration. Because of the theory of the ‘modified extended family’ (MEF) and the ‘escalator regions’ in China, we added family-related factors in the models. In addition, both origin-related variables and destination-related variables were included in the models based on the push-pull migration theory.
Table 1 Independent variables for models
Variable Description
POPi,j Population sizes of older adults in the origin and destination provinces, persons a
DISTij Minimum travel time by rail between provincial capitals of the origin and destination provinces, hours b
RCONSi,j Per capita consumption expenditure of rural residents in the origin and destination provinces, yuan a
UCONSi,j Per capita consumption expenditure of urban residents in the origin and destination provinces, yuan a
TEMPi,j Average temperatures difference between January and July in the provincial capitals of the origin and destination provinces, ℃a
BEDi,j The number of hospital beds per ten thousand population in the origin and destination provinces, beds a
MIGij The number of migrants under the age of 16 between the origin and destination provinces, persons c

Source: a China Statistical Yearbook, 1996-2016. b National Railway Passenger Train Timetable. c 2000 and 2010 population censuses and 2005 and 2015 1% population sample surveys.

2.2.1 Gravity variables

Gravity variables consisted of older population stock and the migration distance, which have been widely used in previous migration studies (Li et al., 2012; Shen, 2016; Gu et al., 2019; Pu et al., 2019; Gu et al., 2021; Cui et al., 2022). The stock of the older population (POP) was measured by the number of older adults at the origin and the destination. The variable of DIST was measured by minimum travel time by rail between provincial capitals of the origin and destination provinces. Some scholars have adopted railway distance or road distance between cities when conducting research on migration in China (Liu and Shen, 2014b; Shen, 2015; Wang et al., 2021). We used minimum travel time by rail rather than railway distance, with the advantage to reflect speed-up of trains over 1995-2015.

2.2.2 Living cost

Older adults may attach great importance to housing costs, taxes, and other living costs when making decisions on whether to move and where to move (Duncombe et al., 2003; Park and Kim, 2015). High living costs may drive older people away and dampen the willingness of others to move in. In this study, we used per capita consumption expenditure to capture the living costs of a province. Given that the costs of living differ substantially between urban and rural areas in China, we used two separate groups of variables, per capita consumption expenditure of rural residents (RCONS) and per capita consumption expenditure of urban residents (UCONS) for the analysis.

2.2.3 Climatic amenities

Previous studies have considered the difference in average temperatures between January and July in provincial capitals (TEMP) (Shen, 2012; Liu and Shen, 2014b; Liu and Shen, 2017). Some studies conducted in more advanced countries have shown that older adults tend to migrate away from areas with extreme weather to areas with mild winters and plenty of sunshine (Walters, 2002; Schaffar et al., 2019).

2.2.4 Medical amenities

This study used the number of hospital beds per ten thousand population (BED) to measure the provision of medical services. Older adults tend to prefer areas with better medical services when making migration destination choices. In contrast, areas with limited medical resources are less attractive to older adults.

2.2.5 The stock of migrant children

The idea that kinship may affect the volume of older migration dates back to a seminal paper about the theory of the ‘modified extended family’ (MEF), which suggests that older adults are expected to follow their adult children for home care (Litwak and Longino Jr, 1987; Liaw et al., 2002). In China, it is common for older adults to shoulder the responsibility of raising their grandchildren and ensuring their adult offspring devote themselves to work (Dou and Liu, 2017; Gao and Cheng, 2018). In our analysis, the volume of migration of people under the age of 16 between the two provinces (MIG) was used as a proxy to represent the size of migrant grandchildren. Older migrants tend to migrate to the province where their adult children/grandchildren were likely to move as ‘trailing parents/grandparents’.

2.3 Negative binomial regression model and eigenvector spatial filtering

The Poisson regression model (PRM) is commonly used instead of the traditional log-linear regression model to analyse the influencing factors of migration. The latter is found to be problematic because the number of migrants is a non-negative integer, and the residuals of regression are not normally distributed (Flowerdew and Aitkin, 1982). Nevertheless, our dataset violated the equi-dispersion assumption, that is, the variance of the dependent variable is assumed equivalent to the mean value in the PRM. This study used a negative binomial regression model (NBRM) to solve the problem of over dispersion by adding a dispersion parameter (α) to the function. Since our dataset considered the dimension of time, we used the negative binomial panel model. The results of the Hausman test suggested that fixed-effect models were superior to random-effect models for our dataset. The variance of the NBRM is a function of the mean μijt and dispersion parameter (α):
$\operatorname{Var}\left(M_{i j t}, X_{i m t}, X_{j n t}, D_{i j}, T_{t}, \alpha, m_{i j}\right)=\mu_{i j t}+\alpha \mu_{i j t}^{2}$
The older migration flow Mijt followed a Poisson-Gamma mixed distribution:
$\operatorname{Pr}\left(M_{i j t} \mid X_{i m t}, X_{j n t}, D_{i j}, T_{t}, \alpha, m_{i j}\right)=\frac{\Gamma\left(M_{i j t}+\alpha^{-1}\right)}{M_{i j t} ! \Gamma\left(\alpha^{-1}\right)}\left(\frac{\alpha^{-1}}{\alpha^{-1}+\mu_{i j t}}\right)^{\alpha^{-1}}\left(\frac{\mu_{i j t}}{\alpha^{-1}+\mu_{i j t}}\right)^{M_{i j t}}$
where Mijt represents the number of older migrants from province i to province j in period t, Ximt (or Xjnt) denotes the m (or n) variable of province i (or province j) in period t, Dij denotes the distance between province i and province j, mij stands for the stock of migrant children from province i to province j, and Tt denotes the dummy variable indicating the period of t when migration occurs. Γ denotes the standard gamma distribution function, and α determines the degree of dispersion. When α = 0 in Equation 2, the NBRM is the same as the PRM.
Conventional spatial interaction models support the assumption that migration flows are independent of each other. However, as mentioned by Tobler’s (1970) first law of geography, spatial autocorrelation (SA) usually exists in spatial data, implying that spatial units have spatial relationships. In this case, SA is also a type of network autocorrelation (NA), that is, the older interprovincial migration origin-destination network. Eigenvector spatial filtering (ESF) is a commonly used method to capture NA, thereby reducing bias in the estimation results (Chun, 2008; Chun and Griffith, 2011). The ESF extracts eigenvectors from a transformed spatial weight matrix.
$\left(A-\frac{11^{T}}{n}\right) S\left(A-\frac{11^{T}}{n}\right)$
where A is an n-by-n identity matrix, 1 is an n-by-1 vector of ones, and S is an n-by-n spatial weight matrix (Tiefelsdorf et al., 1999). We used the most widely used adjacent space weight matrix,
$\left(A_{n^{2}-n}-\frac{1_{n^{2}-n} 1_{n^{2}-n}^{T}}{n^{2}-n}\right) S^{N}\left(A_{n^{2}-n}-\frac{1_{n^{2}-n} 1^{T} n^{2}-n}{n^{2}-n}\right)$
where $A_{n^{2}-n}$ is an (n2-n)-by-(n2-n) identity matrix, $I_{n^{2}-n}$ is an (n2-n)-by-1 vector of ones, and SN is an (n2-n)-by-(n2-n) spatial weight matrix. SN can be specified by
$S_{i j, k l}^{N}=\left\{\begin{array}{c}1 \text { if } i=k \text { and } s_{j l}=1, \text { or if } j=l \text { and } s_{i k}=1 \\0 \text { otherwise }\end{array}\right.$
where $S_{i j, k l}^{N}$ represents the relationship between the migration flow from province i to province j and another migration flow from province k to province l, and Sjl (or Sik) is the value of each element in the (n2-n)-by-(n2-n) spatial weight matrix S.
As demonstrated by Tiefelsdorf and Boots (1995), all eigenvalues generated by the aforementioned transformed spatial weight matrix correspond to different Moran’s I coefficients. The ESF was used to capture the NA effect through a linear combination of selected eigenvectors. The mean of the ESF NBRM is given by:
$u_{i j t}=\exp \left(\alpha_{0}+\sum_{m=1}^{M} \alpha_{1 m} \ln X_{i m t}+\sum_{n=1}^{N} \alpha_{2 n} \ln X_{j n t}+\alpha_{3} \ln D_{i j}+\alpha_{4} \ln m_{i j}+\sum_{k=1}^{K} \alpha_{5 k} E_{k}+\sum_{t=2}^{4} \gamma_{t} T_{t}\right)$
where Ximt, Xjnt, Dij, mij, and Tt have the same meaning as in Equation 2, Ek represents the selected subset of eigenvectors, M/N represents the number of origin-related/destination- related variables, and K represents the number of eigenvectors added to the model.
We selected eigenvectors in Equation 6 with two stages (Fischer and Griffith, 2008). First, we only retained candidate eigenvectors with a large and positive value by setting a threshold for the Moran’s I value of each candidate eigenvector divided by the maximum Moran’s I value among all eigenvectors was 0.25. Second, we used stepwise criteria (forward) at the 5% significance level to select suitable eigenvectors from the total candidate eigenvectors. Eventually, ten out of 252 candidate eigenvectors were selected and added to the ESF NBRM of interprovincial older migration. The biased estimation results caused by the NA were modified by the linear combination of the selected eigenvectors. We used the maximum likelihood estimation to estimate the model parameters. In addition, we controlled for the time-fixed effect in the NBRM and ESF NBRM.

3 Changing spatial patterns of older interprovincial migration

3.1 Migration volume

The period 1995-2015 witnessed a change in the volume of older adults in interprovincial migration. Specifically, there were approximately 0.52 million, 0.81 million, 4.75 million, and 1.15 million older migrants in the 1995-2000, 2000-2005, 2005-2010, and 2010-2015 periods, respectively. Due to sampling bias, the migration volume of older adults in the 2010-2015 period was most likely to be underestimated (the 2010 Census, 2015 Survey, and the recently released 2020 Census indicated that the number of migrants whose hukou location was different from their place of usual residence in 2015 was substantially smaller than that in 2010 and 2020, suggesting that the migration volume derived from the 2015 survey was underestimated). Among the three regions, the eastern region was the only one with a net gain of older migrants during the four periods, while both the central and western regions suffered a net loss of older adults.
Table 2 shows the top five provinces that led the number of in-migration or out-migration of older adults among the country in the 1995-2000, 2000-2005, 2005-2010, and 2010-2015 periods, respectively. Guangdong led the country in terms of the in-migration of older adults in the four periods during 1995-2015. In 1995-2000, Guangdong received 60,200 older adults who migrated from other provinces, accounting for 11.6% of the country’s total in-migration of older adults. The relative attraction for older adults in the country has increased since 2000. In 2010-2015, Guangdong absorbed 17.5% of the total in-migration of older adults. As the most economically prosperous provinces, Beijing, Shanghai, and Jiangsu have been among the top five provinces with the largest inflow of older adults during 1995-2015. Zhejiang absorbed the third largest in-migration of older adults in 2005-2010, and its rank dropped to fifth in 2010-2015.
Table 2 Top 5 provinces of in-migration and out-migration of older adults in China, 1995-2015
1995-2000 2000-2005
In Out In Out
Guangdong 60200 Heilongjiang 49346 Guangdong 108899 Heilongjiang 90739
Beijing 44889 Sichuan 48360 Tianjin 75012 Sichuan 70986
Shandong 43278 Anhui 30192 Shanghai 70727 Anhui 57507
Jiangsu 42652 Jiangxi 28313 Jiangsu 66339 Shandong 53416
Shanghai 39753 Hebei 26564 Beijing 64453 Henan 47508
2005-2010 2010-2015
In Out In Out
Guangdong 667354 Sichuan 441041 Guangdong 201564 Sichuan 125536
Shanghai 558934 Heilongjiang 424201 Beijing 157672 Henan 93296
Zhejiang 499986 Anhui 358934 Jiangsu 111183 Heilongjiang 89813
Beijing 486301 Hunan 333673 Shanghai 102896 Hebei 80023
Jiangsu 322094 Henan 303145 Zhejiang 62677 Anhui 78891
Heilongjiang had the largest number of older out-migration during 1995-2005, while Sichuan contributed the most to the outflow of the older population during 2005-2015. In 1995-2000, approximately 49,300 older adults in Heilongjiang migrated to other provinces, accounting for 9.5% of the total out-migration of older adults. This number increased to approximately 90,700 and the proportion increased to 11.2% in 2000-2005. However, the proportion of older out-migration of Heilongjiang among the nation is decreasing since 2005. For Sichuan, the proportion of loss of older adult population went from 9.3% in 1995-2000 to 10.9% in 2010-2015. Anhui, Henan, and Hebei were among the top five provinces with the largest out-migration of older adults during 1995-2015.

3.2 Migration efficiency

The migration efficiency of a province is defined as the ratio of net migration to total in-migration and out-migration in the province. Figure 2 presents the migration efficiency of 30 provinces in China during the 1995-2000, 2000-2005, 2005-2010, and 2010-2015 peri ods. In 1995-2000, all eastern-region provinces displayed positive efficiency. Guangdong and Beijing led the country with the highest migration efficiency (with efficiency scores of 96.6% and 75.7%, respectively). The other three provinces, Fujian, Shanghai, and Shandong had positive migration efficiency of older adults (over 30.0%). In contrast, all central-region provinces and most western-region provinces, such as Qinghai, Gansu, and Sichuan, exhibited negative migration efficiency in 1995-2000. Jiangxi, Anhui, Henan, and Qinghai had efficiency scores lower than -50.0%, indicating that these four provinces experienced a large outflow of older adults.
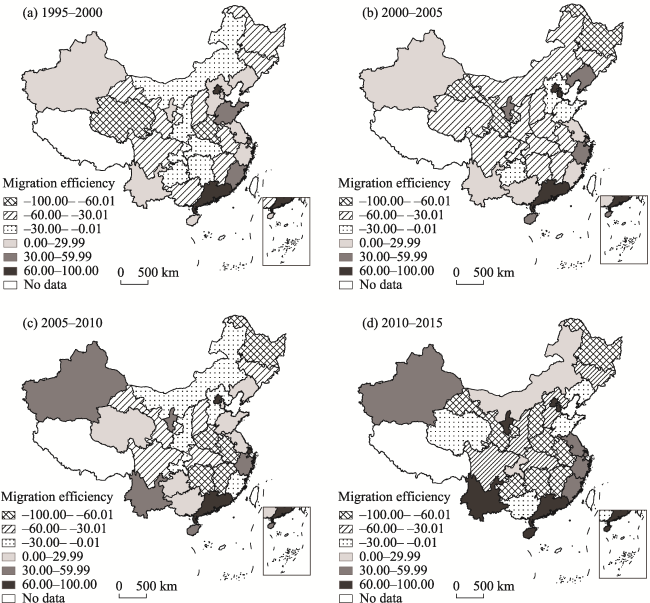
Figure 2 Migration efficiency of older adults in China by province in 1995-2000 (a), 2000-2005 (b), 2005-2010 (c), and 2010-2015 (d)
In the 2000-2005 period, there were more provinces with a positive migration efficiency of over 30.0%, including seven eastern provinces (Tianjin, Beijing, Guangdong, Shanghai, Hainan, Zhejiang, and Liaoning) and Ningxia. Two eastern-region provinces, Hebei and Shandong, were found to have negative efficiency. All central-region provinces and most western-region provinces still had a negative migration efficiency, which implied that these provinces had a net loss in the population of older adults.
In the 2005-2010 period, Xinjiang and Yunnan initially displayed a positive migration efficiency of over 30.0%. As the three largest provinces that led the national economy, Beijing, Shanghai, and Guangdong were the most prominent gainers of older adult migrants (with migration efficiency scored over 60.0%). Compared to the prior two periods, there were more provinces with an efficiency lower than -50.0% (Hubei, Jilin, Anhui, Jiangxi, Heilongjiang, Henan, and Hunan).
From 2010 to 2015, there were 11 provinces with a positive migration efficiency higher than 30.0%. Ningxia, Beijing, Guangdong, Hainan, Tianjin, and Yunnan were found to have an efficiency score higher than 60.0%. In contrast, nine provinces displayed a migration efficiency score below -50.0%. In summary, both provinces with a considerable net gain of older migrants and provinces with a considerable net loss of older migrants grew considerably in number from 1995 to 2015.

3.3 Spatial patterns of primary migration flows

The 25 largest interprovincial migration flows of older adults in 1995-2000, 2000-2005, 2005-2010, and 2010-2015 are mapped in Figure 3. In the four periods from 1995 to 2015, the 25 largest interprovincial older migration flows accounted for 37.6%, 36.4%, 37.4%, and 38.4% of the total older migration volume across the country. Migration streams have become larger and more concentrated during the 1995-2015 period.
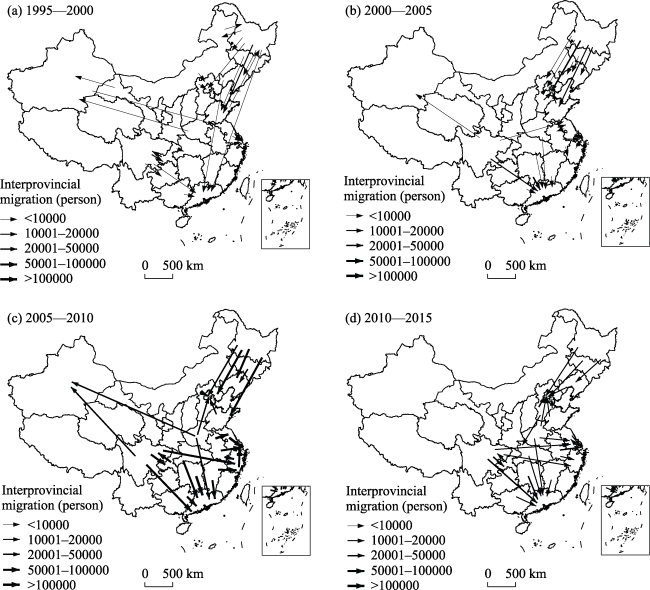
Figure 3 The 25 largest interprovincial migration flows of older adults in China in 1995-2000 (a), 2000-2005 (b), 2005-2010 (c), and 2010-2015 (d)
From 1995 to 2000, migration streams were relatively small and dispersed. The migration flows had hardly more than 10,000 older migrants. The largest migration flows tended to be concentrated in a few destinations, including Guangdong, Beijing, and Shanghai. Guangdong, which received older adults primarily from Heilongjiang, Liaoning, Sichuan, and Guangxi. Guangdong has become an increasingly attractive destination for older adults in South and Southeast China over time. Beijing became an attractive destination for older migrants from Northeast China. Shanghai constantly attracted a substantial number of older migrants from neighbouring provinces, such as Jiangsu, Anhui, and Zhejiang. Zhejiang has become a major destination province for older adults in Sichuan and Anhui since the period 2005-2010.
In the 1995-2000 period, there were some prominent long-distance migration streams. For example, more than 6000 older adults migrated from Heilongjiang to Guangdong, and more than 7000 older adults moved from Henan to Xinjiang. The proportion of short-distance large migration flows increased over later periods. In 1995-2000, the largest migration flows of older adults were bilateral, including Heilongjiang-Inner Mongolia, Sichuan-Chongqing, and Heilongjiang-Shandong. In later periods, the largest migration flows of older adults were mostly unilateral.

4 The results of migration models

Table 3 illustrates the estimation results for NBRM and ESF NBRM. Using stepwise criteria (forward) at the 5% significance level, ten out of 252 candidate eigenvectors were added to the ESF NBRM. The AIC and BIC statistics decrease when eigenvectors are included, suggesting that the ESF NBRM has a significant improvement in model fit. The results of the likelihood ratio tests confirm that the ESF NBRM has a better model fit than the NBRM. The Moran’s I values of residual migration flows in the period 1995-2015 for NBRM and ESF NBRM were 0.215 and 0.197, respectively. This indicated that the migration flows of older adults were not independent of each other; further adding spatial filtering substantially decreased the spatial autocorrelation of residual migration flows. In this section, we only interpret the coefficients of ESF NBRM, given that ESF NBRM was superior to NBRM in terms of model fitting and the ability to address network autocorrelation.
Table 3 NBRM and ESF NBRM on driving forces for interprovincial migration of older adults in China, 1995-2015
Dependent variable NBRM ESF NBRM
Estimate z value Estimate z value
POPi 0.418*** 6.140 0.494*** 6.670
POPj 0.014 0.220 0.072 1.060
DISTij -0.665*** -12.410 -0.686*** -11.190
RCONSi -1.009*** -3.490 -0.978*** -3.170
RCONSj -0.031 -0.120 0.486* 1.740
UCONSi 0.407 1.000 0.325 0.790
UCONSj 2.084*** 5.750 1.935*** 5.280
TEMPi 0.509** 2.590 0.790*** 3.670
TEMPj 0.025 0.150 0.105 0.570
BEDi 0.573** 2.590 0.513** 2.230
BEDj 0.010 0.050 -0.293 -1.500
MIGij 0.166*** 13.930 0.155*** 12.790
year2 0.108 0.660 0.062 0.380
year3 -0.352 -1.280 -0.533* -1.840
year4 -2.236*** -5.790 -2.636*** -6.170
Constant -24.509*** -7.260 -29.450*** -8.080
Eigenvectors 10
MC of residual migration flows 0.215*** 23.373 0.197*** 21.530
N 3480 3480
Log likelihood -8391.829 -8346.159
AIC 16815.660 16744.320
BIC 16908.480 16895.160

Notes: ***, **, and * denote statistical significance at the 1%, 5%, and 10% levels, respectively. The variables of year2, year3, year4 denote the periods of 2000-2005, 2005-2010, and 2010-2015, respectively. NBRM, negative binomial regression model; ESF, eigenvector spatial filtering; MC, Moran’s I coefficient; AIC, Akaike information criterion; BIC, Bayesian information criterion.

The size of the older population at the origin (POPi) had a significant and positive effect on the volume of migration of older adults. Specifically, 1-% increase in the size of the older population in the origin province increased the out-migration flow of older adults by 100×[|1.010.494-1|]=0.493%. As expected, minimum travel time by rail between origin and destination province (DIST) was negatively linked to the migration flow of the older generation. A 1% increase in minimum travel time by rail decreased the expected number of older migrants by 100×[|1.01-0.686-1|]=0.680%.
As for the four variables related to the cost-of-living, the coefficient of RCONSi was negative and significant, while the coefficients of RCONSj and UCONSj were positive and significant. This indicated that older adults tended to migrate from rural areas with lower cost-of-living and were likely to migrate to rural and urban areas with higher cost-of-living. Specifically, a 1% increase in rural per capita consumption expenditure in the origin province decreased the size of out-flow of older adults by 100×[|1.01-0.978-1|]=0.968%, and a 1% increase in rural per capita consumption expenditure at the origin increased the size of older in-migrants by 100×[|1.010.486-1|]=0.485%, while a 1% increase in per capita consumption expenditure of urban residents at the destination increased the expected number of older in-migrants by 100×[|1.011.935-1|]=1.944%. However, the coefficient of UCONSi was not statistically significant. Regarding the two variables related to climatic amenities, temperature variation between January and July at the origin (TEMPi) had an expectedly positive sign, while temperature variation at the destination (TEMPj) was not significantly related to the volume of migration. Inconsistent with our expectations, the coefficient of BEDi was significantly positive, and the coefficient of BEDj was not statistically significant. This is probably because Chinese older adults used little account of medical amenities when making their migration decisions.
As expected, the coefficient of MIGij was significantly positive, implying that the older generation had a higher possibility of migrating with their grandchildren. A 1% increase in the number of migrants aged below 16 would increase the expected number of older migrants by 100×[|1.010.155-1|]=0.154%. In addition, we controlled three dummy variables denoting the period of time, finding that the volume of migration decreased over time.
Table 4 showed the changes in driving forces of interprovincial migration of older adults in China over the period 1995-2015. Urban per capita consumption expenditure had a negative effect on older adults’ out-migration in the period 1995-2000 but a positive effect on out-migration of older adults in the period 2000-2010. Cost-of-living in urban areas had boosted the in-migration of older adults in the period 1995-2015 and this effect increased over time. Specifically, a 1% increase in urban per capita consumption expenditure at the destination increased the expected number of older in-migrants by 5.247% in the period 2010-2015, which reached the strongest pull effect over the entire 20-year period. The effect of temperature variation on older adults’ migration was not quite significant in the period 1995-2000. However, extreme temperature variation promoted older adults’ out-migration, and mild temperature variation was an important factor that influence in-migrants in the 21st century. The influence of medical services on the migration of older adults showed a fluctuating trend. Additionally, the location of grandchildren matters the most for the period 2005-2010.
Table 4 ESF NBRM on the evolution of driving forces for interprovincial migration of older adults in China, 1995-2015
-
Estimate
*year2
Estimate
*year3
Estimate
*year4
Estimate
RCONSi -0.796 -1.029 -0.112 -0.001
RCONSj 0.313 0.103 0.803 -1.218
UCONSi -1.420* 3.809*** 1.744* 1.513
UCONSj 2.204*** -0.524 -0.221 3.043***
TEMPi -0.178 1.357*** 0.959* 1.699***
TEMPj 1.034** -1.257*** -1.840*** -1.563***
BEDi 1.654*** -1.898*** -0.548 -1.305*
BEDj -0.031 0.456 0.904* -1.183
MIGij 0.139*** 0.023 0.062** -0.020
Constant -22.361***
Other control variables Have been controlled
Eigenvectors 10
N 3480
Log likelihood -8261.423
AIC 16628.850
BIC 16936.320

Notes: ***, **, and * denote statistical significance at the 1%, 5%, and 10% levels, respectively. The variables of year2, year3, year4 denote the periods of 2000-2005, 2005-2010, and 2010-2015, respectively. NBRM, negative binomial regression model; ESF, eigenvector spatial filtering; MC, Moran’s I coefficient; AIC, Akaike information criterion; BIC, Bayesian information criterion.

5 Conclusion and discussion

5.1 Conclusion

Using four waves of data derived from China’s population censuses and 1% population sample surveys, this study is pioneering in examining the spatial patterns of interprovincial migration flows of older adults and their drivers in China over the period 1995-2015. Results from the descriptive analysis showed that older migrants tended to migrate from the western and central provinces to eastern-region provinces in China. Guangdong, Beijing, and Shanghai were the most attractive destinations for older migrants, and the southeast coastal provinces experienced a net gain of older migrants. Over time, the migration streams of older adults have become more concentrated in a few destinations, and short-distance and unilateral migration have become more prominent. Results from the ESF NBRM indicated that older adults tend to migrate away from low cost-of-living rural areas to high cost-of-living urban areas, and they tend to move from areas with extreme temperature differences. The location of grandchildren is among the most important attractions.

5.2 Discussion

Our findings indicate that the migration streams of older adults have become more concentrated in a few destinations such as Beijing, Shanghai, and Guangdong, and short-distance and unilateral migration have become more prominent over time. One reasonable explanation is that young people have less and less time to take care of their families and children because of the fast pace of life in modern society, so there is an urgent need for older adults to provide care to their grandchildren. Another possible reason is that large cities have better quality of senior care services and medical facilities, thus older adults migrate for pursuing better amenities. In addition, older adults might migrate away from northeast China for more comfortable weather. With the increasing number of older migrants to large cities, there are some challenges brought to the migration destination, such as increasing financial burden and demand for medical services. However, there are also some beneficial effects, such as providing economic opportunities for aged care.
Our findings suggest that the spatial pattern of migration of older adults in China to some extent resembles that of older migrants in developed countries such as the United States and South Korea. Such similarities are associated with exodus from areas with extreme weather differences and the importance of the location of grandchildren (Clark et al., 1996; Liaw et al., 2002; Walters, 2002; Park and Kim, 2015). Regarding temperature severity, in line with the findings in the United States, empirical evidence in China shows that older people tend to migrate away from regions with extreme weather. This suggests that ‘the phenomenon of snowbirds’ found in several coastal cities in South China is likely to be prevalent all over the country as an increasing number of older adults tend to pursue better quality of life by migrating to areas with favourable weather (Kou et al., 2018; Chen and Wang, 2020; Chen and Bao, 2021). The rise of amenity-led migration in China echoes theories of the three-stage developmental model and the spatial equilibrium model of migration.
Regarding the theory of the ‘modified extended family’, our findings verify the assumption that the location of grandchildren is important for the locational decisions of older people in the Chinese context. Evidence from the United States shows that, in the system of a ‘modified extended family’, older people tend to move near their adult children for better access to care and affection provided by their children (Liaw et al., 2002). This is also likely to be the case in China, where a growing number of adult children leave their parents for education or career advancement. However, compared to their counterparts in the United States, grandparents in China place more emphasis on collective family interests (instead of individual interests) and are more willing to provide care to their grandchildren. In doing so, they maximise the well-being of the extended family by relieving their adult children’s burden and enabling them to pursue career opportunities (Chen et al., 2011; Sun, 2013). Therefore, we observe that the migration direction of older people is highly consistent with the migration direction of grandchildren in China, although inter-generational care relationships are different between China and western countries.
Our findings show that cost-of-living matters to the migration decisions of older adults in China. Evidence from Western countries has indicated that older people usually move away from high cost-of-living regions to low cost-of-living regions after retirement (Walters, 2002; Whisler et al., 2008). This scenario is in line with the spatial equilibrium model of migration. However, our model results suggest that the situation in China is more complex, and the most prosperous cities in China, including Beijing, Shanghai, Guangzhou, and Shenzhen, act as ‘escalator regions’ that attract young adults as well as their parents through internal migration. Different from those who are close to retirement moving away from the rest of the country to the ‘escalator regions’ of the United Kingdoms, older adults in China tend to migrate away from small-city, small-town and rural areas with a lower cost-of-living to (national or regional) ‘escalator regions’ with a higher cost-of-living, probably because most of them relocate close to their adult children to provide care to their grandchildren and receive care from their adult children (‘trailing parents’) (Liu, 2014; Dou and Liu, 2017). In this case, the cost-of-living is an indicator of economic opportunities for adult children and the quality of senior care services.
The findings of our study have some policy implications. First, as older migrants become more concentrated in a few destinations, particularly Guangdong, Beijing, and Shanghai, measures should be taken to enable their full access to basic public services in host cities. For instance, reforms in basic medical insurance scheme are needed to make the reimbursement for medical expenses in host cities more convenient. Another example is that government-subsidised aged care facilities should be available to all older people, regardless of their hukou location. Second, more public expenditure is advised to spend on aged-care public services in urban and rural neighbourhoods to improve the quality of life of older people. Third, local authorities are advised to facilitate older migrants to integrate into the host society through various measures. For example, residents’ committees could encourage older migrants to participate in public affairs and voluntary activities within their neighbourhoods, through which they could build social ties with locals and cultivate the sense of belonging. Fourth, as many older migrants move to large cities for the sake of providing care to their grandchildren, governments of host cities are advised to provide a certain amount of housing subsidy and social benefits to these care providers.
The current study has several limitations. First, this study failed to investigate how migration decision-making varies by individual characteristics such as sex, income, health condition, and marital status. As indicated by Litwak and Longino’s (1987) three-stage developmental framework and other modified frameworks, the spatial pattern of older migration changes with age, health decline, and family dissolution. Second, some factors that may influence the volume of older migration (for example, the location of adult children and crime rates) are not included in our analysis because of data unavailability. Third, we cannot infer a causal relationship between migration volume and regional factors using the current data and methods. For example, the influx of older people into a particular place may lead to a housing market boom and a shortage of medical services, which may inhibit the continuing influx of older migrants. More advanced methods are required to address the problem of reverse causality.

Acknowledgements

The authors would like to thank Yongxin Chen, Jinyan Xie, and Muzhe Pan for their assistance in data collection.
[1]
Chan K W, Buckingham W, 2008. Is China abolishing the hukou system? The China Quarterly, 195: 582-606.

DOI

[2]
Chen F, Liu G, Mair C A, 2011. Intergenerational ties in context: Grandparents caring for grandchildren in China. Social Forces, 90(2): 571-594.

PMID

[3]
Chen J, Bao J, 2021. Chinese ‘snowbirds’ in tropical Sanya: Retirement migration and the production of translocal families. Journal of Ethnic and Migration Studies, 47(12): 2760-2777.

DOI

[4]
Chen J, Wang B, 2020. “Unattended” retirement: Lifestyle migration and precarity of the Houniao. Population, Space and Place, 26(8): e2369.

[5]
Chun Y, 2008. Modeling network autocorrelation within migration flows by eigenvector spatial filtering. Journal of Geographical Systems, 10(4): 317-344.

DOI

[6]
Chun Y, Griffith D A, 2011. Modeling network autocorrelation in space-time migration flow data: An eigenvector spatial filtering approach. Annals of the Association of American Geographers, 101(3): 523-536.

DOI

[7]
Clark D E, Knapp T A, White N E, 1996. Personal and location-specific characteristics and elderly interstate migration. Growth and Change, 27(3): 327-351.

PMID

[8]
Conway K S, Rork J C, 2011. The changing roles of disability, veteran, and socioeconomic status in elderly interstate migration. Research on Aging, 33(3): 256-285.

DOI

[9]
Conway K S, Rork J C, 2016. How has elderly migration changed in the twenty-first century? What the data can—and cannot—tell us. Demography, 53(4): 1011-1025.

DOI PMID

[10]
Cui C, Wang Y, Wang Q, 2022. The interregional migration of human capital: The case of “First-Class” university graduates in China. Applied Spatial Analysis and Policy, 15(2): 397-419.

DOI

[11]
Deng W, Zhang S, Zhou P et al., 2020. Spatiotemporal characteristics of rural labor migration in China: Evidence from the migration stability under new-type urbanization. Chinese Geographical Science, 30(5): 749-764.

DOI

[12]
Dou X, Liu Y, 2017. Elderly migration in China: Types, patterns, and determinants. Journal of Applied Gerontology, 36(6): 751-771.

DOI PMID

[13]
Duncombe W, Robbins M, Wolf D A, 2003. Place characteristics and residential location choice among the retirement-age population. The Journals of Gerontology Series B: Psychological Sciences and Social Sciences, 58(4): S244-S252.

[14]
Fan C C, 2007. China on the Move:Migration, the State, and the Household. London and New York: Routledge.

[15]
Fielding A J, 1992. Migration and social mobility: South East England as an escalator region. Regional Studies, 26, 1-15.

PMID

[16]
Fischer M M, Griffith D A, 2008. Modeling spatial autocorrelation in spatial interaction data: An application to patent citation data in the European Union. Journal of Regional Science, 48(5): 969-989.

DOI

[17]
Flowerdew R, Aitkin M, 1982. A method of fitting the gravity model based on the Poisson distribution. Journal of Regional Science, 22(2): 191-202.

PMID

[18]
Frey W H, Liaw K L, Lin G, 2000. State magnets for different elderly migrant types in the United States. International Journal of Population Geography, 6(1): 21-44.

DOI

[19]
Gao S, Cheng Y, 2018. Willingness to relocation of the older people within Beijing. Geographical Research, 37(1): 119-132. (in Chinese)

DOI

[20]
Golant S M, 1990. Post-1980 regional migration patterns of the US elderly population. Journal of Gerontology, 45(4): S135-S140.

[21]
Graves P E, Mueser P R, 1993. The role of equilibrium and disequilibrium in modeling regional growth and decline: A critical reassessment. Journal of Regional Science, 33: 69-84.

PMID

[22]
Gu H, Jie Y, Li Z et al., 2021. What drives migrants to settle in Chinese cities: A panel data analysis. Applied Spatial Analysis and Policy, 14: 297-314.

DOI

[23]
Gu H, Liu Z, Shen T et al., 2019. Modelling interprovincial migration in China from 1995 to 2015 based on an eigenvector spatial filtering negative binomial model. Population, Space and Place, 25(8): e2253.

[24]
Gu H, Rowe F, Liu Y et al., 2021. Geography of talent in China during 2000-2015: An eigenvector spatial filtering negative binomial approach. Chinese Geographical Science, 31(2): 297-312.

DOI

[25]
Gu H, Shen T, 2021. Modelling skilled and less-skilled internal migrations in China, 2010-2015: Application of an eigenvector spatial filtering hurdle gravity approach. Population, Space and Place, 27(6): e2439.

[26]
Holecki T, Rogalska A, Sobczyk K et al., 2020. Global elderly migrations and their impact on health care systems. Frontiers in Public Health, 8: 386.

DOI PMID

[27]
Huang X, He D, Liu Y et al., 2021. The effects of health on the settlement intention of rural-urban migrants: Evidence from eight Chinese cities. Applied Spatial Analysis and Policy, 14(1): 31-49.

DOI

[28]
Huang X, Liu Y, Xue D et al., 2018. The effects of social ties on rural-urban migrants’ intention to settle in cities in China. Cities, 83: 203-212.

DOI

[29]
Kou L, Xu H, Kwan M P, 2018. Seasonal mobility and well-being of older people: The case of ‘Snowbirds’ to Sanya, China. Health & Place, 54: 155-163.

[30]
Li H, Wang Y, Han J, 2012. Origin distribution patterns and floating population modeling: Yiwu City as a destination. Chinese Geographical Science, 22(3): 367-380.

DOI

[31]
Liang Z, 2016. China's great migration and the prospects of a more integrated society. Annual Review of Sociology, 42: 451-471.

DOI

[32]
Liaw K L, Frey W H, Lin J P, 2002. Location of adult children as an attraction for black and white elderly primary migrants in the United States. Environment and Planning A, 34(2): 191-216.

DOI

[33]
Lin G, 1999. Assessing changes in interstate migration patterns of the United States elderly population, 1965-1990. International Journal of Population Geography, 5(6): 411-424.

DOI

[34]
Litwak E, Longino Jr C F, 1987. Migration patterns among the elderly: A developmental perspective. The Gerontologist, 27(3): 266-272.

DOI

[35]
Liu J, 2014. Ageing, migration and familial support in rural China. Geoforum, 51: 305-312.

DOI

[36]
Liu Y, Shen J, 2014a. Jobs or amenities? Location choices of interprovincial skilled migrants in China, 2000-2005. Population Space and Place, 20(7): 592-605.

DOI

[37]
Liu Y, Shen J, 2014b. Spatial patterns and determinants of skilled internal migration in China, 2000-2005. Papers in Regional Science, 93(4): 749-771.

DOI

[38]
Liu Y, Shen J, 2017. Modelling skilled and less-skilled interregional migrations in China, 2000-2005. Population Space and Place, 23(4): e2027.

DOI

[39]
Liu T, Qi Y, Cao G et al., 2015. Spatial patterns, driving forces, and urbanization effects of China’s internal migration: County-level analysis based on the 2000 and 2010 censuses. Journal of Geographical Sciences, 25(2): 236-256.

DOI

[40]
Longino C F, 1982. Changing aged nonmetropolitan migration patterns, 1955 to 1960 and 1965 to 1970. Journal of Gerontology, 37(2): 228-234.

DOI

[41]
Park J, Kim K, 2015. Internal migration of the elderly in Korea: A multilevel logit analysis of their migration decision. Asian and Pacific Migration Journal, 24(2): 187-212.

DOI

[42]
Pellegrini P A, Fotheringham A S, 2002. Modelling spatial choice: A review and synthesis in a migration context. Progress in Human Geography, 26(4): 487-510.

DOI

[43]
Pu Y, Han X, Chi G et al., 2019. The impact of spatial spillovers on interprovincial migration in China, 2005-10. Regional Studies, 53(8): 1125-1136.

DOI

[44]
Pytel S, Rahmonov O, 2019. Migration processes and the underlying reasons: A study on pensioner migrants in Poland. Population Space and Place, 25(3): e2197.

DOI

[45]
Schaffar A, Dimou M, Mouhoud E M, 2019. The determinants of elderly migration in France. Papers in Regional Science, 98(2): 951-972.

DOI

[46]
Shen J, 2012. Changing patterns and determinants of interprovincial migration in China 1985-2000. Population Space and Place, 18(3): 384-402.

DOI

[47]
Shen J, 2015. Explaining interregional migration changes in China, 1985-2000, using a decomposition approach. Regional Studies, 49(7): 1176-1192.

DOI

[48]
Shen J, 2016. Error analysis of regional migration modeling. Annals of the American Association of Geographers, 106(6): 1253-1267.

DOI

[49]
Stockdale A, MacLeod M, 2013. Pre-retirement age migration to remote rural areas. Journal of Rural Studies, 32: 80-92.

DOI

[50]
Stouffer S A, 1960. Intervening opportunities and competing migrants. Journal of Regional Science, 2(1): 1-26.

[51]
Sun J, 2013. Chinese older adults taking care of grandchildren: Practices and policies for productive aging. Ageing International, 38(1): 58-70.

DOI

[52]
Tang S, Feng J, 2015. Cohort differences in the urban settlement intentions of rural migrants: A case study in Jiangsu Province, China. Habitat International, 49: 357-365.

DOI

[53]
Tiefelsdorf M, Boots B, 1995. The exact distribution of Moran's I. Environment and Planning A, 27(6): 985-999.

DOI

[54]
Tiefelsdorf M, Griffith D A, Boots B, 1999. A variance-stabilizing coding scheme for spatial link matrices. Environment and Planning A, 31(1): 165-180.

DOI

[55]
Tobler W R, 1970. A computer movie simulating urban growth in the Detroit region. Economic Geography, 46: 234-240.

DOI

[56]
United Nations Department of Economic and Social Affairs (UNDESA), 2020. World Population Ageing 2019, United Nations.

[57]
Walters W H, 2002. Place characteristics and later-life migration. Research on Aging, 24(2): 243-277.

DOI

[58]
Wang N, Wang H, Du Y et al., 2021. Population migration across the Qinghai-Tibet Plateau: Spatiotemporal patterns and driving factors. Journal of Geographical Sciences, 31(2): 195-214.

DOI

[59]
Wang H, Guo F, Cheng Z, 2015. Discrimination in migrant workers’ welfare entitlements and benefits in urban labour market: Findings from a four-city study in China. Population Space and Place, 21(2): 124-139.

DOI

[60]
Whisler R L, Waldorf B S, Mulligan G F et al., 2008. Quality of life and the migration of the college-educated: A life-course approach. Growth and Change, 39(1): 58-94.

DOI

[61]
Xie S, Wang J, Chen J et al., 2017. The effect of health on urban-settlement intention of rural-urban migrants in China. Health & Place, 47: 1-11.

[62]
Yang Z, Cai J, Qi W et al., 2017. The influence of income, lifestyle, and green spaces on interregional migration: Policy implications for China. Population, Space and Place, 23(2): e1996.

DOI

[63]
Zaiceva A, 2014. The impact of aging on the scale of migration. IZA World of Labor.

Outlines

/