Research Articles

An empirical study of the registered population transformation in China’s megacities

  • YE Chao , 1 ,
  • YANG Dongyang 2 ,
  • ZHAO Jiangnan 1
Expand
  • 1. College of Geographic Sciences, East China Normal University, Center for Modern Chinese City Studies, Shanghai 200241, China
  • 2. Key Research Institute of Yellow River Civilization and Sustainable Development, Henan University, Kaifeng 475001, Henan, China

Ye Chao (1978-), Professor and doctoral supervisor, with a specialty in urbanization and urban-rural governance, geographic ideas and methods, cultural geography, and sustainable science. E-mail:

Received date: 2022-03-18

  Accepted date: 2022-05-21

  Online published: 2022-12-25

Supported by

National Social Science Foundation of China(19ZDA086)

Abstract

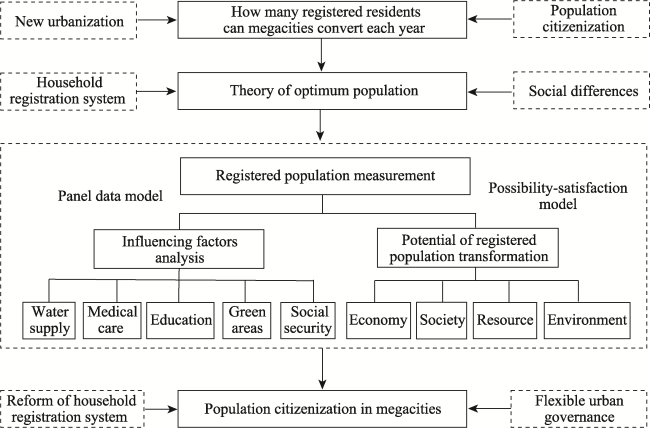
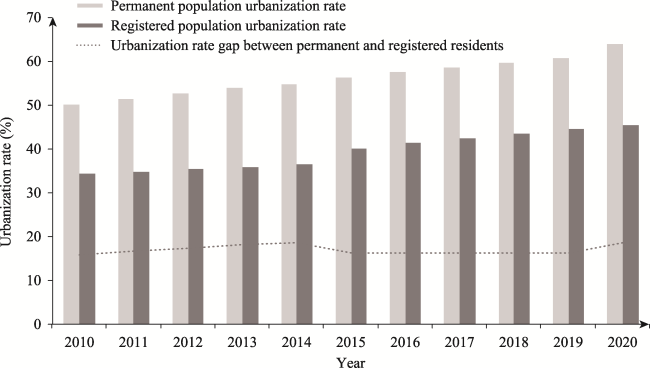
From 2020 to 2030, accelerating the “citizenization” of the migrant population is key to promoting urbanization and achieving common prosperity. The urbanization rate of the registered population in China is roughly 18% lower than that of permanent residents. The pressure of the ageing population and the lack of a labor force have caused big cities to introduce relevant policies to attract talent, and the citizenization process needs to be improved urgently, with a particular focus on megacities. The transformation in the number of registered residents in megacities varies greatly, and there is a lack of research on this topic, which makes it an important academic issue. Using both natural and social perspectives, we selected concise indicators and combined the possibility-satisfiability model to estimate the urbanization transformation gap of annual household registration. Further, we constructed a panel data model to empirically analyze the different factors leading to the gap of household registration in megacities. The main factors affecting the transformation of the registered population in megacities are medical services, as well as educational resources and the urban water supply. It is urgent for urban and rural administrators to change the current passive and rigid institutional mechanisms and to ensure flexible, normal governance.

Cite this article

YE Chao , YANG Dongyang , ZHAO Jiangnan . An empirical study of the registered population transformation in China’s megacities[J]. Journal of Geographical Sciences, 2022 , 32(12) : 2525 -2540 . DOI: 10.1007/s11442-022-2059-5

1 Introduction

Urbanization, “citizenization,” and common prosperity are closely related. The Fifth Plenary Session of the 19th Central Committee of the Communist Party of China in 2020 proposed for the first time that “more obvious and substantive progress should be made in achieving common prosperity for all people.” To meet this goal, we need to place people at the core in terms of fundamental values. As for spatial patterns, we need to optimize the spatial layout of land and promote regional coordinated development by continuing to deepen national strategies, such as new urbanization and rural revitalization. High-quality, sustainable development of urbanization is key to attaining common prosperity, and the success of urbanization depends on the citizenization of the migrant population. According to data from the National Bureau of Statistics, the urbanization rate of China’s permanent population in 2020 was 63.89%, but the urbanization rate of the registered population was only 45.40%, with a gap of 18.49%, reflecting the slow process of citizenization. Urbanization does not simply entail improving the expansion of the urbanization rate and scale, but also enhancing the welfare of the entire society.
The citizenization of the migrant population in megacities not only promotes regional growth, but is also the aim of national governance modernization. In 2019, the Chinese government released a document to completely remove the hukou limit for cities with less than 3 million permanent urban residents, so the focus of the future citizenization process will be on megacities. According to the data of the seventh national census, there are seven mega cities in China with a permanent resident population of more than 10 million in urban areas, namely, Beijing, Shanghai, Shenzhen, Chongqing, Guangzhou, Chengdu, and Tianjin. Combined with the expansion of urban agglomerations and the general recognition of society, the four megacities of Beijing, Shanghai, Guangzhou, and Shenzhen are not only the focus of urban governance, but also essential to regional and national development. The citizenization process of megacities is somewhat complex, with strong mobility and great difficulty in governance. The registered population of each city varies greatly from year to year. Under the concept of people-centered growth, megacities must value social equity and social integration to achieve effective governance. Therefore, to contribute to urbanization research and practice, this paper: (1) is centered on the four megacities of Beijing, Shanghai, Guangzhou, and Shenzhen; (2) empirically analyzes the transformation of their registered population and relevant influencing factors; and (3) discusses the issues facing new urbanization, citizenization, and urban governance.
The key to citizenization lies in institutional reform. Urbanization is both a natural and social process with “people” at its core. Urbanization is not only a process, but also entails “absorbing” the migrant population, “transforming” the registered population, and “solving” urban governance problems. With an aging Chinese society and a shortage of human resources, cities are scrambling to issue policies to draw talented professionals, with an increasing number of second-tier cities joining the competition starting in 2015. By contrast, megacities have superior resources and conditions, but the registered population they have attracted is relatively limited. Compared with the positive trend of second-tier cities, megacities even have a trend of continuous tightening and strict population control. Megacities absorb most of the migrant population from all over the country and play a decisive role in national development.

2 Logical framework, data, and methods

2.1 Logical framework

The relationship among urbanization, urban-rural differences, and the transformation of the registered population is the focus of urbanization research (Chan and Zhang, 1999; Wu and Treiman, 2004; Ye, 2021; Ye et al., 2021). The household registration system has been employed to prevent rural-to-urban migration since the mid to late 1950s in China, and has become the primary means of controlling population flow and determining eligibility for social welfare (Chan, 2010). China’s household registration system resulted in distinct differences in terms of civil, social, and economic rights. To a large extent, it also shaped China’s urban and rural social divisions (Wu, 2011), and generated a significant influence on the acquisition of jobs, education, housing, health equity, and even happiness (Wong and Wai, 1998; Lin and Zhu, 2016; Boffy and Moon, 2018; Yuan et al., 2019; Liu et al., 2020).
The optimum population is the most ideal population size that a region can support under certain conditions; it plays an important role in measuring the balance between population growth and factor allocation (Dasgupta, 1969; Liu, 2016). Numerous studies on the population scale of large cities have been conducted from the perspectives of demography, economics, geography, planning, sociology, and other multidisciplinary fields. In the early stages, the theory of optimum population chiefly considered the relationship between economic factors and population growth, while in the later stages, it took social and ecological factors into account, and morphed from single-factor static analysis to multi-factor dynamic analysis (Pimentel et al., 1994; Renström and Spataro, 2011). In empirical studies, scholars have estimated the optimum population size of cities in the US, Japan, China, and India, among other countries (Pimentel et al., 1998; Zheng, 2007). At present, residual functioning, happiness, the ecological footprint, artificial neural networks, and similar group models are the main methods (Shi et al., 2010; Lianos and Pseiridis, 2016; Lu, 2016; Riiman et al., 2019). In light of the aspects of the household registration system, resource allocation, and social mobility, Chinese scholars have also carried out numerous studies and constructed corresponding models for the economy and the population, as well as evaluation systems (Lu, 2008; Liu et al., 2011; Chen, 2012; Li and Sun, 2014; Wu and Zhang, 2014; Di and Han, 2015; Wang and He, 2017; Wang et al., 2021).
In general, there is a lack of specific research on megacities. Existing literature primarily focuses on population prediction and urban carrying capacity estimation, and lacks in-depth research on practical issues such as how many registered population can be transformed by cities and how to transform. As for research methods, previous research has developed numerous and tedious index systems, which contain great differences in index weight and experience, and reduce practical operations. There is a huge difference in the number of people in the transformation of the registered population in different cities each year. The large difference and its annual variation between the permanent urban population and the registered population means the conversion of migrants in a city into registered residents becomes a fundamental academic and practical issue, but there are few relevant studies in academia pertaining to this. Hence, by synthetically studying the impact of the water supply, local ecology, social security, and education on the registered population gap (the difference between the permanent and registered population), the current study constructed a panel data model to examine the restrictive factors of the registered population gap, estimated the potential conversion capacity of the registered population in megacities by referencing the national standard value or the national average value of each factor, and elaborated on the idea of elastic governance (Figure 1).
Figure 1 Logical framework diagram

2.2 Data

We scrutinized data covering 2001-2018 on the permanent and registered population, the per capita urban water supply, per capita public green zones, the proportion of expenditure for social security and employment in fiscal spending, the number of in-patient beds per 1000 people, the student-teacher ratio in regular secondary schools, the student-teacher ratio in regular primary schools, and data spanning 2019 on economic development, social life, the resources supply, and the ecological environment from the statistical yearbook, statistical bulletins on each city’s national economic and social growth, and the China National Knowledge Infrastructure database. There was a lot of missing data on spending for social security and employment before 2005. Due to the scope of spending for social security and employment—which includes social security subsidies, administrative institution employment subsidies, and pension and social welfare relief—we calculated spending for social security and employment as the total of the above mentioned three types of expenditure. There were also individual missing data that were supplemented based on the annual average growth rate of existing data.

2.3 Methods

2.3.1 Panel data model

To explore the restrictive factors of the registered population gap, we selected the difference value of the permanent and registered population of Beijing, Shanghai, Guangzhou, and Shenzhen as the dependent variable, and we selected the per capita urban water supply (W: m3/person), per capita public green zones (G: m2/person), the proportion of expenditures for social security and employment in fiscal spending (S:%), the number of in-patient beds per 1000 people (B), the student-teacher ratio in regular secondary schools (SS: person), and the student-teacher ratio in regular primary schools (PS: person) in each city as the independent variables. We built the panel data model as follows:
$Y_{i t}=\alpha+\beta_{1} W_{i t}+\beta_{2} G_{i t}+\beta_{3} S_{i t}+\beta_{4} B_{i t}+\beta_{5} S S_{i t}+\beta_{6} P S_{i t}+\varepsilon_{i t}$
where Yit represents the difference value of the permanent and registered population in city i in year t. Wit, Git, Bit, Sit, SSit, and PSit respectively refer to the per capita urban water supply, per capita public green zones, the proportion of expenditures for social security and employment in fiscal spending, the number of in-patient beds per 1000 people, the student-teacher ratio in regular secondary schools, and the student-teacher ratio in regular primary schools in city i in year t.

2.3.2 The measurement method for a moderate population size and the registered population gap

(1) Possibility-satisfiability model
The possibility-satisfaction model is a method for predicting the optimum size of the population, considering the possibility and satisfaction of multiple indicators. Probability and satisfaction mean that related elements have both probability and satisfaction attributes. A combination of the two criteria can describe the degree of both possibility and satisfaction, which can be employed to express the population capacity of satisfying both subjective expectations and objective feasibility, respectively. Usually, the higher the degree of possibility-satisfaction, the smaller the optimum size of a population that the city (the resource environment and basic social security) can accommodate.
Based on previous approaches to predicting the optimum urban population size (Wang et al., 2021), we studied the weak combination of possibility and satisfaction. The formula is:
$\omega(\alpha)=\left\{\begin{array}{cc}\frac{-r_{B}+\alpha s_{B}}{\left(r_{A}-r_{B}\right)-\alpha\left(s_{A}-s_{B}\right)}, & 0<\omega<1 \\1, & \omega \geqslant 1 \\0, & \omega \leqslant 1\end{array}\right.$
where ω represents the degree of possibility-satisfaction; α is the potential optimum size of the population; rA and rB denote the upper and lower limits of the possibility target, respectively; and sA and sB refer to the upper and lower limits of the satisfaction target, respectively.
When ω ranges from 0 to 1, formula (1) can be expressed in the following manner:
$\alpha=\frac{\omega\left(r_{A}-r_{B}\right)+r_{B}}{\omega\left(s_{A}-s_{B}\right)+s_{B}}$
(2) The index system for predicting the optimum size of the population
Referring to relevant research and considering the availability and representativeness of the data, we explored the urban comprehensive carrying capacity from four angles, including economic development, social life, supply of resources, and ecological environment. We chose 12 indicators (Table 1) from the past decade in Shanghai to forecast the optimum size of the population in 2035.
Table 1 Possibility-satisfiability measurement index system
Index type Possibility index Satisfaction index weight
Economic development r1 GDP (108 yuan) s1 GDP per capita (yuan) 0.07
r2 General public budget revenue (108 yuan) s2 Revenue in the general public budget
per capita (10,000 yuan)
0.08
Social life r3 Number of beds in health care facilities (10,000) s3 Number of beds in health care facilities (beds/10,000 people) 0.10
r4 Number of employed people in the population (10,000) s4 Employment rate (%) 0.10
r5 Expenditure for social security and
employment (108 yuan)
s5 Per capita expenditure for social security and employment (10,000 yuan) 0.11
r6 Urban road areas (10,000 m2) s6 Per capita urban road area (m2) 0.06
r7 Number of primary and secondary students s7 Number of primary and secondary
students per 10,000 people
0.07
Resources supply r8 Energy consumption (10,000 tons of standard coal) s8 Per capita energy consumption (tons) 0.07
r9 Urban water supply (10,000 tons) s9 Urban water supply per capita (m3/person) 0.10
Ecological environment r10 Public green zones, parks, green areas (10,000 m2) s10 Per capita public green zones (m2) 0.10
r11 Domestic waste output (10,000 tons) s11 Per capita domestic waste output (tons/person) 0.06
r12 Total wastewater discharge (108 tons) s12 Per capita wastewater discharge
(tons/ person)
0.06

Data source: Shanghai Statistical Yearbook (2010-2019)

We standardized each index using the range standardization of the origin data, and then calculated the weight Wj for each index via the entropy method. Further, the total optimum size of the population can be obtained by the following formula:
$\alpha=\sum_{j=1}^{n} W_{j} \alpha_{j}$
where α is the total optimum size of the population; n is the number of indexes; and αj denotes the optimum size of the population corresponding to index j.
(3) Grey GM (1, 1) model
The Grey GM (1, 1) model is a first-order dynamic model of differential equations with one variable; it is a common method to predict changes in characteristic values of system behavior based on the idea of a grey system. The calculation method is as follows.
Cumulatively add up the raw time series data of population $p^{(0)}=\left\{p^{(0)}(k), k=1,2, \ldots, n\right\}$, produce the new time series p(1):
$p^{(1)}=\left\{p^{(1)}(k), k=1,2, \ldots, n\right\}$
Then, taking the first derivative of formula (4) can lead to the equation:
$\frac{d p^{(1)}}{d t}+\alpha p^{(1)}=\mu$
Calculating parameters α and μ using the least squares method, the time response sequence of differential equations can be obtained:
$\hat{p}^{(1)}(k+1)=\left\{\left[p^{(0)}(1)-\frac{\mu}{\alpha}\right] e^{-\alpha k}+\frac{\mu}{\alpha}\right\}$
Then, perform a reduction, and the formula for population prediction is obtained:
$\hat{p}^{(0)}(k+1)=\hat{p}^{(1)}(k+1)-\hat{p}^{(1)}(k)$

3 The problem of talent competition and the urban household registration gap

Data from the Statistical Bulletin of China’s National Economic and Social Development from 2010 to 2020 show that the urbanization rate of China’s permanent resident population, and the urbanization rate of the registered population, are rising annually. However, the gap remained at 16 percentage points in the past the decade and reached its widest level at 18.49 percentage points in 2020. Compared to 2010, the urbanization rate gap between the permanent resident population and the household population in 2020 increased by 2.71 percentage points, indicating that the process of citizenization still needs to be greatly improved, and the reform of the household registration system is in urgent need of more efforts (Figure 2).
Figure 2 China’s urbanization rate in 2010-2020
According to the seventh population census in China, the country will soon become an aging society. The decline in the number of working-age people between 15 and 64 years has left cities eager to issue talent policies to draw high-quality workers. Since 2015, the scale of the migrant population in China has changed from a continuous rise to a slow decline, but the aggregation of the population has become increasingly apparent (Figure 3). Among cities with a permanent urban population of more than 4 million, Shenzhen, Chengdu, Guangzhou, Jinan, and Xi’an have all seen their population increase by more than 1.5 million in the past five years, while Changchun and Dalian have seen little growth, and Urumqi, Beijing and Shijiazhuang have even witnessed negative population growth. Chengdu, Jinan, Shenzhen, Xi’an, and Guangzhou rank among the top five cities in the increase in the registered population in the past five years, exceeding one million. In contrast, Taiyuan, Dalian, and Changchun have seen slow growth in the registered population, while Harbin, Shijiazhuang and Urumqi have suffered heavy losses. A large number of people gather in first-tier coastal cities, megacities, and central inland cities, resulting in a spatial mismatch between the population and local resources. Central cities, megacities, and urban agglomerations are becoming the main spatial forms carrying elements of development, and the four megacities and their three urban agglomerations are the central areas of agglomeration (Figure 3).
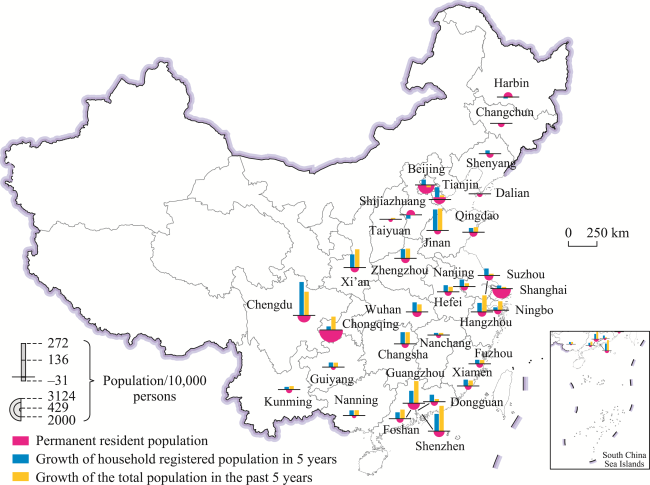
Figure 3 Population increment of cities with a permanent resident population of more than 4 million in China (2015-2020)
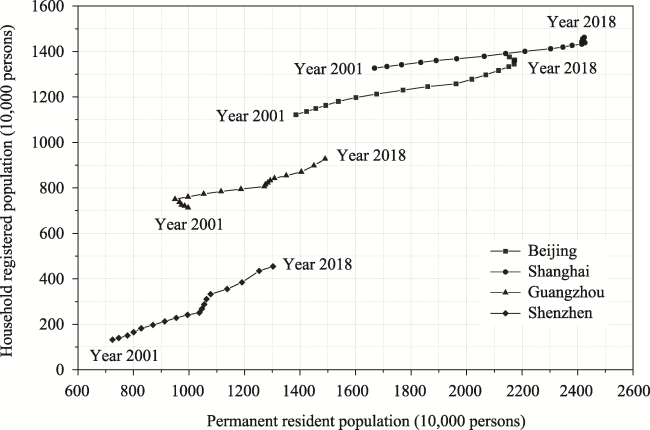
Figure 4 Historical population changes in China’s four megacities (2001-2018)
In terms of time, the first talent policies issued by cities mostly date back to around 2015, while stronger talent policies were mostly concentrated in 2019 and 2020. As for space, the “talent competition” covers a wide range of regions. By the end of 2020, more than 50 cities in China had introduced new settlement and talent policies. Among these cities, there are not only traditional megacities such as Beijing, Shanghai, Guangzhou and Shenzhen, but also emerging megacities such as Chengdu and Chongqing. The joining of many third- and fourth-tier cities also makes the competition more intense. Regarding the objective of a “talent competition,” college students and the youth labor force are the main ones. Hangzhou, Wuhan, Chengdu, and other cities have given large preferential policies to college graduates. When it comes to standards, compared with previous policies that focused on high-level and scarce talent, the “talent competition” lowered the education level.
According to the summary and analysis of talent settlement policies in cities with a population of more than 4 million in municipal districts (Table 2), the basic conditions for urban settlement can be summarized as occupational conditions, qualification-related conditions, housing social security, and investments and entrepreneurship. The threshold of settling down is changing, multidimensional, and reducing. Among the cities with a population of more than 4 million, eight can be settled in with a technical secondary school degree or above. Jinan, Suzhou, Fuzhou, Kunming, Nanchang and Shijiazhuang encourage a “zero threshold for settlement.” Policies to encourage and attract talent can be divided into four categories. Class I policies aim to relax the conditions for settlement and cancel the related age limit and preconditions. Class II policies provide rental subsidies, life security, and entrepreneurship loan for talent. Class III policies reward institutions that introduce talents. Class IV policies provide parents, spouses, and children of talented professionals with preferential treatment in education and medical treatment.
Table 2 Summary of policies for talent in major cities across China
City Talent policy for the
first time
Talent policy with
great effort
Minimum educational
requirements
Policy
Chengdu 2017/07 2019/06 Technical secondary school I
Jinan 2016/06 2020/04 No threshold I
Shenzhen 2010/10 2018/10 Junior college II, III
Xi’an 2017/03 2017/03 Technical secondary school I
Guangzhou 2016/04 2019/01 Undergraduate course I
Changsha 2017/06 2019/09 Technical secondary school II
Tianjin 2018/05 2018/01 Undergraduate course II
Wuhan 2017/10 2019/02 Junior college III
Zhengzhou 2017/07 2020/09 Technical secondary school II
Hangzhou 2015/11 2019/04 Junior college I
Nanjing 2017/07 2020/05 Junior college I
Dongguan 2016/01 2020/09 Junior college II
Suzhou 2016/11 2020/12 No threshold I
Hefei 2015/11 2020/09 Junior college II
Foshan 2017/12 2018/10 Junior college III
Xiamen 2016/02 2018/09 Junior college I, IV
Beijing 2010/04 2018/02 Points system III
Nanning 2011/12 2020/06 Junior college I
Guiyang 2016/12 2019/05 Junior college II
Qingdao 2016/10 2018/06 Junior college II, III
Fuzhou 2013/01 2020/12 No threshold I
Chongqing 2017/04 2017/08 Junior college IV
Shenyang 2017/08 2017/08 Technical secondary school II, IV
Shanghai 2015/09 2020/09 Points system I
Ningbo 2015/08 2018/11 Technical secondary school II, III
Kunming 2014/01 2021/08 No threshold I
Nanchang 2013/06 2020/04 No threshold I
Taiyuan 2017/07 2020/05 Technical secondary school II, IV
Dalian 2015/03 2020/10 Junior college II
Changchun 2017/09 2020/06 Technical secondary school IV
Harbin 2017/02 2020/09 Junior college II
Shijiazhuang 2015/05 2019/03 No threshold I

Source: Sorted according to the talent policy documents of each city

The “talent competition” has made new first- and second-tier cities more attractive to talent. According to the Municipal Statistics Bureau, the registered population of Chengdu increased by 240,200 in 2020, 38.76% more than in 2015. After the talent policy was issued in Jinan, the registered population rose by 1.4084 million in 2019, 34.18 times that of 2015. The registered population of Shenzhen expanded by 926,200 in 2020, 4.07 times that of 2015. The number of permanent residents in Xi’an increased by 784,600 in 2017, 8.46 times more than in 2016, after the city relaxed its policies on settling down for education in technical secondary schools. After further relaxing the hukou policy in 2019, the registered population of Xi’an rose by 9% in 2020 compared with the previous year. From the perspective of talent flow trends, the Yangtze River Delta and the Pearl River Delta are gathering talent, while Beijing, Tianjin, and Hebei are facing the problem of talent outflow. Among second-tier cities, the proportion of net talent inflow in Hangzhou, Nanjing, Chongqing, and Wuhan outlines an upward trend, and the effect of talent attraction policies is remarkable. Although the “talent competition” has absorbed part of the registered population, the registered residence of ordinary manufacturing and service industries is neglected to a certain extent. The citizenization of migrant workers and low-income groups is still a problem.

4 Influencing factors and gap estimation of the transformation of the registered population in megacities

4.1 The influencing factors of the registered population in megacities

Given the potential impact and constraints of water resources, the ecological environment, social security, and educational resources, to construct the panel data model, we selected the per capita urban water supply (W), per capita public green zones (G), the proportion of expenditures for social security and employment in fiscal spending (S), the number of in-patient beds per 1000 people (B), the student-teacher ratio in regular secondary schools (SS), and the student-teacher ratio in regular primary schools (PS) as independent variables. The estimated coefficient is shown in Table 3. The coefficients of W, B, SS, and PS are significantly negative; thus, reducing urban water supply per capita, the number of in-patient beds per 1000 people, and the student-teacher ratio in regular secondary schools and primary schools would widen the registered population gap. This indicates that the urban water supply, as well as medical and educational resources, have a negative impact on the registered population gap. The coefficients of G and S are significantly positive, underlining that the limiting effects of urban green space and social security on the transformation of the registered population is small. In the four megacities (Beijing, Shanghai, Guangzhou, and Shenzhen), both the total resident population and its growth rate are much higher than the registered population during 2001-2018 (Table 4); thus, the registered population gap has been increasing. The per capita urban park green spaces in Beijing and Guangzhou increased significantly; the per capita urban park green spaces in Shanghai increased slightly; and the per capita urban park green spaces in Shenzhen remains quite unchanged. The results of the panel data model showed that the per capita urban park green space has a positive impact on the registered population gap. In fact, in the standards related to urban construction and urban planning, the per capita urban park green space is a statistical index based on the permanent population. Thus, the urban green space factor, represented by per capita urban park green space, has no constraining impact on the registered population, which is much smaller than the permanent one. In terms of social security, the proportion of expenditures for social security and employment in fiscal spending has risen dramatically in the four megacities, while the growth of the permanent population is much higher than that of the registered population. This leads to increasing the registered population gap. Social security has no restrictive effect on the registered population gap in terms of statistical outcomes; this may be related to the fact that social security covers the permanent population in megacities, and some non-registered members of the population enjoy the social security they feel at home.
Table 3 Panel model results
Variable Coefficient Standard error t P
W -2.5817 0.7135 -3.6186 0.0006
G 10.3121 3.4592 2.9811 0.0041
S 15.3851 4.4751 3.4379 0.0011
B -110.3419 23.9490 -4.6074 <0.001
SS -57.4443 9.1218 -6.2975 <0.001
PS -9.5266 3.3418 -2.8508 0.0059
R2 0.8904
Adjusted R2 0.8745
F 83.9713
P <0.001
N 72
Table 4 Parameter estimation results of W, B, SS, and PS
Variable Coefficient Standard error t P
W -1.7703 0.7697 -2.3000 0.0247
B -128.7726 23.4938 -5.4811 <0.001
SS -85.1963 7.0772 -12.0382 <0.001
PS -17.7908 3.0074 -5.9157 <0.001
R2 0.8581
Adjusted R2 0.8427
F 96.8241
P <0.001
N 72
Further, the variables G and S are eliminated in the new panel data model to examine the influencing stability of factors W, B, SS, and PS on the registered population gap. The findings are displayed in Table 4. The coefficients of W, B, SS, and PS are significantly negative, indicating that the urban water supply, medical resources, and secondary and primary education resources denoted by W, B, SS, and PS have stable restrictive effects on the registered population gap. The adjusted R2 is 0.8427, with p<0.001, signaling that the new model also has good explanatory power; the four variables (W, B, SS, and PS) can also better fit the change in the registered population gap.
There is much difference in the urbanization stage; for example, social and economic development levels, resources, the environment and registered population policies in different cities, and the influencing factors of the registered population gap are complex. However, according to the above outcomes, the limiting effects of the urban water supply, medical resources, and primary and secondary education resources on the registered population gap are common in China’s megacities, and medical resources are especially more restrictive. That said, under the joint influence of a variety of factors, the registered population gap and related factors usually have a clear, complex, non-linear relationship. Figure 5 shows the time variation of the registered population gap and the number of secondary and primary school students per 10,000 people from 2001 to 2019 in Shanghai. There is an obvious quadratic relationship between them. In terms of the change trend, with the rise in the number of secondary and primary school students per 10,000 people, the registered population gap presents a non-linear falling trend.
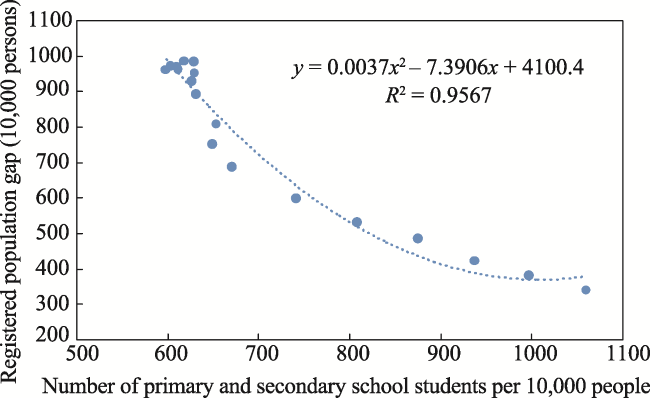
Figure 5 The relationship between the number of people in the registered population gap and the number of primary and secondary school students per 10,000 people in Shanghai
The panel data model is constructed from five aspects, namely (1) the urban water supply; (2) urban green space; (3) social security; (4) medical care; and (5) education. The common and statistically significant outcomes are obtained in four megacities; that is, the urban water supply should be increased, medical care and education resources are conducive to narrowing the gap between the permanent and registered population, and the urbanization of the registered population can be improved. In fact, the influencing factors of the registered population gap in each city are complex; this is not only reflected in the difference in the quantity of resources, but more importantly in the difference in quality, which requires a more in-depth, detailed analysis based on different policy scenarios.

4.2 The potential of the transformation of the registered population in megacities

Given the limiting influences of the above factors on the registered population gap, we gathered the national standard value or the national average of each factor (Table 5) as a reference. Based on the results in Table 3 and the current value of each factor for each city in 2018, and due to the influence of other factors and future changes in factors, we preliminarily estimated the potential transformational capacity of the registered population gap for each megacity. The per capita comprehensive urban water consumption is limited by the total amount of regional and even national water resources. If a city’s per capita comprehensive urban water consumption is lower than the national standard in 2018, there is no room for growth of the registered population, and the corresponding transformation potential of the registered population is 0. If the number of in-patient beds per 1000 people—as well as the student-teacher ratio in secondary and primary schools—is lower than the national standard or average value, the difference between the national standard or average value and the corresponding factor value was taken as its potential growth space, and was used to calculate the transformation potential of the registered population gap corresponding to each factor. If one of the three factors is higher than the national standard or average value, its transformation potential for the corresponding registered population is 0.
Table 5 The national standard or average value of relevant factors and current value (in 2018) of each city
Factors Beijing Shanghai Guangzhou Shenzhen
Per capita comprehensive urban water consumption (m3/person) 95-155(89.13) 200-265(126.03) 160-215(166.48) 160-215(137.79)
Number of in-patient beds per 1000 people 6.03(5.4) 6.03(6.07) 6.03(5.77) 6.03(3.34)
Student-teacher ratio in regular secondary schools 13.5(8) 13.5(10) 13.5(12) 13.5(6)
Student-teacher ratio in primary schools 19(14) 19(14) 19(19) 19(31)

Note: For the number of in-patient beds per 1000 people, 6.03 is the reference value; it is the national average gathered from the “2019 Statistical Bulletin on China’s Health Development,” which was authority-issued by the National Health Commission of China.

Based on the above method, the results of the transformation potential for the registered population gap, corresponding to each factor in each city, were obtained (Table 6). In terms of different factors, the potential transformation space, corresponding to the student-teacher ratio in regular secondary schools is the largest, with a total population of 1533.53×104. Following this is the number of beds per 1000 people; its potential transformation space is 461.01×10⁴ population. The potential transformation space corresponding to per capita comprehensive urban water consumption is the smallest, at 11.47×10⁴ population. In terms of different cities, the potential transformation space of Shenzhen is the largest, with a total population of 985.37 ×10⁴, followed by Beijing (638.66×10⁴ population). The potential transformation space of Guangzhou is the next smallest, with a total population of 172.75×10⁴. The total potential transformation space for the four megacities is 2183.92×104.
Table 6 Potential for the transformation of the registered population corresponding to each factor in the four megacities
Indicators Indicators Beijing Shanghai Guangzhou Total
Per capita comprehensive urban water consumption (m3/person) 0 0 11.47 0 11.47
Number of in-patient beds per 1000 people 81.13 0 33.48 346.40 461.01
Student-teacher ratio in regular secondary schools 468.58 298.19 127.79 638.97 1533.53
Student-teacher ratio in primary schools 88.95 88.95 0 0 177.91
Total 638.66 387.14 172.75 985.37 2183.92
Taking Shanghai as an example, in 2020, the permanent population was 24.8709 million, and the urbanization rate of the permanent population was 89.30%. According to the seventh national census of Shanghai, its registered population is 14.6930 million. Thus, the urbanization rate of its registered population was 59.08%, with a gap of 30.22% compared to the urbanization rate of the permanent population. In referencing the general urbanization rate of 80% in developed countries, we calculated the urbanization gap of the registered population according to the urbanization rate of 80%. Hence, the estimated registered population conversion gap in Shanghai was 4.7664 million. Further, the average number of people who need to undergo registered urbanization transformation during 2019-2035 would be about 20,000, according to the predicted outcomes of possible satisfaction model and the grey GM (1, 1) model.

5 Conclusion and discussion

The citizenization of the migrant population has become key to the high-quality development of urbanization and even the realization of common prosperity. Megacities are related to patterns of regional growth and national governance, which should be paid great attention to. The process of citizenization, which is transformed from the registered residents to the core, involves multiple interests, and is also essential for city governance to benefit people and build up cities (Ye and Yu, 2020). How much of the registered population should be converted, how to convert people, and how to manage the population have become unavoidable practical scientific issues with great significance. Combining natural and social perspectives, we empirically analyzed the factors influencing the transformation of urban household registration in megacities, and we formed a concise index and reliable model. It not only discusses the transformation of the urban household registration population, from a scientific perspective, but also reflects deeper issues of urban governance.
The transformation of the registered population in megacities is influenced by the water supply, medical resources, and education resources, among which medical and education resources have a stronger influence. Specifically, the importance of relevant software resources (medical staff, teachers, community workers, etc.) is higher than that of hardware resources (beds, schools, infrastructure, etc.), indicating that the real obstacles to the citizenization of the migrant population lie in education, health care, employment, and life security. In order to remove the barriers of population transformation, it is necessary to carry out an all-around reform in education, medical care, and social security; to increase the input and welfare of corresponding human resources; and to introduce policies that are favorable to the abovementioned workers.
Under the multiple pressures of aging and a manpower shortage, the super city should— and can—quickly increase the conversion rate of the registered residence population, which is also a manifestation of city vitality and inclusiveness (Chen et al., 2019). In particular, as the four megacities are all “world cities,” it is more necessary to increase inclusiveness and stimulate activity. The citizenization of the migrant population should be promoted, enabling them to enjoy the same urban public services, effectively releasing the consumption capacity of the migrant population for urban services, and encouraging the rapid development of tertiary industries (Chen et al., 2021). The citizenization of the migrant population in mega cities will be the focus of China’s future urban growth. It is not advisable to control or even exclude the population through simple and crude administrative means. On the contrary, megacities can enhance the urban population capacity and realize stable, powerful citizenization by strengthening infrastructure construction and public service capacity (Lu, 2016).
Urban governance needs to change from passive, rigid, and fixed governance to flexible and normalized governance. Population control should not be taken regarding the guidance and content of urban planning. Reducing urban population pressure does not mean reducing or controlling the inflow of the migrant population, but rather implementing human-centered, new urbanization and enhancing the absorption and transformation capacity of cities (Chen and Ye, 2020). In the context of new urbanization, it is imperative to innovate urban governance systems and mechanisms, to comprehensively promote the reform of the citizenization system based on the household registration system, and to stimulate the vitality of megacities. The innovation of governance mode in megacities will also have an important demonstration effect on the entire country and the world. It is only by turning the population and human resources into the basis and driving force for urban and rural governance—rather than as a burden—that people can share in the fruits of development and realize the great concept of a people’s city. Gradually and vigorously promoting citizenization through innovation in urban governance not only entails the implementation of people’s new urbanization, but also the main path to common prosperity.
[1]
Boffy R E, Moon S, 2018. The role of China’s household registration system in the urban-rural income differential. China Economic Journal, 11(2): 1-18.

DOI

[2]
Chan K W, 2010. The household registration system and migrant labor in China: Notes on a debate. Population & Development Review, 36(2): 357-364.

[3]
Chan K W, Zhang L, 1999. The Hukou system and rural-urban migration in China: Processes and changes. The China Quarterly, 160: 818-855.

DOI

[4]
Chen M, Huang X, Huang G et al., 2021. New urbanization and informal employment: Scale, pattern, and social integration. Progress in Geography, 40(1): 50-60. (in Chinese)

DOI

[5]
Chen M, Ye C, 2020. Thoughts and suggestions on further promoting new urbanization and urban-rural integration. National Governance, 32: 42-45. (in Chinese)

[6]
Chen M, Ye C, Lu D et al., 2019. Cognition and construction of the theoretical connotation for new urbanization with Chinese characteristics. Journal of Geographical Sciences, 20(10): 1681-1698.

[7]
Chen Y, 2012. Evaluation and thoughts on population control policies in Chinese large cities in the fast urbanization period. Modern Urban Research, 27(7): 9-14, 28. (in Chinese)

[8]
Dasgupta P S, 1969. On the concept of optimum population. Review of Economy Studies, 36(3): 295-318.

[9]
Di Q, Han S, 2015. Comprehensive evaluation and its spatial and temporal differences of city economic carrying: A case of 15 sub-provincial cities. Economic Geography, 35(9): 57-64. (in Chinese)

[10]
Li P, Sun W, 2014. Population forecast and evaluation on its economic of developed cities: A case study of Wuxi city. Resources and Environment in the Yangtze Basin, 23(8): 1045-1050. (in Chinese)

[11]
Lianos T P, Pseiridis A, 2016. Sustainable welfare and optimum population size. Environment Development & Sustainability, 18(6): 1-21.

[12]
Lin L, Zhu Y, 2016. Spatial variation and its determinants of migrant’s Hukou transfer intention of China’s prefecture- and provincial-level cities: Dynamic monitoring survey. Acta Geographica Sinica, 71(10): 1696-1709. (in Chinese)

[13]
Liu C, 2016. The research of optimum population theory’s formation evolution and practical significance[D]. Kunming: Yunnan University. (in Chinese)

[14]
Liu F, Huang R, Ding J et al., 2011. Population control in megacities. Population Research, 35(1): 29-43. (in Chinese)

[15]
Liu X H, Han L M, Yuan B, 2020. Does the conversion of household registration actually improve the happiness of migrant workers in China? International Journal of Environmental Research and Public Health, 17: 2661.

DOI

[16]
Lu Y, 2008. Does Hukou still matter? The household registration system and its impact on social stratification and mobility in China. Social Sciences in China, (1): 149-162, 207-208. (in Chinese)

[17]
Pimentel D, Giampietro M, Bukkens S G F, 1998. An optimum population for North and Latin America. Population & Environment, 20(2): 125-148.

[18]
Pimentel D, Harman R, Pacena M et al., 1994. Natural resources and an optimum human population. Population & Environment, 15(5): 347-369.

[19]
Renström T I, Spataro L, 2011. The optimum growth rate for population under critical-level utilitarianism. Journal of Population Economics, 24(3): 1181-1201.

DOI

[20]
Riiman V, Wilson A, Milewicz R et al., 2019. Comparing artificial neural network and cohort-component models for population forecasts. Population Review, 58(2): 100-116.

[21]
Shi L Y, Li D, Zhao J Z, 2010. A method to estimate urban optimum population conditions: A case study of Xiamen, China. International Journal of Sustainable Development & World Ecology, 17(4): 324-328.

[22]
Wang T, He P, 2017. The measurement of coefficient of urban population pressure and its influence factor analysis in China. Population & Economics, (6): 20-31.

[23]
Wang Y, Xie Y, Liu R et al., 2021. Population prediction and resource allocation in megacities from the optimum population perspective: A case study of Beijing, Shanghai, Guangzhou and Shenzhen. Acta Geographica Sinica, 76(2): 352-366. (in Chinese)

DOI

[24]
Wong L, Wai P H, 1998. Reforming the household registration system: A preliminary glimpse of the blue chop household registration system in Shanghai and Shenzhen. International Migration Review, 32(4): 974-994.

PMID

[25]
Wu X, Zhang Z, 2014. Household registration, occupational segregation and income inequality in urban China. Social Sciences in China, (6): 118-140. (in Chinese)

[26]
Wu X G, 2011. The household registration system and rural-urban educational inequality in contemporary China. Chinese Sociological Review, 44(2): 31-51.

DOI

[27]
Wu X G, Treiman D J, 2004. The household registration system and social stratification in China: 1955-1996. Demography, 41(2): 363-384.

PMID

[28]
Ye C, Yu J, 2020. Towards rural-urban integration: Key issues and trends on linking new-type urbanization to rural revitalization. Scientia Geographica Sinica, 40(4): 528-534. (in Chinese)

DOI

[29]
Ye C, Yu J, Zhang Q et al., 2021. From governance to rural-urban co-governance: Research frontiers, trends, and the Chinese paths. Progress in Geography, 40(1): 15-27. (in Chinese)

DOI

[30]
Ye C, 2021. A Theory and History of Rural-urban Governance in China. Singapore: Springer.

[31]
Yuan B, Li J, Wang Z et al., 2019. Household registration system, migration, and inequity in healthcare access. Healthcare, 7(2): 61.

DOI

[32]
Yuan L, 2016. Urban optimum population size and development pattern based on ecological footprint model: Case of Zhoushan, China. International Journal of Built Environment and Sustainability, 3(3): 134-141.

[33]
Zheng X P, 2007. Measurement of optimal city sizes in Japan: A surplus function approach. Urban Studies, 44(5): 939-951.

DOI

Outlines

/