
Journal of Geographical Sciences >
Spatial differentiation and influence mechanism of the connection-distribution performance of urban high-speed railway hub in the Yangtze River Economic Belt
|
Wang Degen (1973-), Professor, specialized in urban and rural development and regional planning. E-mail: wdg713@163.com |
Received date: 2021-09-28
Accepted date: 2022-03-28
Online published: 2022-12-25
Supported by
National Natural Science Foundation of China(41930644)
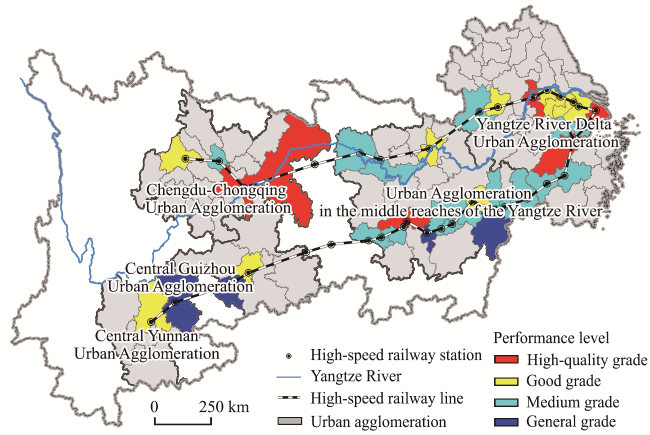
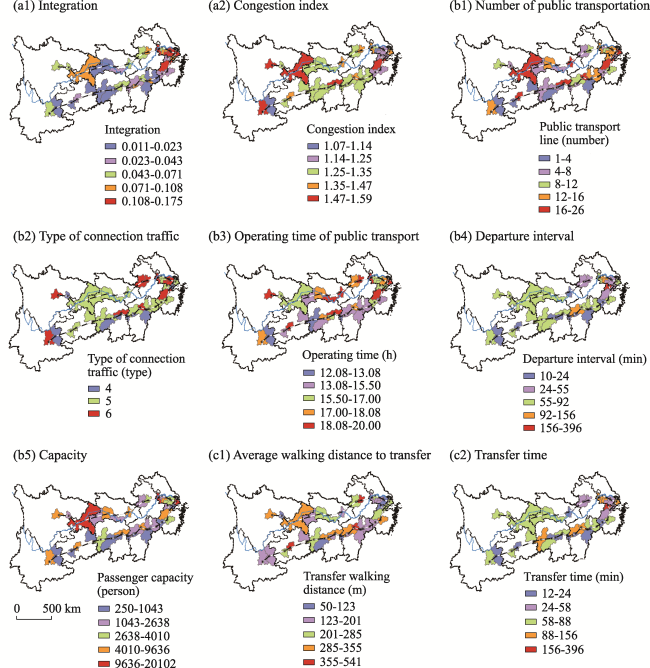
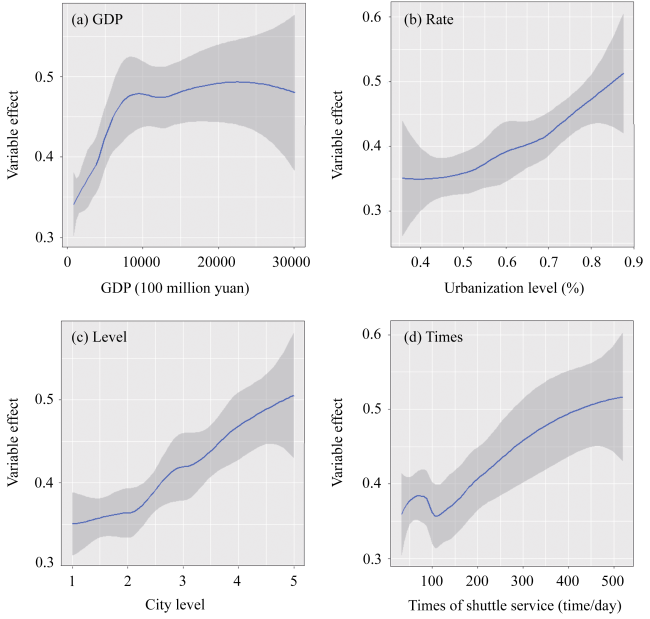
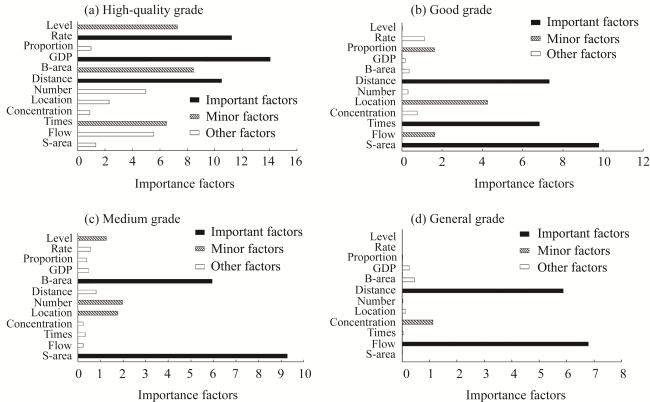
A transportation hub is the key link in the construction of the comprehensive three-dimensional transportation corridor of the Yangtze River Economic Belt, and is the basic factor responsible for the promotion of this belt. A high-speed railway hub has the “last kilometer of time-space compression” effect and is the key to building an efficient, convenient, modern, and comprehensive transportation system. This study constructed a model for measuring the connection-distribution performance of the high-speed railway hub, determined the connection-distribution performance of the urban high-speed railway hub in the Yangtze River Economic Belt, and analyzed its spatial differentiation characteristics, further revealed the influencing mechanism of the connection-distribution performance of the high-speed railway hub. The main results are as follows: (1) The connection-distribution performance of the high-speed railway hub in the Yangtze River Economic Belt presented an “olive-shaped pattern” grade structure with two small ends and a large middle section, that is, the number of high-speed railway stations with high performance and average performance was small, and the number of high-speed railway stations with good performance and medium performance was large. (2) The connection-distribution performance of the high-speed railway hub in the Yangtze River Economic Belt showed a regional differentiation pattern of “high in the east and low in the west” and “high in the north and low in the south”, and showed an urban agglomeration differentiation pattern of “high in the core areas but low in the marginal areas”; moreover, spatial differences were prominent in the distribution of nine evaluation indexes of the connection-distribution performance of the high-speed railway hub. (3) GDP, urbanization rate, city level, station passenger flow and frequency of shuttle bus were key driving factors affecting the connection-distribution performance of the high-speed railway hub. At the same time, there were significant differences in the key driving factors for the connection-distribution performance grades of high-quality, good, medium and average.
WANG Degen , XU Yinfeng , ZHAO Meifeng . Spatial differentiation and influence mechanism of the connection-distribution performance of urban high-speed railway hub in the Yangtze River Economic Belt[J]. Journal of Geographical Sciences, 2022 , 32(12) : 2475 -2502 . DOI: 10.1007/s11442-022-2057-7
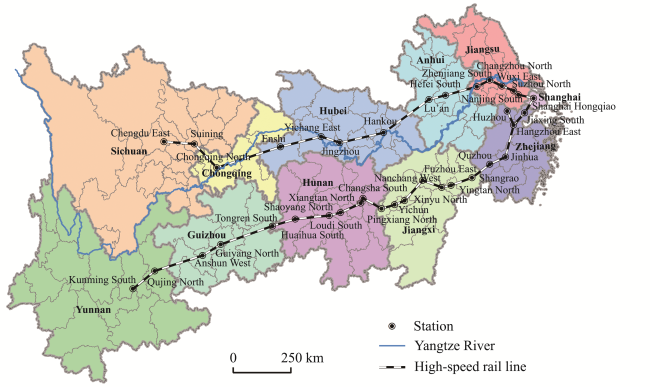
Figure 1 Map showing the Yangtze River Economic Belt |
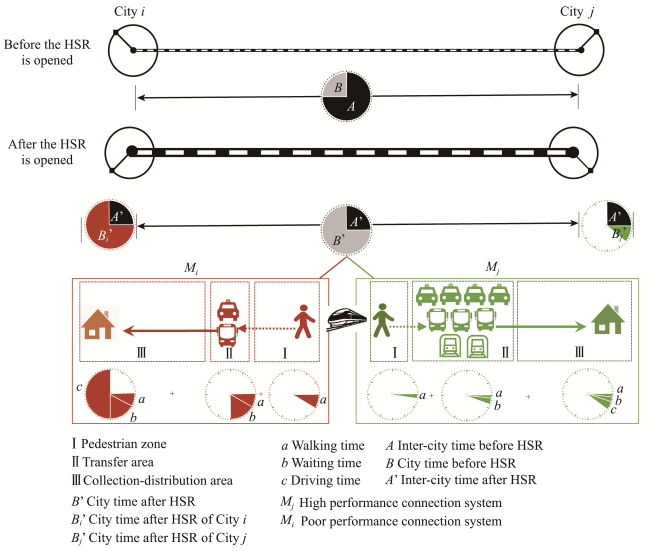
Figure 2 Schematic diagram of “last kilometer of time-space compression” effect of high-speed railway |
Table 1 Performance evaluation index of urban high-speed railway connection system |
| Target layer | System layer | Index layer | Direction | Weight | Index acquisition and calculation |
|---|---|---|---|---|---|
| Urban high-speed railway connection performance | Accessibility (λ1) | Integration (X1) | + | 0.0466 | ${{I}_{i}}=\frac{m\left[ lo{{g}_{2}}\left( \left( \frac{m+2}{3} \right)-1 \right)+1 \right]}{(m-1)|\bar{D}-1|}$ The integration value reflects the degree of agglomeration between the high-speed railway station and all other spatial units in the city. The greater the integration degree, the closer the distance between the high-speed railway station and all other spatial units in the city, and the fewer obstacles between them, the higher the traffic convenience, the better the accessibility. Ii is the degree of integration, and m is the number of unit Spaces in the urban system.$\bar{D}$ is average depth value (Hiller et al., 1984) |
| Congestion index (X2) | - | 0.0211 | Motor vehicle travel time/motor vehicle free flow (unblocked) travel time | ||
| connectivity (λ2) | Number of public transportation/lines(X3) | + | 0.0338 | $A=\sum{({{a}_{i}}\times {y}')}$ where ai is the traffic quantity of the ith mode of traffic connection, and y’ represents the weight | |
| Type of connection traffic/type (X4) | + | 0.0381 | Six types of coach, rail transit (metro and light rail), bus, taxi, social vehicles, and non-motor vehicles | ||
| Operating time of public transport/h (X5) | + | 0.0169 | It mainly takes the daily operation time of public transportation (rail transit and bus) and obtains data through field research | ||
| Departure interval /min (X6) | - | 0.0042 | $F=\sum{\left( \frac{\sum{{{f}_{ij}}}}{n}\times {z}' \right)}$ where fij is the departure frequency of line i of j traffic types, (i=1, 2, 3, …, n), and z° represents the weight | ||
| Capacity/person (X7) | + | 0.0677 | $C=\sum{({{c}_{ij}}\times {{a}_{i}}\times {z}')}$ where cij is the carrying capacity of line i of j traffic types, ai is the number of traffic lines of type i traffic connection, and z° represents the weight | ||
| Transfer degree (λ3) | Average walking distance to transfer/m (X8) | - | 0.0169 | $L=\frac{\Sigma {{l}_{i}}}{n}$ where li represents the distance on foot that passengers need to travel from the exit of the high-speed railway station to the type i connection station (i=1, 2, 3, …, n) | |
| Transfer time /min (X9) | - | 0.0042 | $T=\frac{{{T}_{1}}+{{T}_{2}}}{2}$, ${{T}_{1}}=\frac{\Sigma ({{a}_{i}}+{{b}_{i}}+{{c}_{i}}+{{d}_{i}})}{n}$ where T1 is the average transfer time of subway, and T2 is the average transfer time of bus (common bus and BRT). ai is for the time of ticket purchase of subway line i; bi refers to the time used for the security check of subway line i; ci refers to the time for the subway gate entry of the i; di is the waiting time of the i subway |
Note: “+” means positive indicator, and “-” means negative indicator |
Table 2 Variable description and expected impact |
| Primary variable | Secondary variables | Variable explanation and assignment description | Expectations |
|---|---|---|---|
| Scale of high- speed railway station | Number of platforms and tracks (Number) | The number of completed platforms and tracks of high-speed railway station | + |
| Concentration of station (Concentration) | Passenger flow of the station/urban population of the municipal district (Lin, 2011) | + | |
| Times of shuttle service (Times) | Daily number of daily shuttles (times/day) | + | |
| Station passenger flow (Flow) | Daily passenger flow during peak period of high-speed railway station (excluding important holidays) (ten thousand people) | + | |
| Station building area (S-area) | Construction area of high-speed railway station (m2) | + | |
| Urban development level | City level (Level) | According to the notice of the State Council on the adjustment of the standard for the classification of city size, cities are divided into five grades: super city, megacity, large city, medium-sized city and small city, with values of 5, 4, 3, 2 and 1 respectively | + |
| Urbanization rate (Rate) | Urban population/total population (%) | + | |
| Proportion of tertiary products (Proportion) | Value added of tertiary industry in urban GDP (%) | + | |
| Built-up area (B-area) | Built-up area of the city where the high-speed railway station is located (km2) | + | |
| GDP | 37 cities in the Yangtze River Economic Belt in 2018 (one hundred million yuan) | + | |
| Relationship between high-speed railway station and city | Distance to the city center (Distance) | The straight-line distance (km) between the high-speed railway station and the city center, where the city center is defined as the traditional commercial center or historical center of the city, is measured represented by public buildings or public spaces recognized by the public, such as People’s Square in downtown Shanghai and Guanqian street in downtown Suzhou | - |
| Location of high-speed railway station (Location) | According to “the direct distance between the high-speed railway station and the city center/the urban built-up area”, the high-speed railway station is divided into urban center stations (<0.5), edge stations (0.5-1.5), and peripheral stations (>1.5) (Zhao et al., 2015), with values of 3, 2, and 1, respectively | + |
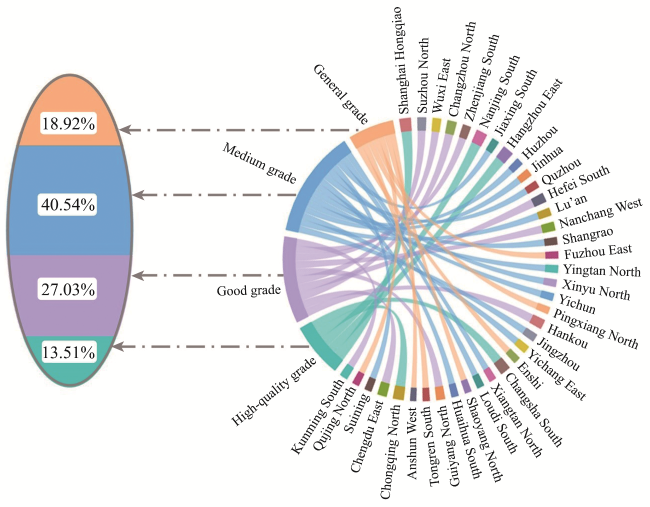
Figure 3 Performance level distribution of the high-speed rail connection-distribution system in the Yangtze River Economic Belt |
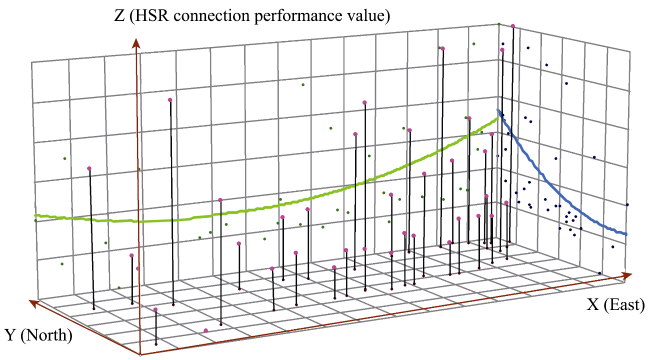
Figure 4 Overall trend of high-speed railway connection-distribution performance in the Yangtze River Economic Belt |
Figure 5 Spatial distribution of the connection-distribution performance of the high-speed railway hubs in the Yangtze River Economic Belt |
Figure 6 Spatial distribution of the indicators of the connection-distribution performance of the high-speed railway hub in the Yangtze River Economic Belt |
Figure 7 The ranking of the variable importance of the connection-distribution performance of the high-speed railway hub in the Yangtze River Economic Belt |
Figure 8 The influence of key factors on the connection-distribution performance of the high-speed railway hub in the Yangtze River Economic Belt |
Figure 9 The variable importance of the connection-distribution performance of the high-speed railway hub in the Yangtze River Economic Belt |
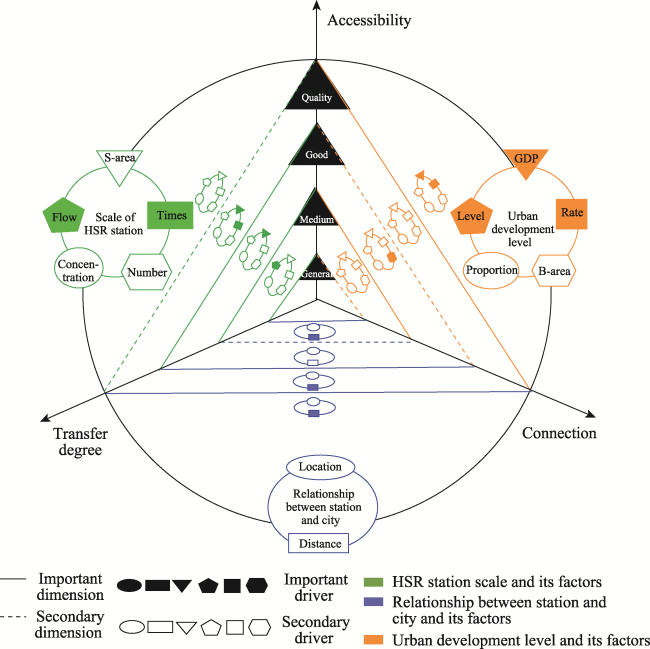
Figure 10 The influence mechanism of the connection-distribution performance of the high-speed railway hub in the Yangtze River Economic Belt |
| [1] |
|
| [2] |
|
| [3] |
|
| [4] |
|
| [5] |
|
| [6] |
|
| [7] |
|
| [8] |
|
| [9] |
|
| [10] |
|
| [11] |
|
| [12] |
|
| [13] |
|
| [14] |
|
| [15] |
|
| [16] |
|
| [17] |
|
| [18] |
|
| [19] |
|
| [20] |
|
| [21] |
|
| [22] |
|
| [23] |
|
| [24] |
|
| [25] |
|
| [26] |
|
| [27] |
|
| [28] |
|
| [29] |
|
| [30] |
|
| [31] |
|
| [32] |
|
| [33] |
|
| [34] |
|
| [35] |
|
| [36] |
|
| [37] |
|
| [38] |
|
| [39] |
|
/
| 〈 |
|
〉 |
