Research Articles

Urban land development intensity: New evidence behind economic transition in the Yangtze River Delta, China

  • YANG Qingke , 1, 2 ,
  • WANG Lei 3 ,
  • LI Yongle 1 ,
  • FAN Yeting 1, 2 ,
  • LIU Chao , 4, *
Expand
  • 1. School of Public Administration, Nanjing University of Finance & Economics, Nanjing 210023, China
  • 2. Key Laboratory of Coastal Zone Exploitation and Protection, Ministry of Natural Resources, Nanjing 210017, China
  • 3. Key Laboratory of Watershed Geographic Sciences, Nanjing Institute of Geography and Limnology, CAS, Nanjing 210008, China
  • 4. Faculty of Political Science, College of Public Administration, Central China Normal University, Wuhan 430079, China
* Liu Chao (1990-), PhD and Lecturer, E-mail:

Yang Qingke (1988-), PhD and Lecturer, specialized in urban land use and ecological environment effect. E -mail:

Received date: 2022-01-27

  Accepted date: 2022-08-25

  Online published: 2022-12-25

Supported by

Natural Science Foundation of Jiangsu Province(BK20200109)

Open Fund of Key Laboratory of Coastal Zone Exploitation and Protection, Ministry of Natural Resources(2021CZEPK05)

National Natural Science Foundation of China(42101282)

Philosophy and Social Science Research in Colleges and Universities of Jiangsu Province(2022SJYB0287)

Abstract

Over the past 20 years, China has experienced multiple economic transitions characterized by marketization, globalization, decentralization, and urbanization; as a result, urban land development intensity (ULDI) has become a significant issue for sustainable development. As China’s largest globalized urban area, the rapid socio-economic development of the Yangtze River Delta has created a huge demand for urban land. We apply a theoretical framework for a four-dimensional analysis tool to understand the dynamic evolution of the ULDI in the context of economic transition. It reveals that marketization, globalization, decentralization, and urbanization affect the ULDI in the economic transition of Yangtze River Delta. Marketization, especially the continuous improvement of land marketization, optimizes the spatial allocation of land resources and encourages urban land users to improve ULDI. Globalization promotes the rapid growth of economy and population through an increase in foreign direct investment. In the process of decentralization, local governments rely on developing a mode of land finance, resulting in a disordered urban space and low ULDI. Population growth and agglomeration during urbanization stimulates residents’ consumption capacity and promotes economic growth, thus creating a greater demand for urban land. However, a low level of development and utilization restricts the improvement of development intensity. Economic development can improve the level of land-intensive use by promoting the adjustment, optimization, and upgrade of urban industrial structures.

Cite this article

YANG Qingke , WANG Lei , LI Yongle , FAN Yeting , LIU Chao . Urban land development intensity: New evidence behind economic transition in the Yangtze River Delta, China[J]. Journal of Geographical Sciences, 2022 , 32(12) : 2453 -2474 . DOI: 10.1007/s11442-022-2056-8

1 Introduction

Urban land development intensity (ULDI) refers to the spatial mapping of urban modernization that shows the cumulative degree of land carrying capacity. The land carrying capacity depends on urban development strategies and land-use modes (Zhao et al., 2012; Zhang et al., 2017). The rational development and spatial layout of urban land supports the healthy development of society and the future direction of urban land use in China (Liu et al., 2011b). With the acceleration of globalization, the ULDI gained a hierarchy and scale in spatiotemporal evolution. It is no longer a local and physical process but is affected by global processes and institutional change (Wei and Ye, 2014). To revitalize land-use science, researchers proposed an analytical framework for urban land teleconnections that promoted the conceptualization of land use, urbanization, and economic geography (Güneralp et al., 2013). The research on ULDI mainly involves urban land efficiency, economic restructuring and spatial transition, which determines the direction and mode of urban development. Therefore, the research on spatiotemporal differentiation and influence mechanism of ULDI has become the focus of government and academic circles.
We reviewed literature based on the following: (1) analysis of the measurement and evaluation of ULDI. Based on panel data and spatial analysis model, typical cases are selected to explore the spatial-temporal evolution characteristics of ULDI (Ferdous and Bhat, 2013). The latest “3S” and spatial analysis technology are used to improve the accuracy of land development intensity evaluation (Di et al., 2015). Some studies try to deduce new comparison method to measure the ULDI (Zhang et al., 2017). (2) Changes and driving forces of ULDI. The driving mechanism of ULDI was studied with regard to indicators, such as plot ratio, building density, and the results indicated a diverse range of influencing factors. Among them, urban public resources were considered an important driving factor (Tan et al., 2013). China’s special fiscal decentralization and the dual land management system of urban and rural areas were recognized as fundamental driving factors in the rapid expansion of urban land (Chen et al., 2015; He et al., 2016). Other studies that focused on urban land use expansion (defined as the direction of land use expansion), analyzed the characteristics of transformation from a macro scale and constructed corresponding models to explore the influence mechanism of change in land-use (Alcock et al., 2017). (3) Study on the effect of ULDI. We reviewed the impact on land resources caused by the change in ULDI (Zhao et al., 2012; Yan et al., 2017). We also paid special attention to a series of analysis on the relationship between ULDI and ecological environment (Yang et al., 2020a), including the impact of subway trunk line development on ULDI (Gu and Zheng, 2010), and the relationship between urban spatial expansion and ULDI (Zhang et al., 2016). ULDI was studied from institutional and political perspectives, particularly neo-liberalization (Lin et al., 2014; Sung and Lee, 2015). Some studies regarded urban land development as a key tool for local governments to attract foreign direct investment, thereby increasing local fiscal revenue and promoting the local economy (Lin and Ho, 2005; Tao et al., 2010; Yew, 2011; Son et al., 2015).
The current researches recognize ULDI’s role in the evolution of land development patterns and its power to shape and guide urban development strategies. Our perspective on the multidimensional analysis of ULDI was supported by studies that used remote sensing interpretation, spatial analysis, and other technical methods. However, the current literature on ULDI contains gaps in its knowledge base. For example, few studies used the theoretical framework to study ULDI during the economic transition in China; therefore, their explanatory power concerning ULDI was weak. Evaluation research is carried out in numerous ULDI studies while other studies focus on the spatiotemporal characteristics of land use, identification of influencing factors, and effects on the environment (Aydin and Esen, 2018; Xu and Chi, 2019). Research on the spatiotemporal differentiation and influence mechanism of ULDI remained unexplored, which is an unfortunate omission during the period of economic transition, globalization, marketization, decentralization, and urbanization; these factors play an important role in reconstructing China’s regional economic pattern (Huang et al., 2015; Wu et al., 2017).
Summarizing the above analysis results, this study focuses on the following key issues: (1) at the regional level, what are spatiotemporal characteristics of ULDI; (2) What is the spatial heterogeneity of ULDI? (3) How does economic transition affect the dynamic change of ULDI? Therefore, based on the perspective of economic transition, we attempt to build a theoretical analysis framework to analyze the influence mechanism of globalization, marketization, decentralization, and urbanization on ULDI in the Yangtze River Delta (YRD). We focus on the role of economic transition in the understanding of the spatial effects of ULDI. By emphasizing spatial effects, the study has the potential to make an important theoretical contribution to the existing literature. And in practice, the study comprehensively evaluates the spatiotemporal changes of ULDI from the perspective of economic transition, which is conducive to clarify the actual situation and existing problems of land use in the process of urbanization in the YRD, and provide scientific reference for the formulation of rational use and optimal regulation countermeasures of urban land.

2 Theoretical analyses: Economic transition and ULDI

The literatures identify several factors that contribute to an explanation of dynamic change of ULDI: economic development level, urban expansion form, building density and so on (Wei, 2001). As China’s largest economic transition region, the ULDI in the YRD is more complex than others. By introducing new development factors, China’s economic transition was summarized as a triple process of marketization, globalization, and decentralization (Wei and Li, 2002). This transition considerably reshaped the land-use patterns in China and led to significant changes in urban land development (Wei, 2001; Wu et al., 2017). Coincidentally, the government of China released the National New-Type Urbanization Plan in March 2014, which covers almost every conceivable aspect of urbanization and forms an important model in relation to urban land use in the coming decades (Bai et al., 2014). Population migration and economic growth via rapid urbanization had a profound impact on ULDI (Long et al., 2009). Therefore, by integrating the triple transition and urbanization with Chinese characteristics, we developed a four-dimensional theoretical framework to explain the dynamic evolution of the ULDI during China’s economic transition (Figure 1).
Figure 1 Framework for analyzing the influence mechanism of ULDI
Marketization refers to the transition from a planned economy to a market economy and is an important aspect of China’s economic transition. Since the rapid economic development in the late 1970s, land use patterns underwent significant changes (Pannell, 2002). In particular, the focus of social consciousness shifted from equalitarianism to comparative advantage, which led to an unprecedented expansion of eastern coastal towns and development zones (Lin and Ho, 2003). The market-oriented reform affected change in the ULDI from two aspects. First, marketization increased land supply by encouraging the establishment of an urban land market (Zhu, 2005). Moreover, the income obtained by transferring land was endorsed by the local state and constituted a vital source of government revenue (Li and Wei, 2010). These land revenues were invested in urban infrastructure projects aimed at improving accessibility conditions and promoting capital accumulation (He et al., 2013; Wu et al., 2017). According to Tian and Ma (2009), “using the land market to boost domestic economic development” caused urban land to expand rapidly. Second, productive capital was commoditized, making the market the main factor in distribution decision making (Wei and Li, 2002). Marketization increased the demand for construction land through the establishment of enterprises and population migration, which had a significant impact on ULDI.
Globalization promoted the integration of the Chinese economy into the global economy (He and Zhu, 2007). An important manifestation of this is the increase in China’s foreign direct investment (FDI) and international trade (Zhang et al., 2020a). As a key driving force for urban land expansion, globalization has impacted dynamic changes in the ULDI (Gao et al., 2014). First, the impact of globalization on the ULDI was mainly transmitted through FDI. Through the scale effect, FDI could improve the input-output efficiency of urban land (Huang et al., 2015). Additionally, globalization promotes an increase in FDI in the YRD, particularly in its development zones, which in turn might boost economic growth (Wang, 2013; Huang et al., 2015). This could be possible because FDI provided financial support to introduce more management experience and advanced technology, which made urban land use more effective in development zones (Liu et al., 2011a). Second, policy privileges of the development zone, including the special provisions of reduced taxes and tariffs for land use and lower land prices (Lu, 2011; Wang, 2013), could reduce production costs and improve economic output and development intensity.
As an important feature of China’s economic transition, decentralization created the incentive mechanism, and distributed some property rights to agents who can profit from production (Wei and Ye, 2014). The competition for land use rights between central and local governments could affect ULDI. However, because the previous institution was weak and the new institutionalized system had not been fully established, the changes in China’s land-use system had some uncertainties (Gao et al., 2014). Restraining institutional forces such as zoning regulations, land spatial planning, and the provision of advanced techniques, limited urban land expansion and controlled the ULDI (Liu et al., 2014; Xu et al., 2015). In the context of decentralization, there was a powerful economic motivation for local officials to seek more budgetary revenue by acquiring rural land to expand their industrial parks (Yang and Li, 2014). Decentralization coupled with the powerful incentive of promoting opportunities made the inter-regional competition fierce, causing the governments to lease industrial land at low prices and introduce investments from home and abroad to improve economic development. Moreover, decentralization led to urban land expansion and functional transitions that impacted ULDI (Bai et al., 2014; He et al., 2016). Financial and political competition among local officials was an important incentive for the rapid expansion of urban land. “Vertical competition between father and sons” and “horizontal competition between brothers” constituted a unique mechanism of ULDI change (Gao et al., 2014).
Driven by the transition process mentioned above, China underwent an unprecedented process of urbanization that induced extensive conversion of rural land to urban use (Wei, 2015; Kuang et al., 2020). Its principals could guide urbanization in China toward the human scale, people-oriented, walkable cities (Zhou et al., 2015). Smart urban growth and compact development have been advocated to combat the disorderly spread of urban space and the occupation of cultivated land (Handy, 2005; Whittemore and BenDor, 2018). Upgrading industrial structures in the process of economic transition could optimize the structure of urban land use to improve the ULDI. Correspondingly, the government formulated structural adjustment measures, increasing investments in research and development to improve economic output (Wu et al., 2014; He and Peng, 2017). The reform-triggered urbanization profoundly altered the function and structure of the landscape ecosystem and affected dynamic changes in ULDI (Bai et al., 2011; Chen et al., 2018).

3 Materials and methods

3.1 Study area

The YRD is one of the most developed regions in China and has one of the highest urbanization rates. Its total GDP in 2020 reached 20,511 billion yuan, accounting for 20.3% of China’s total GDP, and its urbanization rate reached 72.4%, which is higher than the national average of 63.9%. The YRD is located on the eastern coast of China, covering an area of 21.17×10⁴ km2, and accounting for about 2.2% of China’s land area. Within the scope of Shanghai Municipality, Jiangsu Province, Zhejiang Province, and Anhui Province, it is an important link between two national strategies: the Belt and Road and the Yangtze River Economic Belt (Figure 2). Since the 21st century, rapid urbanization and industrialization made the YRD a typical example of human-land evolution caused by land use change, such as low urbanization quality, excessively fast urban sprawl, and ecosystem degradation, which severely hinder progress in the urban land development.
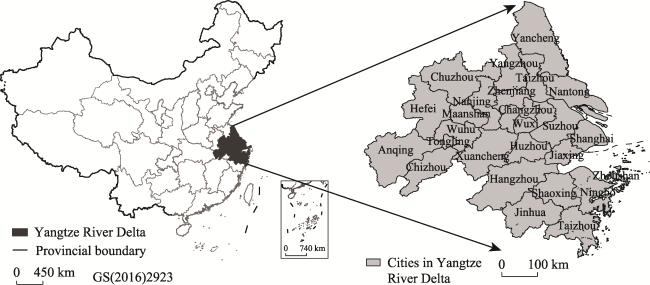
Figure 2 Location of the Yangtze River Delta

3.2 Research methods

3.2.1 Development intensity measurement model

The ULDI reflects the current situation and is the starting point for future sustainable utilization. It is an index that characterizes the extent of urban land development, the carrying capacity of population agglomeration, and the level of economic development. Additionally, it is a concentrated reflection of the scale, level, and characteristics of land production (Zhang et al., 2020b). As the space that sustains various human activities, urban land can support or restrict urban construction and industrial development, determine regional resource potential and environmental capacity, and provide basic conditions for economic growth (Yang et al., 2020b). The area’s growth and morphological alteration of urban land reflect the comprehensive changes in land development, economic benefits, and the population carrying capacity (Wang et al., 2015; Liu et al., 2018). Thus, ULDI can be calculated as follows:
$U L D I=\alpha L D B+\beta E D S+\gamma P C D=\alpha \frac{C L}{T A}+\beta \frac{O}{C L}+\gamma \frac{P}{C L}$
where ULDI is urban land development intensity, LDB is land development breadth and refers to the proportion of built-up area to the total urban area; PCD is population carrying density and refers to the population carrying capacity of each unit of urban land; EDS is economic development strength and refers to the added value of secondary and tertiary industries per unit of urban land area; α, β, and γ are used to represent the weight determined by the entropy method; CL refers to the area of built-up land; TA refers to the total area of the case region; O refers to the added value of secondary and tertiary industries; P refers to the urban population.

3.2.2 Spatial autocorrelation model

Research indicated that land use activities in adjacent areas interacted with each other, and most of them showed characteristics of spatial correlation geographically (Anselin et al., 2004; Wang et al., 2018). Therefore, global spatial autocorrelation and local spatial autocorrelation were selected to determine the spatial heterogeneity of the ULDI. Moran’s I model of global spatial autocorrelation was as follows:
$\text { Moran's } I=\left[n \sum_{i=1}^{n} \sum_{j=1}^{n} W_{i j}\left(y_{i t}-\overline{y_{t}}\right)^{2}\left(y_{j t}-\overline{y_{t}}\right)\right] / \sum_{i=1}^{n} \sum_{j=1}^{n} W_{i j} \sum_{i=1}^{n}\left(y_{i t}-\overline{y_{t}}\right)^{2}$
where yit is the t-year value of city i; yjt is the t-year value of city j; $\bar{y_{t}}$ is the mean value of all cities in year t; Wij is the binary spatial weight matrix, and after standardization it is the first-order geographic proximity matrix; $W_{i j}=w_{i j} / \sum_{j=1}^{n} w_{i j} \cdot w_{i j}$. wij is set to 1 for adjacent cities and 0 for non-adjacent cities and diagonal elements.
The global spatial autocorrelation test tended to ignore the atypical distribution characteristics of ULDI. Local indicators of spatial association (LISA) tests could overcome this shortcoming. The model was as follows:
Local Moran’s $\text { Local Moran's } I=\left[\left(y_{i t}-\overline{y_{t}}\right) / \sum_{i=1}^{n}\left(y_{i t}-\overline{y_{t}}\right)^{2}\right] \sum_{j=1}^{n}\left(y_{j t}-\overline{y_{t}}\right)$
According to the statistical results of LISA, spatial clustering was carried out and divided into four categories: high ULDI with high ULDI (HH), high ULDI with low ULDI (HL), low ULDI with high ULDI (LH), and low ULDI with low ULDI (LL). In this study, GeoDa software was used for the LISA analysis.

3.2.3 The spatial Durbin model

The spatial Durbin model (SDM) includes the spatial dependence effects of both independent and dependent variables and is used to investigate the spatial correlation characteristics of the evaluation results. It is a more general model than the spatial lag model (SLM) and spatial error model (SEM) (Elhorst, 2003; Wei et al., 2020). We use the SDM to explore the spatial dependence effect of ULDI and analyze the direct and spillover effects of independent variables on dependent variables. The basic model is as follows:
$y_{i j}=\rho \sum_{j=1}^{n} w_{i j} y_{i j}+\beta x_{i j}+\varphi \sum_{j=1}^{n} w_{i j} x_{i j}+\mu_{i}+v_{t}+\varepsilon_{i t}$
where yij and xij are the values of the dependent variable and the independent variable of cities i and j in year t, respectively; β is the coefficient of the independent variable; ρ is the spatial lag coefficient of the dependent variable; φ is the spatial regression coefficient of the independent variable; μi and νt are spatial and time effects, respectively; and εit is the random error term.
The direct and indirect effects in the model were decomposed by using a partial differential equation to get the real partial regression coefficient. This method was applied to the spatial panel model which explained its principle with SDM as an example (Donkelaar et al., 2014). The SDM was rewritten in vector form as follows:
$Y_{t}=(I-\delta W)^{-1}\left(\beta X_{t}+W X_{t} \gamma\right)+(I-\delta W)^{-1} \varepsilon_{t}^{*}$
where the error term $\varepsilon_{t}^{*}$ includes εt and fixed effect, and the k-th explanatory variable is taken as the independent variable to obtain its derivative. The partial differential matrix is expressed as follows:
$\left[\frac{\partial Y_{1}}{\partial X_{1 k}} \cdot \frac{\partial Y}{\partial X_{N k}}\right]=(I-\delta W)^{-1}\left[\begin{array}{cccc}\beta_{k} & w_{12} \lambda_{k} & \cdots & w_{1 N} \lambda_{k} \\w_{21} \lambda_{k} & \beta_{k} & \cdots & w_{2 N} \lambda_{k} \\\cdot & \cdot & \cdots & \cdot \\w_{N 1} \lambda_{k} & w_{N 2} \lambda_{k} & \cdots & \beta_{k}\end{array}\right]_{t}$
where the direct effect is the mean value of the main diagonal elements of the right-hand matrix, which represents the marginal effect of the k-th variable on the dependent variable of the cross-section element. The indirect effect is that the mean value of the elements (except the main diagonal) represents (a) the effect of the k-th variable and other cross-section elements on the dependent variable, or (b) the marginal effect of other elements on the dependent variable.

3.3 Indicators for influence mechanism analysis

Based on the four dimensions of marketization, decentralization, globalization and urbanization in China’s post-economic transition, we integrated the typical characteristics of urban development. And then, the appropriate variables would be chosen to explain the dynamic evolution of ULDI below.
China’s marketization process had a significant impact on factor flow and labor productivity (Bai et al., 2004). With the development of society and economics, there was a reduction in cultivated land and an increase in construction land, both of which were closely related to the non-agricultural labor force and active capital market (Lichtenberg and Ding, 2008). Therefore, the proportion of the bidding, auction, and listing areas in the total transfer area of the city’s primary market is selected as the characterization index of the land marketization level (LM). Considering the total number of loans and deposits, the proportion of loans for land development is selected to represent capital activity (CA) as a measure of the differences in the degree of marketization among cities.
Concerning the process of globalization, the intensity of foreign direct investment (FDI) reflects capital flow, which is said to improve the ULDI. International trade (IT) could activate the local economy and increase land demand, resulting in changes in the ULDI (Gao et al., 2014). Therefore, the proportion of exports to GDP was used to measure the impetus degree of economic growth. Decentralization, as a typical economic transition in China, influenced spatial-temporal changes in ULDI through the demand for land finance and local government competition (Wei, 2001; Zhang et al., 2019). Land finance demand (LF) is included in the analysis and estimated as the proportion of tax revenue in the general budget expenditure. Government competitiveness (GC) is mainly reflected by the urban administrative and economic development levels (i.e., GDP). The levels are evaluated as follows: the administrative level of the municipality directly under the central government is the highest and its competitiveness the strongest; vice-provincial cities are second in terms of competitiveness, and the competitiveness of ordinary prefecture-level cities is the weakest. Therefore, the weighted government competitiveness is defined, which could more accurately reflect its impact on ULDI. Urbanization was another driver of ULDI. The population urbanization level (PU) was selected to indicate the spatial carrying capacity of urban land for the population (Kuang et al., 2020). The proportion of the added value of the second and tertiary industries to GDP was used to measure the economic urbanization level (EU), which represented the carrying capacity of urban construction land for economic production activities. All the independent variables are summarized in Table 1.
Table 1 Definitions of independent variables
Category Variable Definition Expected sign
Marketization Land marketization level The proportion of bidding, auction, and listing areas in the total transfer area of the city’s primary market. Positive
Capital activity The proportion of the loans for land development in the total number of loans and deposits. Positive
Globalization Strength of foreign direct investment The proportion of the absolute values of FDI accounts in GDP. Positive
International trade level The proportion of total import and export accounts in GDP. Negative
Decentralization Land finance demand The proportion of tax revenues in general budget
expenditure.
Negative
Government
competitiveness
Government competitiveness could be estimated as
the average economic development (per capita GDP
corrected by the consumer price index), weighted by
the administrative level (municipality directly under
the central government=1.2, sub-provincial city=0.8,
prefecture-level city=0.5).
Positive
Urbanization Population urbanization level The proportion of urban population in total population. Negative
Economic urbanization level The proportion of the added value of the second and tertiary industry in GDP. Positive

3.4 Data sources

In this study, we use 26 cities in the YRD as case studies and conducted a content analysis using secondary data on the factors that affect ULDI. The data are mainly obtained through public information sources and open-source data platforms, including the China Urban Statistical Yearbook (2000-2020), the statistical yearbooks of 26 cities in the YRD, and the National Earth System Science Data Center (http://www.geodata.cn/). We eliminate price factor effects based on the year 2000 by converting the indicators of fixed asset investment and industrial added value to constant prices. This is achieved by using the fixed asset investment index and ex-factory price indices of industrial products. To maintain the longitudinal nature of our research data, five temporal sections, 2000, 2005, 2010, 2015, and 2020, are selected to analyze the spatial distribution characteristics of the ULDI. Owing to the change of administrative boundaries in some cities, the study takes China’s administrative divisions in 2020 as the unified standard.

4 Results and discussion

4.1 Spatiotemporal characteristics of the ULDI

4.1.1 Overall differentiation characteristics of ULDI

During the study period, the average value of ULDI in the YRD was 0.248, with an obvious upward trend, from 0.163 in 2000 to 0.325 in 2020. Among them, Shanghai’s ULDI was in first place in the YRD from 2000 to 2020 because it had significant advantages compared to other cities. It is located in the core area of the YRD, with superior location and the most rapid development of accessibility. Transportation costs were reduced effectively, which enhanced comparative advantage, promoted capital flow and further strengthened ULDI. Tongling, Chizhou, Hefei, Ma’anshan, and Suzhou showed clear ULDI growth trends with growth rates of 9.79%, 8.73%, 8.44%, 8.43%, and 7.49%, respectively. After 2008, the ULDI in Anhui and Zhejiang had a slow growth trend (Figure 3). This indirectly indicates that in the face of global economic fluctuations, the regions have different economic bases and urban structures, thus creating significant spatial differences in ULDI.
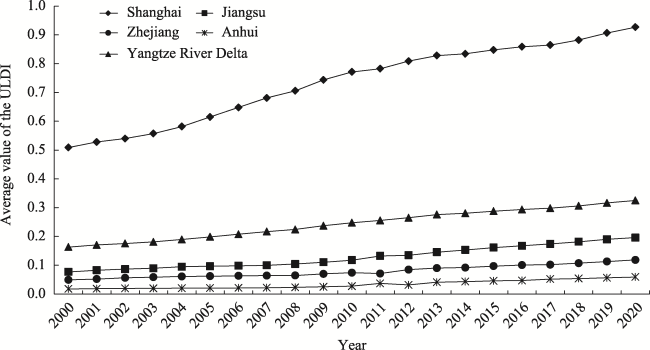
Figure 3 Temporal change of the ULDI in the Yangtze River Delta from 2000 to 2020
From 2000 to 2008, the ULDI in the YRD continued to increase significantly, with an average annual growth of 4.28%. The Z-value test was carried out, and the corresponding P=0.0326, which passed the significance test at the level of 5%. After 2008, the growth rate stabilized at 2.68%. This time node may be related to the global financial crisis of 2008, during which the economies of many countries, including China, suffered heavy losses. To cope with the negative impact of the financial crisis on economic development in the YRD, all levels of government and types of enterprises actively adjusted their operations (Pei et al., 2011). Large-scale investments and constructions led to a high level of debt in local governments. Excess capacity and low returns on infrastructure investment slowed the growth rate of the ULDI. However, after the financial crisis eased, global trade protectionism began to rise, and the external demand market in the YRD shrank rapidly, resulting in a decline in the total inflow of FDI (Jin et al., 2011). Thus, these factors had an uncertain effect on the ULDI.

4.1.2 Spatial distribution characteristics of ULDI

Regarding the evolution of spatial pattern, Figure 4 shows that the ULDI in the YRD varies greatly among different cities for a variety of complex reasons. The features of the core-periphery layout were significant. The high-value areas were concentrated in Shanghai and southern Jiangsu; this finding was consistent with the level of social and economic development in these areas. The development intensity of the neighboring cities was relatively low. Shanghai, Nanjing, Suzhou, and other core cities with a high administrative level, a strong development foundation, low costs for attracting capital, technology, high-quality talent, and other favorable production factors, could effectively revitalize the built-up area, control the total amount of newly constructed land, and improve land investment intensity. These measures guaranteed the rational use of urban land.
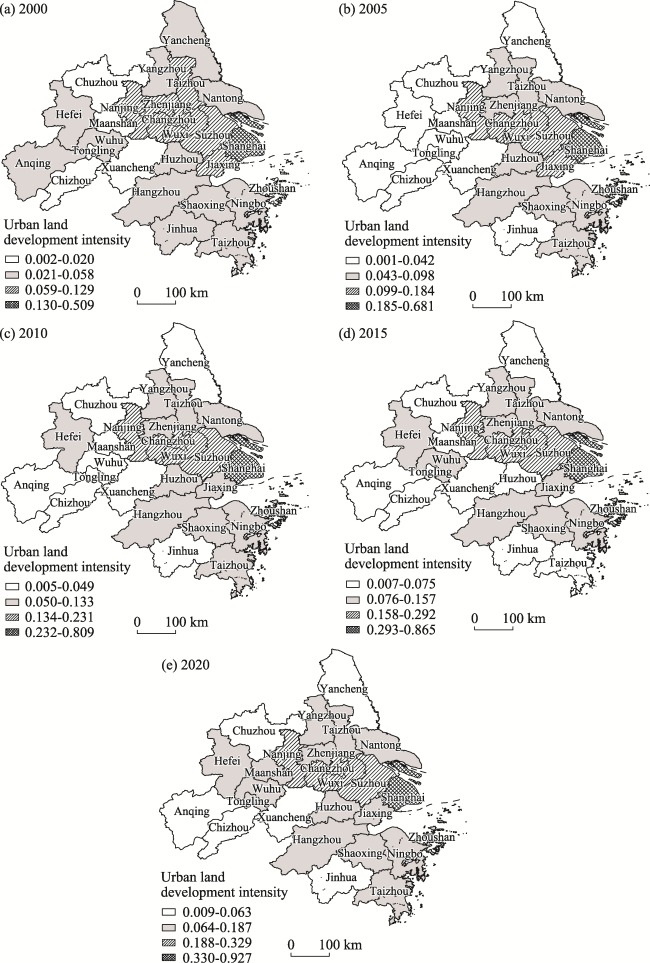
Figure 4 Spatial pattern of ULDI in the Yangtze River Delta
Correspondingly, peripheral cities in the YRD, such as Yancheng, Chuzhou, Anqing, and Jinhua, had a low level of ULDI for several reasons. The foundation of economic development was weak, the investment intensity of per-unit construction of land was low, and the construction of urban development zones and industrial concentration areas was intensive. Furthermore, the sustainable land-use policies of Yancheng, Chuzhou, and other cities were inadequate and failed to guide the reuse of inefficient land after remediation. This finding also demonstrated that the administrative level of the above cities was not high, and the potential to improve the level of urban economic development was small, which made the ULDI at a low level.

4.2 Spatial heterogeneity analysis of ULDI

From 2000 to 2020, the global Moran’s I index was greater than 0, therefore, it passed the significance test of the Monte Carlo simulation at the level of 0.05 (Table 2). This result indicated that ULDI in the YRD was not independent in space but had a strong high (low) agglomeration distribution. Moran’s I index changed little from 2000 to 2009; however, positive spatial autocorrelation remained. Moran’s I index showed an upward trend from 2010 to 2020. In 2020, it reached a maximum of 0.366, making the spatial agglomeration characteristics of ULDI more obvious.
Table 2 Results of global spatial autocorrelation from 2000 to 2020
Year Moran’s I Z(I) p-value Year Moran’s I Z(I) p-value
2000 0.264 3.024 0.005 2011 0.275 4.517 0. 000
2001 0.256 3.431 0.018 2012 0.318 4.589 0.000
2002 0.270 2.762 0.042 2013 0.323 3.753 0.003
2003 0.281 2.703 0.051 2014 0.345 3.353 0.004
2004 0.286 3.052 0.006 2015 0.348 2.823 0.014
2005 0.272 2.913 0.008 2016 0.355 2.853 0.012
2006 0.257 2.774 0.011 2017 0.347 2.296 0.018
2007 0.242 2.635 0.013 2018 0.349 2.528 0.011
2008 0.241 3.306 0.007 2019 0.359 2.943 0.003
2009 0.248 3.436 0.005 2020 0.366 3.190 0.001
2010 0.267 2.314 0.032
To explore the local characteristics of the spatial autocorrelation of ULDI, Figure 5 maps the LISA spatial cluster pattern of ULDI. Four categories, namely HH, HL, LH, and LL, showed a dynamic evolution trend. Hotspot clusters (HH areas) were largely concentrated in central cities, such as Shanghai and Suzhou. The local spatial agglomeration pattern showed characteristics of a certain level of stability and spatial dependence. The construction land in these cities expanded rapidly, witnessing a dramatic process of urbanization and industrialization (Deng et al., 2010; He et al., 2013). In addition, Shanghai, Hangzhou, Ningbo and other cities are located in China’s coastal areas and are most affected by global forces such as FDI. The high ULDI index again confirms that global power is an important factor in urban land development. The distribution of cold spot clusters (LL areas) changed constantly. In 2015, LL areas were concentrated in the southern Anhui Province and in the Zhejiang Province and had significant spatial agglomeration characteristics. In addition to positive global spatial autocorrelation and local spatial correlation, there were also local mismatched spatial distributions (HL and LH areas). The HL and LH areas were located in a circular structure and extended to the periphery. In 2020, LH areas were in the southern part of the YRD with an economic development that was mainly endogenous. The layout of industrial and mining enterprises in these cities was scattered, making blind land occupation and its inefficient use widespread, indicating that ULDI needed to be improved.
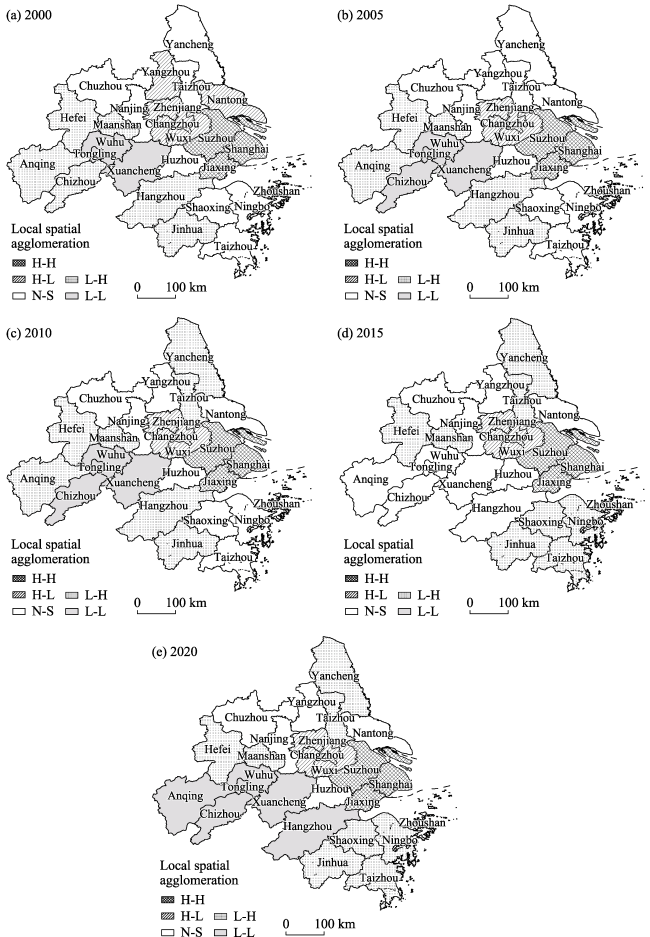
Figure 5 Evolution of the local spatial agglomeration pattern in the Yangtze River Delta

4.3 Analysis of the influence mechanism of ULDI

4.3.1 Determination of estimation model

According to the results presented by Moran’s I index, the positive spatial spillover effect of ULDI in the YRD was significant and showed a certain degree of local spatial autocorrelation of HH and LL agglomeration. Therefore, research on the impact of regional integration on the evolution of ULDI should consider geographical spatial factors and their interactions. The models SLM, SEM, and SDM were used to estimate the results. However, it was necessary to select the appropriate spatial model based on the test results and judgment rules, as listed in Table 3. Further details of the results as per the model are presented below.
Table 3 Relevant test of the spatial econometric models
Model Test method Result t-value p-value
Selection of SLM and SEM LM-lag 1.649 0.911 0.160
R-LM-lag 5.019 2.143 0.004
LM-error 5.272 3.009 0.002
R-LM-error 8.642 3.067 0.002
Can SDM be simplified Wald-Lag 47.725 4.094 0.000
LR-Lag 35.405 4.844 0.000
Wald-Error 42.164 3.673 0.000
LR-Error 38.504 5.279 0.000
Selection of fixed and random effects Hausman 16.930 5.916 0.000
(1) SLM and SEM selection: For setting the spatial weight matrix of geographical distance, LM-error, R-LM-error of SEM, and R-LM-lag statistics of SLM were significant at the 0.01 level, but the LM-lag of SLM failed to pass the significance test. The results showed that SEM is better than SLM in the exploration of the influence mechanism of ULDI. The results additionally indicated that the estimation results were spatially dependent.
(2) Can SDM be simplified? The results reached a significance level of 0.01 using the Wald and LR statistical tests; accordingly, SDM could be simplified into SLM, or SEM was rejected. Additionally, the results showed that the SDM was more accurate than the SLM or SEM model in terms of the impact of the regional integration mechanism on ULDI.
(3) Fixed and random effects selection: Following the selection of the SDM, an applicability test of fixed effects and random effects was conducted. The Hausman statistic was 16.930 and passed the significance test at a 0.01 level. This result suggested that the SDM should be selected with fixed effects for the result fitting analysis.

4.3.2 Analysis results of the model

The SDM with fixed effects includes three aspects: time fixed, spatial fixed, and spatiotemporal bidirectional fixed. To ensure the accuracy of model selection, we selected SDM with non-fixed effects, time fixed effects, spatial fixed effects, and two-way fixed effects. Based on the estimation results of models with different interaction effects (Table 4), log L, R2, and other results were selected to determine the appropriate SDM. The log L and R2 results of SDM with the spatial fixed effects were the largest; therefore, this model was used to estimate the final results.
Table 4 Results of estimating SDM under different interaction effects
Variable SDM with non-fixed effects SDM with time fixed effects SDM with spatial fixed effects SDM with bidirectional fixed effects Variable SDM with non-fixed effects SDM with time fixed effects SDM with spatial fixed effects SDM with bidirectional fixed effects
_cons 0.098*** W×LM 0.116** 0.507 0.006 -0.361***
(2.9) (2.19) (1.60) (0.12) (-3.63)
LM -0.028** 0.018 -0.024** -0.047*** W×CA 0.028** -0.126 0.048*** 0.092
(-2.54) (0.51) (-2.21) (-4.25) (2.32) (-0.60) (3.81) (1.57)
CA -0.041*** -0.159*** -0.053*** -0.047*** W×FDI -0.075* 1.827*** -0.028 -0.210**
(-4.54) (-4.54) (-5.15) (-4.64) (-1.65) (8.24) (-0.75) (-2.43)
FDI -0.048*** 0.095*** -0.038*** -0.042*** W×IT 0.214*** 0.821*** 0.154*** -0.218**
(-4.72) (3.11) (-3.85) (-4.29) (3.33) (3.11) (2.94) (-2.01)
IT -0.001 0.109*** -0.016 -0.029* W×LF -0.029 -1.431** -0.021 0.324
(-0.04) (2.95) (-0.96) (-1.80) (-1.5) (-2.54) (-1.04) (1.51)
LF 0.023 -0.317*** 0.018 0.040* W×GC -0.026 3.546*** 0.044 0.835***
(1.49) (-5.51) (1.19) (1.92) (-0.27) (5.47) (0.50) (3.84)
GC 0.356*** 0.910*** 0.340*** 0.385*** W×PU 0.021 -1.559*** -0.011 -0.170
(20.02) (15.04) (19.60) (18.52) (0.26) (-4.40) (-0.16) (-1.28)
PU -0.084*** 0.008 -0.094*** -0.086*** W×EU 0.048* 0.167 0.057** 0.291***
(-4.6) (0.23) (-5.05) (-4.66) (1.91) (0.84) (2.39) (3.92)
EU -0.023** -0.071 -0.033** -0.045*** rho -0.418** -1.817*** -0.015* -0.428**
(-2.05) (-2.37) (-2.56) (-3.03) (-2.2) (-6.84) (-1.59) (-1.98)
R2 0.723 0.754 0.816 0.773 Obs 494 494 494 494
log L 119.137 60.809 128.431 131.477

Notes: ***, **, and * indicate significance at the 1%, 5%, and 10% levels, respectively. z values are in parentheses.

The direct influence coefficient and spatial lag coefficient of land marketization (LM) and capital activity (CA) were significantly positive, indicating that land marketization reform and capital activity in a city and neighboring cities could promote ULDI. The reason for this might be that urban land bidding, auction, and listing (aspects of market-oriented reform) stimulated the market to optimize the spatial allocation of land resources. This had a positive effect, encouraging land users to improve ULDI. During the study period, capital activities significantly promoted the ULDI in the YRD. More than 62.5% of loans were used for long-term infrastructure businesses (e.g., development zone construction, factory, and mining enterprise operations) rather than real estate development (Gao et al., 2014). Meanwhile, the direct influence and spatial lag coefficients of FDI were significantly positive. This indicated globalization played an important role in the dynamic change of ULDI in the YRD. However, although the direct and indirect effects of international trade (IT) on ULDI were positive, the coefficient was small. This indicated that even though foreign trade promoted urban development due to the growth of the urban economic scale, ULDI did not increase significantly.
Considering the tax-sharing reform in 1994 and the imbalance between administrative affairs and financial rights, local governments began to depend on the income generated by the development of urban land. This practice was consistent with the finding that the direct influence coefficient of land finance demand (LF), as shown in Table 4, was significantly negative. The spatial lag coefficient was also negative, indicating that economic growth still largely depended on land factor inputs (Luo and Shen, 2009). However, local governments draw support from regional integration in the YRD to attract the production factors, and industrial activity should be encouraged to transfer from the central city to other underdeveloped areas (e.g., Wuxi-Xuzhou Development Zone, Changzhou-Yancheng Industrial Park, and Nanjing-Huaian Industrial Science Park.). Mutually beneficial cooperation among cities could compensate for the differences in the ULDI. Therefore, the direct influence coefficient of government competitiveness (GC) remains small. Urbanization was an important driving force for dynamic changes in the ULDI in the YRD. The direct influence coefficient of population urbanization (PU) was significantly negative. This indicated that the growth and agglomeration of the urban population could stimulate consumer consumption, promote economic growth, and increase the demand for urban land. The direct influence and spatial lag coefficients of economic urbanization (EU) were significantly positive. This indicated that economic activities had a significant and positive impact on the intensive use of urban land. In addition, economic development promoted the adjustment, optimization, and improvement of urban industrial structures (Zhao and Tang, 2018).

4.3.3 Decomposition of spatial effects

To explore the marginal effects of various factors on the evolution of ULDI, the spatial spillover effect of the SDM was decomposed using a partial differential equation, as shown in Table 5. The direct effect was the impact of the explanatory variable on the ULDI of a given city; the indirect effect was the impact of the explanatory variable on the ULDI of neighboring cities, and the total effect was the impact of the explanatory variable on the overall ULDI.
Table 5 Decomposed spatial effects of SDM with spatial fixed effects
Variables Direct Effect Indirect Effect Comprehensive Effect
LM 0.024** (2.11) 0.009** (2.18) 0.033*** (3.28)
CA 0.053*** (5.38) 0.048*** (3.93) 0.103** (2.52)
FDI 0.037*** (3.93) -0.031 (-0.81) 0.006** (2.03)
IT 0.157*** (2.76) -0.016 (-0.99) 0.141*** (2.72)
LF -0.018** (-2.24) -0.022*** (-3.13) -0.040** (-2.27)
GC 0.342*** (19.7) -0.042*** (3.54) 0.300*** (4.73)
PU 0.094*** (-4.92) -0.017** (-2.24) 0.077** (1.99)
EU 0.060*** (2.64) 0.034** (2.43) 0.094* (1.95)

Notes: ***, **, and * indicate that the results were credible at significant levels of 0.01, 0.05, and 0.1, respectively. Z values are in brackets.

When land marketization (LM) increased by 1%, the ULDI in each city increased by 0.24%, and the indirect spillover effect on other cities increased by 0.009%. This indicated that improving land marketization enhanced the ULDI in the given city and in neighboring cities. The direct effect of capital activity (CA) on ULDI was 0.053, and the indirect effect was 0.048; both values passed the significance test. The integrated planning and cooperation mechanism between cities in the YRD enabled capital elements to significantly interact with each other. FDI and international trade (IT) had positive direct effects. The results passed the significance test at a level of 0.01. However, the coefficient value was not large. This indicated that relying solely on foreign investment and international trade limited improvements in the ULDI.
The direct and indirect effects of land finance demand (LF) were significantly negative. This indicated that land finance, which was a means for local governments to balance budget revenue and expenditure, limited the level of ULDI. The direct effect of government competitiveness (GC) was high (0.342), indicating that a strong administrative hierarchy and economic development can ensure the cumulative benefit of land use by strengthening land consolidation, making good use of stock land, and optimizing allocation efficiency. The direct effect of population urbanization (PU) on ULDI was 0.094. In the process of urbanization, the spatial aggregation of migrant populations could promote ULDI in a city. For every 1% increase in economic urbanization (EU), ULDI in a given city and adjacent cities increased by 0.06% and 0.034%, respectively, an increase that was higher than that of other variables.

5 Discussion

5.1 Discussion

Changes of ULDI were complex, which indicates that national policies and urban planning departments have a certain guiding role in the direction of urban land (Barbosa et al., 2017). If there is no correct restriction of urban planning, the cities in the YRD will present a seriously unbalanced development state. As early as a decade ago, the government proposed to control the urban land and strictly protect the cultivated land (Gong et al., 2018). Perhaps because of this, the development trend of ULDI in the YDR is gradually shifting from core to periphery, which provides a new reference for future urban planning. Especially in the initial stage of urban land expansion, agglomeration development positively and slightly increases land use level in the YRD. Various actors and elements interact to develop land to meet the demand for space and resources arising from economic growth, which inevitably fuels enthusiasm for more land development (Pflüger and Tabuchi, 2010). In the analysis of the influence mechanism of ULDI, the degree of the individual explanatory variables within each type of influencing factor varied among regions. Therefore, under the support of a series of “smart” land policies, optimization of urban land use can be effective ways to better coordinate the relationships among land use, population, and development.
There are also some deficiencies in this study. Although the SDM used in this study generated a weight matrix based on geographical spatial proximity, it did not consider economic distance and time accessibility. In future research, we will conduct an in-depth analysis of the discrimination of spatial weight matrices and explore a feasible spatial optimization path for improving ULDI. The spatial heterogeneity of ULDI was the result of the interaction of various factors and scales, and the spatiotemporal differentiation between evaluation units was obvious. Since some explanatory variables have not been captured, the SDM model may lack some accuracy in interpreting the ULDI at the municipal level. The further work is still required to improve the prediction accuracy of the model. Therefore, based on the unique attributes of urban development and the existing status of land development, we will attempt to use a multidimensional and multi-level model method to execute an in-depth analysis of the pattern evolution and driving mechanism of ULDI.

5.2 Policy implications

Reasonable development of urban land resources is an important driving force for the orderly advancement of urbanization (Kuang et al., 2020). The results have important policy implications for urban land use in the YRD.
On one hand, policymakers should actively promote the coordinated development of different types of urban land use, transform the mode of urban development and optimize the structure, thereby achieving the high-quality urban development. Basically, urban land is one of the important aspects to support the social and economic development of mankind, which provides the basis for the realization of globalization. Therefore, in view of the structure and function of urban built-up land, we should under the guidance of the urban scientific development, enhance the scientific nature of urban planning, rationally allocate all kinds of land resources, strictly control the scattered land development model and implement a dense and compact urban land development strategy, so as to promote the strength of cities to participate in global competition.
On the other hand, policymakers should comprehensively evaluate the actual and optimal ULDI in different cities, and then develop targeted management strategies for urban land use. Cities at different development stages have different needs for urban construction land. With the further development of the city, the ULDI will gradually decline, and the coordination relationship between economic development and urban land use will change from primary coordination to high-quality coordination. In the process of marketization and decentralization, the development stage and functional orientations of the city should be fully recognized. It is essential for policymakers to explore pattern and mechanism innovation of urban land utilization during rapid urbanization. Especially construct the theoretical and methodological framework for analysis of ULDI. It is the fundamental work to grasp the optimal ULDI for cities with various population sizes and functional orientations.

6 Conclusions

This study provides valuable insights and detailed evidence for reviewing the existing land policies, making improved or new land and urban planning for sustainable development. The average ULDI value in the YRD was at a medium level of 0.248. Regarding the time sequence, ULDI in the YRD continued to rise significantly, with an average annual growth of 4.08%. However, after 2008, the growth rate slowed to 2.66%. This time node could be related to the 2008 global financial crisis. In terms of spatial evolution, ULDI in the YRD varied greatly among the different cities. The core-periphery layout features were significant. The high-value areas were concentrated in Shanghai and southern Jiangsu, a finding that was consistent with the level of social and economic development in these cities. Furthermore, the indicated that ULDI was not independent in space but had a strong high (low) agglomeration distribution. H-H areas were concentrated in Shanghai and Suzhou, and the local spatial pattern had a certain level of stability and possessed spatial dependence characteristics. The L-H district was located in the southern part of the YRD, and its economic development was endogenous. Industrial and mining enterprises had a scattered layout, and blind land occupation and inefficient use were prevalent, indicating that ULDI needed to be improved.
In conclusion, the factors of marketization, globalization, decentralization, and urbanization jointly affect ULDI in the YRD. Particularly marketization relating to the continuous improvement of land marketization, optimized the spatial allocation of land resources. Land market reforms further intensified the capitalization of land resources. Bank credit loans were used mainly for long-term capital construction businesses, which encouraged urban land users to improve ULDI. The combination of intensive labor and scarce land resources significantly promoted ULDI in the YRD. In other words, a larger population is shown to have a stronger influence on urban land development, confirming that population growth is the basic driving force behind land development activities. International trade had little influence on the dynamic change in the ULDI in the YRD. Decentralization compelled local governments to rely excessively on land finance; given the imbalance between local affairs and fiscal rights, the result was a disorderly spread of urban space and low ULDI. In contrast, population growth and agglomeration in the process of urbanization stimulated the residents’ consumption capacity, promoted economic growth, and created a greater demand for urban land. However, development and utilization levels were low in underdeveloped areas, which restricted the improvement of the ULDI.
[1]
Alcock I, White M, Cherrie M et al., 2017. Land cover and air pollution are associated with asthma hospitalisations: A cross-sectional study. Environment International, 109: 29-41.

DOI PMID

[2]
Anselin L, Bongiovanni R, Lowenberg-DeBoer J, 2004. A spatial econometric approach to the economics of site-specific nitrogen management in corn production. American Journal of Agricultural Economics, 86(3): 675-687.

DOI

[3]
Aydin C, Esen Ö, 2018. Does the level of energy intensity matter in the effect of energy consumption on the growth of transition economies? Evidence from dynamic panel threshold analysis. Energy Economics, 69: 185-195.

DOI

[4]
Bai C E, Du Y J, Tao Z G et al., 2004. Local protectionism and regional specialization: evidence from China’s industries. Journal of International Economics, 63(2): 397-417.

DOI

[5]
Bai X M, Chen J, Shi P J, 2011. Landscape urbanization and economic growth in China: Positive feedbacks and sustainability dilemmas. Environmental Science & Technology, 46(1): 132-139.

DOI

[6]
Bai X M, Shi P J, Liu Y S, 2014. Realizing China’s urban dream. Nature, 509: 158-160.

DOI

[7]
Barbosa A, Vallecillo S, Baranzelli C et al., 2017. Modelling built-up land take in Europe to 2020: an assessment of the Resource Efficiency Roadmap measure on land. Journal of Environmental Planning and Management, 60(8): 1439-1463.

DOI

[8]
Chen H, Zhang J X, Chen H S, 2015. The transformation of land dividend under the perspective of new urbanization. Economic Geography, 35(4): 1-8. (in Chinese)

DOI

[9]
Chen M X, Liu W D, Lu D D et al., 2018. Progress of China’s new-type urbanization construction since 2014: A preliminary assessment. Cities, 78: 180-193.

DOI

[10]
Deng X Z, Huang J K, Rozelle S et al., 2010. Economic growth and the expansion of urban land in China. Urban Studies, 47(4): 813-843.

DOI

[11]
Di X H, Hou X Y, Wang Y d et al., 2015. Spatial-temporal characteristics of land use intensity of coastal zone in China during 2000-2010. Chinese Geographical Science, 25(1): 51-61.

DOI

[12]
Donkelaar A, Martin R, Brauer M et al., 2014. Use of satellite observations for long-term exposure assessment of global concentrations of fine particulate matter. Environmental Health Perspectives, 123(2): 135-143.

DOI

[13]
Elhorst J P, 2003. Specification and estimation of spatial panel data models. International Regional Science Review, 26(3): 244-268.

DOI

[14]
Ferdous N, Bhat C R, 2013. A spatial panel ordered-response model with application to the analysis of urban land-use development intensity patterns. Journal of Geographical Systems, 15(1): 1-29.

DOI

[15]
Gao J L, Wei Y D, Chen W et al., 2014. Economic transition and urban land expansion in provincial China. Habitat International, 44: 461-473.

DOI

[16]
Gong J Z, Jiang C, Chen W L et al., 2018. Spatiotemporal dynamics in the cultivated and built-up land of Guangzhou: Insights from zoning. Habitat International, 82: 104-112.

DOI

[17]
Gu Y Z, Zheng S Q, 2010. The impacts of rail transit on property values and land development intensity: The case of No.13 Line in Beijing. Acta Geographica Sinica, 65(2): 213-223. (in Chinese)

DOI

[18]
Güneralp B, Seto K C, Ramachandran M, 2013. Evidence of urban land teleconnections and impacts on hinterlands. Current Opinion in Environmental Sustainability, 5(5): 445-451.

DOI

[19]
Handy S, 2005. Smart growth and the transportation-land use connection: What does the research tell us? International Regional Science Review, 28(2): 146-167.

DOI

[20]
He C, Zhou Y, Huang Z, 2016. Fiscal decentralization, political centralization, and land urbanization in China. Urban Geography, 37(3): 436-457.

DOI

[21]
He C F, Huang Z J, Wang R, 2013. Land use change and economic growth in urban China: A structural equation analysis. Urban Studies, 51(12): 2880-2898.

DOI

[22]
He C F, Zhu S J, 2007. Economic transition and industrial restructuring in China: Structural convergence or divergence? Post-Communist Economies, 19(3): 317-342.

DOI

[23]
He H J, Peng C, 2017. The spatial-temporal evolution and the interactive effect between urban industrial structure transformation and land use efficiency. Geographical Research, 36(7): 1271-1282. (in Chinese)

DOI

[24]
Huang Z J, Wei Y D, He C F et al., 2015. Urban land expansion under economic transition in China: A multi-level modeling analysis. Habitat International, 47: 69-82.

DOI

[25]
Jin H F, Wan L L, Zhang C, 2011. The impact of international financial crisis on China’s export trade. Studies of International Finance, (9): 58-68.

[26]
Kuang B, Lu X H, Han J et al., 2020. How urbanization influence urban land consumption intensity: Evidence from China. Habitat International, 100: 102103.

DOI

[27]
Li Y R, Wei Y D, 2010. The spatial-temporal hierarchy of regional inequality of China. Applied Geography, 30(3): 303-316.

DOI

[28]
Lichtenberg E, Ding C R, 2008. Assessing farmland protection policy in China. Land Use Policy, 25(1): 59-68.

DOI

[29]
Lin G C, Ho S P, 2003. China’s land resources and land-use change: Insights from the 1996 land survey. Land Use Policy, 20(2): 87-107.

DOI

[30]
Lin G C, Ho S P, 2005. The state, land system, and land development processes in contemporary China. Annals of the Association of American Geographers, 95(2): 411-436.

DOI

[31]
Lin G C, Li X, Yang F F et al., 2014. Strategizing urbanism in the era of neoliberalization: State power reshuffling, land development and municipal finance in urbanizing China. Urban Studies, 52(11): 1962-1982.

DOI

[32]
Liu B, Jane Y Y, Wu J et al., 2011a. Development zones in China: Are STIPs a substitute for or a complement to ETDZs? Taipei Economic Inquiry, 47(1): 97-145. (in Chinese)

[33]
Liu H, Zhang Y, Zheng W S, 2011b. Evaluation on spatio-temporal development and interaction of intensive urban land use and urbanization: Case studies of the cities in the Bohai Rim region. Geographical Research, 30(10): 1805-1817. (in Chinese)

[34]
Liu Y S, Li J T, Yang Y Y, 2018. Strategic adjustment of land use policy under the economic transformation. Land Use Policy, 74: 5-14.

DOI

[35]
Liu Y S, Yang R, Long H L et al., 2014. Implications of land-use change in rural China: A case study of Yucheng, Shandong province. Land Use Policy, 40: 111-118.

DOI

[36]
Long H L, Zou J, Liu Y S, 2009. Differentiation of rural development driven by industrialization and urbanization in eastern coastal China. Habitat International, 33(4): 454-462.

DOI

[37]
Lu R, 2011. Building engines for growth and competitiveness in China: Experience with special economic zones and industrial clusters. Regional Studies, 45(9): 1292-1293.

DOI

[38]
Luo X L, Shen J F, 2009. A study on inter-city cooperation in the Yangtze River Delta region, China. Habitat International, 33(1): 52-62.

DOI

[39]
Pannell C W, 2002. China’s continuing urban transition. Environment and Planning A: Economy and Space, 34(9): 1571-1589.

DOI

[40]
Pei C H, Peng L, Zheng W, 2011. Transforming the foreign trade development mode: An empirical and theoretical analysis. Social Sciences in China, (1): 77-87, 222. (in Chinese)

[41]
Pflüger M, Tabuchi T, 2010. The size of regions with land use for production. Regional Science and Urban Economics, 40(6): 481-489.

DOI

[42]
Son J Y, Kim H, Bell M L, 2015. Does urban land-use increase risk of asthma symptoms? Environmental Research, 142: 309-318.

DOI

[43]
Sung H, Lee S, 2015. Residential built environment and walking activity: Empirical evidence of Jane Jacobs’ urban vitality. Transportation Research Part D: Transport and Environment, 41: 318-329.

DOI

[44]
Tan S H, Zhang Q, Jiang X et al., 2013. A study on land development intensity guided by the positive and negative factors: Illustrated by the case of Master Plan of Xishui County. Human Settlements Forum in West China, (6): 64-70. (in Chinese)

[45]
Tao R, Su F B, Liu M H et al., 2010. Land leasing and local public finance in China’s regional development: Evidence from prefecture-level cities. Urban Studies, 47(10): 2217-2236.

DOI

[46]
Tian L, Ma W J, 2009. Government intervention in city development of China: A tool of land supply. Land Use Policy, 26(3): 599-609.

DOI

[47]
Wang J, 2013. The economic impact of special economic zones: Evidence from Chinese municipalities. Journal of Development Economics, 101: 133-147.

DOI

[48]
Wang S J, Fang C L, Wang Y et al., 2015. Quantifying the relationship between urban development intensity and carbon dioxide emissions using a panel data analysis. Ecological Indicators, 49: 121-131.

DOI

[49]
Wang S J, Su Y X, Zhao Y B, 2018. Regional inequality, spatial spillover effects and influencing factors of China’s city-level energy-related carbon emissions. Acta Geographica Sinica, 73(3): 414-428. (in Chinese)

[50]
Wei S H, Li J, Li Z Y et al., 2020. Spatio-temporal evolution and its influencing factors of China’s agricultural competitiveness. Acta Geographica Sinica, 75(6): 1287-1300. (in Chinese)

[51]
Wei Y D, 2001. Dencentralization, marketization and globalization: The triple process underlying regional development in China. Asian Geographer, 20: 7-23.

DOI

[52]
Wei Y D, 2015. Zone fever, project fever: Development policy, economic transition, and urban expansion in China. Geographical Review, 105(2): 156-177.

DOI

[53]
Wei Y D, Li W M, 2002. Reforms, globalization, and urban growth in China: The case of Hangzhou. Eurasian Geography and Economics, 43: 459-475.

DOI

[54]
Wei Y D, Ye X Y, 2014. Urbanization, land use, and sustainable development in China. Stochastic Environmental Research and Risk Assessment, 28(4): 755-755.

DOI

[55]
Whittemore A H, BenDor T K, 2018. Talking about density: An empirical investigation of framing. Land Use Policy, 72: 181-191.

DOI

[56]
Wu C Y, Wei Y D, Huang X J et al., 2017. Economic transition, spatial development and urban land use efficiency in the Yangtze River Delta, China. Habitat International, 63: 67-78.

DOI

[57]
Wu Y Z, Zhang X L, Skitmore M et al., 2014. Industrial land price and its impact on urban growth: A Chinese case study. Land Use Policy, 36: 199-209.

DOI

[58]
Xu F, Chi G Q, 2019. Spatiotemporal variations of land use intensity and its driving forces in China, 2000-2010. Regional Environmental Change, 19(8): 2583-2596.

DOI

[59]
Xu G L, Huang X J, Zhong T Y et al., 2015. Assessment on the effect of city arable land protection under the implementation of China’s National General Land Use Plan (2006-2020). Habitat International, 49: 466-473.

DOI

[60]
Yan H M, Liu F, Liu J Y et al., 2017. Status of land use intensity in China and its impacts on land carrying capacity. Journal of Geographical Sciences, 27(4): 387-402.

DOI

[61]
Yang J, Zeng C, Cheng Y J, 2020a. Spatial influence of ecological networks on land use intensity. Science of The Total Environment, 717: 137151.

DOI

[62]
Yang J W, Li G C, 2014. Fiscal and spatial characteristics of metropolitan government and planning in China: Understanding centralization trends in a decentralization context. Habitat International, 41: 77-84.

DOI

[63]
Yang Q K, Duan X J, Ji Z F et al., 2020b. Spatiotemporal differentiation and influencing mechanism of urban land development intensity in the Yangtze River Delta. Resources Science, 42(4): 723-734. (in Chinese)

[64]
Yew C P, 2011. Explaining land use change in a Guangdong county: The supply side of the story. The China Quarterly, 207(1): 626-648.

DOI

[65]
Zhang J K, Che Y, Huang X J, 2017. Assessment of the equilibrium degree and limitation degree of Yangtze River Economic Belt’s land development. Resources and Environment in the Yangtze Basin, 26(12): 1945-1953. (in Chinese)

[66]
Zhang L X, Bi X, Huang Z J, 2020a. Urban industrial land use efficiency under the background of economic transformation in the Yangtze River Economic Belt. Resources Science, 42(9): 1728-1738. (in Chinese)

[67]
Zhang P Y, Yang D, Qin M Z et al., 2020b. Spatial heterogeneity analysis and driving forces exploring of built-up land development intensity in Chinese prefecture-level cities and implications for future urban land intensive use. Land Use Policy, 99: 104958.

DOI

[68]
Zhang Y H, Chen J L, Gao J L et al., 2019. The impact mechanism of urban land use efficiency in the Yangtze River Delta from the perspective of economic transition. Journal of Natural Resources, 34(6): 1157-1170. (in Chinese)

DOI

[69]
Zhang Z X, Wen Q K, Liu F et al., 2016. Urban expansion in China and its effect on cultivated land before and after initiating “Reform and Open Policy”. Science China Earth Sciences, 59(10): 1930-1945.

DOI

[70]
Zhao J F, Tang J M, 2018. Industrial structure change and economic growth: A China-Russia comparison. China Economic Review, 47: 219-233.

DOI

[71]
Zhao Y L, Liu Y Z, Long K S, 2012. Features and influencing factors of development intensity of urban land resources in the Yangtze River Delta. Resources and Environment in the Yangtze Basin, 21(12): 1480-1485. (in Chinese)

[72]
Zhou D, Xu J C, Wang L et al., 2015. Assessing urbanization quality using structure and function analyses: A case study of the urban agglomeration around Hangzhou Bay (UAHB), China. Habitat International, 49: 165-176.

DOI

[73]
Zhu J M, 2005. A transitional institution for the emerging land market in urban China. Urban Studies, 42(8): 1369-1390.

DOI

Outlines

/