Research Articles

Evolution and obstacle factors of high-quality industrial development in the π-shaped Curve Area of the Yellow River basin in China

  • SUN Yifang , 1, 2 ,
  • WANG Ninglian , 1, *
Expand
  • 1. Shaanxi Key Laboratory of Earth Surface System and Environmental Carrying Capacity, Northwest University, Xi’an 710027, China
  • 2. Yan’an University, Yan’an 716000, China
* Wang Ninglian, PhD and Professor, specialized in glacial water resources and global change research. E-mail:

Sun Yifang, PhD Candidate, specialized in ecological economics and human geography. E-mail:

Received date: 2022-04-18

  Accepted date: 2022-08-08

  Online published: 2022-12-25

Supported by

National Natural Science Foundation of China(42130516)

Abstract

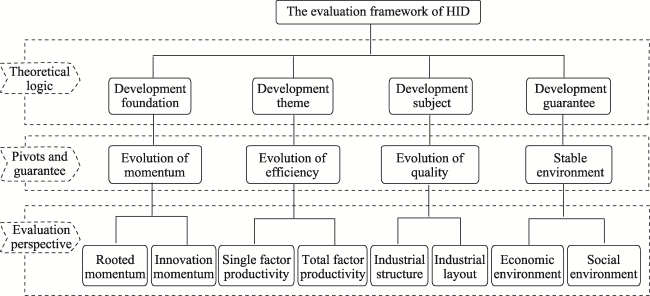
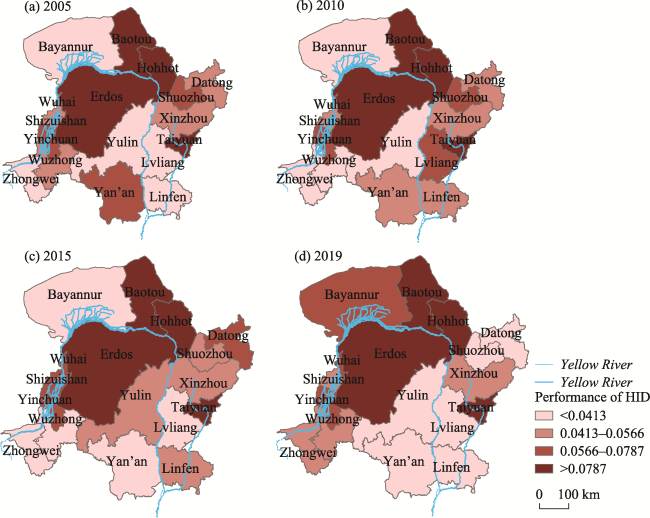
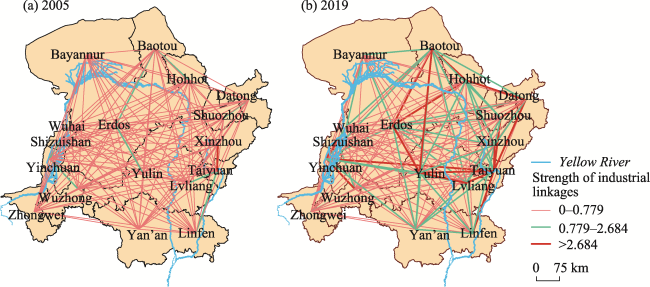
High-quality industrial development (HID) is a requirement of the modern economy and regional development. This paper designed a four-dimensional HID evaluation framework according to the logic of “development foundation-development theme-development subject-development guarantee.” Specifically, momentum cultivation as the foundation, efficiency improvement as the theme, and quality promotion as the subject are the three pivots driving the industrial transformation from high-speed development to high-quality development. A stable economic environment and a harmonious social environment are the guarantees of HID. Choosing the π-shaped Curve Area of the Yellow River basin in China as the study area, this paper measured the spatiotemporal pattern of HID and its four dimensions using the entropy-weighted TOPSIS method based on relevant economic indicators. Besides, the obstacle recognition model was adopted to identify the obstacles to HID. Findings include: From 2005 to 2019, the HID in the Curve Area was characterized by spatial unevenness and relative stability. The industrial structure and industrial layout were more rational in provincial capitals and large cities than in other cities. The spatial organization of the industrial economy presented an incompact polycentric structure, and the industrial association was relatively weak in the curve’s upper reaches. Almost all cities have experienced an increase in single-factor productivity, and technological progress contributed most to the total factor productivity growth. During the study period, the development momentum stabilized at high levels in Inner Mongolia while at low levels in resource-based cities. The development environment in most cities has remained stable, and the social welfare has increased and distributed more equitably in the Area. The technological introduction and the rationalization of the industrial structure were the primary obstacle factors for the Area in realizing HID, and the upgrading of the industrial location index was critical to the upper reaches of the curve. This paper was expected to provide new ideas for studying industrial transformation and practical policy proposals for regional development in the Curve Area.

Cite this article

SUN Yifang , WANG Ninglian . Evolution and obstacle factors of high-quality industrial development in the π-shaped Curve Area of the Yellow River basin in China[J]. Journal of Geographical Sciences, 2022 , 32(12) : 2430 -2452 . DOI: 10.1007/s11442-022-2055-9

1 Introduction

The Report of the 19th National Congress of the Communist Party of China (2017) pointed out that China’s economy has shifted from a stage of high-speed growth to a stage of high-quality development, and it is necessary to promote the transforms in the quality, efficiency, and momentum of economic development (Ren and He, 2019). High-quality development has become a strategic deployment to promote economic development in the new era (Pan et al., 2021; SC, 2021), and high-quality industrial development (HID), as an essential part of economic development, has become the development requirement of the modern economy (Yang et al., 2021). At present, scholars have not reached a consensus on the connotation of HID, and multi-perspective and multi-dimensional analysis coexisted. Liu and Wu (2019) believed that the essence of HID is to judge the desirability of industrial development and forms new development concept, development objective, development momentum, and operation mechanism according to local conditions. Li and Han (2021) considered HID to be the optimization of industrial quality, efficient operation of the industrial ecosystem, and improvement of industrial efficiency. Yu et al. (2021) thought HID should emphasize not only the rationality of scale and proportion of industry but also the economic, environmental, and social benefits of the industry under the guidance of the new development concept. Tu (2018) proposed an evaluation framework for HID from three aspects: supply structure, production efficiency, and value creation. Liu (2021) argued that HID should cover economic growth, structure optimization, competitiveness improvement, and cluster upgrading, the core of which is the transformation of the growth mode caused by innovation. Fu and Yang (2020) proposed that the degree of industrial development to meet people’s growing demand for a better life was an essential criterion for judging HID. This paper defined HID as the realization of the organic unity of momentum upgrading, quality promotion, efficiency and environment optimization, and value maximization of industrial systems. Only by determining the scientific evaluation standards can we find out the factors influencing the HID. Therefore, it is urgent to build a multi-dimensional and operable evaluation framework for China’s HID.
However, most of the existing literature on HID was qualitative research focused on interpreting HID connotations. Quantitative studies on industrial development mainly focused on one aspect, such as industrial productivity, industrial structure, industrial competitiveness, and spatial layout of a specific industry, such as manufacturing (Shamkhi et al., 2021), agriculture (Zhang et al., 2022), logistics industry (Cho and Lee, 2020), service industry (Tsai, 2020), and tourism (Zhang et al., 2017). It could be seen that the existing research failed to study HID from the macro perspective and ignored the theory and standard of industrial economics. This paper drew on the theories of the industrial economy and constructed an evaluation index system for HID according to the idea of “connotation interpretation - logic analysis - evaluation system construction”. Taking the π-shaped Curve Area of China as the empirical area, this paper evaluated the HID level of this region from 2005 to 2019, so as to verify the scientific nature of the evaluation framework constructed in this paper.

2 The logic for the construction of HID evaluation framework

The Report of the 19th National Congress of the Communist Party of China pointed out that as China’s economy shifts to a stage of high-quality development, it is imperative to promote the reform of quality, efficiency, and momentum of economic development, and to improve total factor productivity. The existing literature has made supplementary research on the connotation of high-quality development. High-quality development is a new economic structure that pursues the new development momentum, the efficiency of factor allocation, and the coordinated development of the economy and society after the economic scale has expanded to a certain extent. Unlike high-speed economic development, high-quality development abandons the sole pursuit of economic growth and emphasizes quality-led, efficiency-based, and innovation-driven growth in both quality and quantity (Zhang, 2019). The reform of momentum, efficiency, and quality not only promotes the transformation of industrial development to a new model but also clarifies the path of HID.
This paper argued that HID is represented by efficiency increase, quality improvement, and new momentum cultivation under a stable socio-economic environment based on the existing research. The innovations of the paper lie in the following two points: first, this paper designed a four-dimensional HID evaluation framework that included “three pivots and one guarantee” according to the logic of “development foundation - development theme - development subject - development guarantee.” Specifically, momentum cultivation as the basis of development, efficiency evolution as the theme of development, and quality evolution as the subject of development are the three pivots to promote the industrial transformation from high-speed development to high-quality development, and a stable economic environment and a harmonious social environment is the guarantee of HID (Figure 1). Second, most of the existing studies on HID were carried out from the perspective of industrial economics. There was no combination of watershed economy with a high-quality development strategy that revealed the spatiotemporal pattern and evolution mechanism of HID from the perspective of geography (Li and Wang, 2022). The study of HID for a particular geographical unit is not only a theoretical extension of high-quality development and industrial transformation but also a practical study of regional development that can be accurately measured, scientifically evaluated, and macro-regulate. As a particular geographical unit, the Yellow River basin has natural connections and consistent development goals between the upstream and downstream and between the north and south banks. Moreover, as a typical region of intensive resource-based industries, the Curve Area of the Yellow River basin was experiencing industrial transformation. Therefore, this paper takes the Curve Area as the study area to explore the characteristics of industrial evolution from the perspective of spatiotemporal evolution and provide policy suggestions for regional development.
Figure 1 The evaluation framework of high-quality industrial development

2.1 Evolution of momentum-development foundation

Industrial momentum is the driving force that stimulates the expansion of industry and the optimization and upgrading of industrial structures (Hong et al., 2022; Sheng et al., 2022). Under the influence of the extensive growth mode, imbalanced industrial development needs to be confronted. Therefore, the promotion of HID should not only rely on increasing resource input but emphasizes the joint effect of rooted momentum and innovative momentum, which is the foundation to realize HID. Under the background of high-quality development, the driving momentum of industrial development changes from the investment of capital to the investment of scientific and technological innovation. The former could represent the rooted momentum while the latter denote the innovative momentum. Innovation is the driving force for enhancing competitiveness and maintaining the vitality of the industry. While changing traditional industrial models and organizational forms, emerging technologies could spawn new industrial formats, improve the added value of products, and promote the extension of the industrial chains and the integration of related industries.

2.2 Evolution of efficiency-development theme

Industrial efficiency reflects industrial competitiveness and is an important determinant of the quality of economic growth. Industries should realize intensive development by improving the single factor productivity and total factor productivity (TFP) (Gill et al., 2007). Resource input plays a significant role in the primary stage of industrial development, while at the intermediate and advanced stages, technical efficiency is the key to HID. Over the years, China’s industry has relied on policy dividends to form extensive growth, and the scale has expanded significantly. In the HID process, the improvement of factor productivity is key to efficiency reform. High quality and high efficiency are complementary, and the optimal allocation of industrial factors is the main line of high-quality development, which runs through the whole process of HID.

2.3 Evolution of quality-development subject

Quality reform is a process in which the focus of industrial development changes from the pursuit of output growth to the overall consideration of industrial structure adjustment and industrial layout optimization, which is the main body of HID. From the perspective of the enterprise, HID represents the improvement of product quality. From the perspective of the industrial system, HID represents a development model with more intensive utilization of resources, higher added value, and more optimized value chains. From the perspective of the macroeconomy, HID represents a more complete industrial system, a more scientific development model, and a more diversified industrial format. Labor transfer and factor allocation brought about by industrial restructuring can positively contribute to the quality improvement of economic development (Chen et al., 2020). There is a structural dividend and dynamic equilibrium relationship between industrial structure and HID, which is reflected in the rationalization and advancement of industrial structure (Liu et al., 2017). The industrial layout also affects the quality of industrial development. The industrial layout can be evaluated from three dimensions: industrial diversification, industrial specialization, and industrial location degree. Marshall (1920) argued that industrial specialization could accelerate knowledge spillovers and promote industrial growth through competition, imitation, and resources migration. Jacobs (1969) believed that knowledge dissemination mainly comes from outside the same industrial agglomerations, and industrial diversification could also promote innovation and economic growth. An efficient industrial association network is a necessary condition for regional HID. The research on the locational characteristics of different cities and the industrial correlations between cities is not only of great theoretical significance to understanding the role of “place and space” in economic activities, which is a core proposition of economic geography, but also has great practical value for regional development and planning (Miao and Wang, 2012).

2.4 Evolution of environment-development guarantee

While adjusting the industrial structure and creating new industrial space, it is necessary to realize the synergistic improvement of economic value and social value during the transformation of HID. The stability of the economic system is a critical theoretical dimension that constitutes the connotation of high-quality development, and the maintenance of robust economic growth is a prerequisite for HID. In contrast, excessive economic fluctuations are harmful to the efficiency of economic operations (Ehigiamusoe et al., 2020). The sharing of social welfare means that the fruits of industrial development are shared by all citizens, and the ultimate goal of economic growth is to improve people’s livelihoods (Bruntland, 1987). Ignorance of the social environment can result in insufficient domestic demand, polarization between rich and poor, underinvestment in human capital, and may even lead to social conflicts and undermine social stability. A stable economic environment and a harmonious social environment are essential guarantees for HID.

3 Data and methods

3.1 Study area and data sources

The study area of this paper is the “π-shaped” Curve Area in the Yellow River basin, which includes 17 cities in four provinces (Figure 2) (Sun and Wang, 2022). Based on the vigorous development of the energy and chemical industry, the Curve Area has become an important economic growth pole in West China. However, problems such as blind expansion, repetitive construction, homogeneous competition, short industrial chain, and environmental pollution were also very prominent. In the context of high-quality development and energy revolution, it is urgent and critical to analyze the problems during the industrial development in the Area and promote industrial transformation.
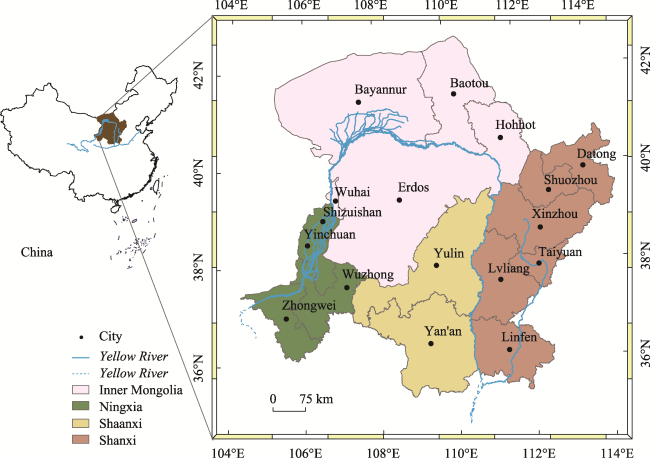
Figure 2 The location of the Curve Area in the Yellow River basin
The data in this paper came from the China Urban Statistical Yearbook (NBS, 2005-2019), China Urban Construction Statistical Yearbook (MHURD, 2005-2019), China Forestry and Grassland Statistical Yearbook (NFGA, 2005-2019), Shaanxi Statistical Yearbook (Shaanxi PBS, 2005-2019), Shanxi Statistical Yearbook (Shanxi PBS, 2005-2019), Ningxia Statistical Yearbook (Ningxia PBS, 2005-2019), Inner Mongolia Statistical Yearbook (IMBS, 2005-2019), and statistical yearbooks of 17 prefecture-level cities (BCS, 2005-2019).

3.2 The HID evaluation framework

This paper designed a four-dimensional HID evaluation framework that included “three pivots and one guarantee” according to the logic of “development foundation - development mainline - development subject - development guarantee.” Specifically, the first pivot was the evolution of momentum as the foundation for HID. The promotion of HID cannot rely on resource input alone but emphasize the joint action of rooted power and innovative power in the practice of HID. The second pivot was the evolution of efficiency as the development theme of HID. The third pivot was the evolution of quality as the main body of HID, which emphasize the overall consideration of the rational industrial structure and distribution. The stability of the economic system is a prerequisite for quality-oriented growth, and the sharing of achievements is a guarantee for promoting quality development and avoiding social unrest.

3.2.1 Development foundation-evolution of development momentum

This paper put forward that the development momentum is composed of rooted force and innovation force. The former refers to GDP growth rate and per capita GDP, and the latter includes technological innovation and institutional innovation. There are two ways of technological innovation: independent research and technology introduction. The former can be measured by the proportion of R&D investment in GDP, and the latter can be analyzed by the ratio of foreign direct investment (FDI) to the total social fixed assets investment (Fu et al., 2011). This paper chose the marketization rate of the income distribution: the proportion of wages excluding state-owned units and urban collective units to total wages to denote institutional innovation (Hong et al., 2022).

3.2.2 Development theme-evolution of development efficiency

The evolution of efficiency was evaluated from four aspects: labor productivity, capital productivity, energy efficiency, and total factor productivity (TFP). Labor productivity reflects the value created by a worker, represented by the ratio of GDP to the number of employees in society. Capital productivity denotes the output created per unit of capital input, indicated by the ratio of GDP to the amount of fixed asset investment (stock) in society. Energy efficiency characterizes the value generated per unit of energy consumed, represented by the ratio of GDP to energy consumption. TFP reflects the impact of non-material inputs such as technological progress, organizational innovation, and production innovation on output (Cutler and Davies, 2010). In this paper, the Malmquist index is chosen to calculate TFP under the condition of Constant Returns to Scale. The Malmquist index can be decomposed into the product of technical efficiency change (Effch) and technical progress change (Techch) (Huang et al., 2017). Techch represents process improvement and technological innovation, while Effch indicates the change of scale and structure. Effch can be decomposed into the product of pure technical efficiency change (Pech) and scale efficiency change (Sech) (Sun and Wang, 2021b). Since the Malmquist index characterizes the change of quantity rather than the absolute quantity, the cumulative rate of change of the Malmquist index is also measured by referring to (Xu and Wang, 2010).

3.2.3 Development subject-evolution of development quality

The evaluation of quality evolution included the structural adjustment represented by the rationalization and upgrading of industrial structure and the optimization of industrial layout embodied by industrial diversification, specialization, and location promotion (Cui et al., 2021).
(1) Adjustment of industrial structure
In this paper, the ratio of the tertiary industry to the secondary industry was selected to represent the upgrading level of the industrial structure, and the Theil index was used to measure the rationality of the industrial structure (Zheng et al., 2021).
$T L=\sum_{i=1}^{n}\left(\frac{Y_{i}}{Y}\right) \ln \left(\frac{Y_{i}}{L_{i}} / \frac{Y}{L}\right)$
where TL represents the deviation degree of industrial structure; Yi represents the added value of the i industry; Li represents the number of workers engaged in industry i; Y stands for GDP; L represents the sum of the labor force; N indicates the number of industry sectors. The smaller the TL, the more rational the industrial structure is.
(2) Optimization of industrial layout
This paper studied the spatial layout of industries by evaluating the industrial specialization level, industrial diversification level, and industrial locational degree. This paper used location entropy to denote the industrial specialization level (Huang et al., 2020).
$L Q=\frac{I_{i c} / I_{i a}}{L_{c} / L_{a}}$
where LQ is the industry specialization index. Iic is the number of manufacturing employees in city i, Iia is the number of all employees in a city i; Lc is the number of manufacturing employees nationwide, and La is the total number of employments nationwide. The higher the LQ value is, the higher the specialization level of the manufacturing industry is.
This paper referred to the method proposed by Li and Song (2008) to measure the industrial diversification level.
$D I=1 / \sum\left|I_{i j}-L_{j}\right|$
where DI is the industrial diversification index, Iij is the share of employment in industry j to the total employment in the city i, and Lj is the share of industry j to the national share. The smaller the DI is, the lower the degree of industrial diversification is.
This paper uses the gravity model to obtain the strength of industrial linkages between cities and the industrial location index (Miao and Wang, 2012; He et al., 2017).
$T_{i j}=W \frac{\sqrt{P_{i} G_{i}} * \sqrt{P_{j} G_{j}}}{D_{i j}^{b}}$
$D_{i j}=S_{i j} * \frac{F_{i j}}{t_{i j}}$
$L I_{i}=\sum_{j=1}^{n} T_{i j} / \sum_{i=1}^{n} \sum_{j=1}^{n} T_{i j}$
where LIi is the industrial location index of city i, Tij is the industrial linkage between city i and city j; Pi and Pj denote the employed population of secondary and tertiary industries in city i and city j; Gi and Gj are the value-added of secondary and tertiary industries. W is the empirical constant 1, which equals 1 here; b is the distance coefficient, which equals 2 here. Dij is the time distance between cities.
Previous studies usually use the mileage of intercity railroad to characterize the spatial distance between cities, which is difficult to explain the economic connections among cities due to the upgrading transportation infrastructure. Here, the time distance is introduced to correct the spatial distance (Equation 5), where Sij represents the distance of the route that takes the shortest time to link city i with city j via road traffic, and Fij is the time required. tij is the time required to link city i with city j via the shortest distance.

3.2.4 Development guarantee-stable development environment

A stable development environment includes a stable economic environment and a harmonious social environment (Wei and Li, 2018). A stable economic environment means that the economic system remains stable in its operation, and important economic parameters fluctuate narrowly within a reasonable range. This paper examined economic stability from three aspects: economic growth fluctuation, inflation rate, and employment fluctuations. Economic growth fluctuation is the growth degree of the current year’s GDP growth rate relative to the previous year’s GDP growth rate. The Consumer Price Index was used to indicate the inflation rate, and employment fluctuations were measured by the unemployment rate.
The fruits of industrial development are shared by all citizens and drive the industrial transformation, which can be evaluated from two aspects: development welfare and achievement sharing. The former examines the improvement of residents' welfare brought about by industrial development, and this paper chose the number of years of education per capita, the number of medical technicians per 10,000 people, and the road mileage per capita to measure the welfare degree. The latter involved the measurement of income distribution represented by the Gini coefficient of GDP and the ratio of urban and rural residents’ income (Ding and Liu, 2017; Sun and Zhu, 2020).

3.3 The entropy-weighted TOPSIS method

Technique for Order Preference by Similarity to an Ideal Solution (TOPSIS), which is an effective method in multi-objective decision analysis, was adopted to measure the HID level in this paper (Sun and Wang, 2021a; Chen et al., 2022). The specific calculation steps were as follows:
Step 1: Construction of the normalization matrix.
$\left\{Z_{i j}\right\}_{m^{*} n}=\left\{w_{i j} x_{i j}\right\}_{m^{*} n}$
where wij is the weight of the j indicator in the year i calculated by the entropy-weighted method and xij is the indicator’s dimensionless value.
Step 2: Determine the positive ideal solution Z+ and the negative ideal solution Z-.
$Z_{i}^{+}=\left\{\max Z_{i j} \mid i=1,2, \cdots, m\right\}$
$Z_{i}^{-}=\left\{\min Z_{i j} \mid i=1,2, \cdots, m\right\}$
Step 3: Measure the distance of each scheme to the positive and the negative ideal solutions.
$S_{i}^{+}=\sqrt{\sum_{j=1}^{m}\left(Z_{i j}-Z_{i}^{+}\right)^{2}}$
$S_{i}^{-}=\sqrt{\sum_{j=1}^{m}\left(Z_{i j}-Z_{i}^{-}\right)^{2}}$
Step 4: The relative closeness of a feasible solution to an ideal solution is defined as:
$T_{j}=\frac{S_{i}^{-}}{S_{i}^{+}+S_{i}^{-}}$
where Tj represents the closeness of the evaluation target to the optimal solution in each year, and its value ranges from [01]. The larger the value, the closer the industrial development is to the optimal level.

3.4 Obstacle recognition model

The obstacle recognition model was used to identify the obstacles for HID in the Curve Area (Xu et al., 2019; Zhang et al., 2021; Bai et al., 2022). The calculation formula is as follows.
$U_{i j}=1-x_{i j}$
$O_{j}=\frac{U_{i j} G_{j}}{\sum_{j=1}^{n} U_{i j} G_{j}}$
where Uij is the deviation degree between the indicators and the optimal value. Gj is the factor contribution degree. Oj is the obstacle degree indicating the influence level of a single index on the HID.

4 Results

4.1 The spatiotemporal evolution of HID in the Area

From the perspective of temporal evolution, the average level of HID in the Curve Area was stable with slight fluctuations. The median HIDs of the 17 cities were 0.0535, 0.0507, 0.0513, and 0.0530 in 2005, 2010, 2015, and 2019, respectively, presenting a V-shaped development trajectory. The spatial heterogeneity first narrowed and then expanded. The ratios of the maximum and minimum values of HID for the four years were 3.24, 3.07, 3.10, and 4.31, respectively (Table S1). The latitudinal divergence of HID levels was evident in terms of spatial distribution. The high levels of HID were mainly distributed in the middle reaches of Inner Mongolia. Constrained by poor location conditions and a backward development stage, HID level was weak in the upper and lower reaches of the river. The spatial pattern of HID gradually formed clusters of high-value areas and low-value areas (Figure 3).
Table S1 The high-quality industrial development in the Curve Area of the Yellow River basin from 2005 to 2019
Year HID Median Max Min Max/Min
2005 0.058835294 0.0535 0.0888 0.0274 3.240876
2006 0.058829412 0.0521 0.0908 0.0386 2.352332
2007 0.058835294 0.0573 0.1088 0.0289 3.764706
2008 0.058823529 0.0522 0.0942 0.0373 2.525469
2009 0.058823529 0.0491 0.1004 0.0361 2.781163
2010 0.058823529 0.0507 0.1038 0.0338 3.071006
2011 0.058823529 0.0515 0.1014 0.0342 2.964912
2012 0.058823529 0.0578 0.1084 0.0246 4.406504
2013 0.058823529 0.0543 0.0972 0.0373 2.605898
2014 0.058829412 0.0549 0.11 0.0286 3.846154
2015 0.058829412 0.0513 0.1014 0.0327 3.100917
2016 0.058829412 0.051 0.1102 0.0329 3.349544
2017 0.058829412 0.0503 0.1401 0.0292 4.797945
2018 0.058817647 0.0536 0.1261 0.0372 3.389785
2019 0.058823529 0.053 0.1167 0.0271 4.306273
Figure 3 Spatiotemporal evolution of HID in the Curve Area of the Yellow River basin in in 2005, 2010, 2015 and 2019
The HID levels in the Curve Area displayed significant spatial clustering in 2019 (Moran index=0.33, Z-score=2.64, P-value=0.0083), and the local Moran index suggested that High-High clustering was formed in Erdos and Hohhot. From the perspective of spatial evolution. HID in Hohhot, Baotou, Erdos, and Taiyuan was maintained at high levels. HID level in Ningxia in the upper part of the Area has improved with fluctuations. Downstream Shaanxi and Shanxi have seen a decline in HID, with all but Xinzhou and Baotou becoming low levels in 2019.

4.2 The spatiotemporal evolution of the four dimensions of HID

4.2.1 Performance of development quality

This paper measured the industrial Theil index and industrial advanced index to represent the performance of the industrial structure. From 2005 to 2019, the industrial Theil index declined, and the industrial advanced index increased, characterizing the improvement of the industrial structure in the Area (Figure S1). The performance of industrial structure was significantly different within the Area, and the pattern of spatial divergence was relatively stable. The three provincial capitals were the cities with the smallest industrial Theil index and the largest industrial advanced index. The industrial structure was more rational in provincial capitals than in resource-based cities such as Yulin, Yan’an, Linfen, and Lvliang maintained low levels (Figure 4).
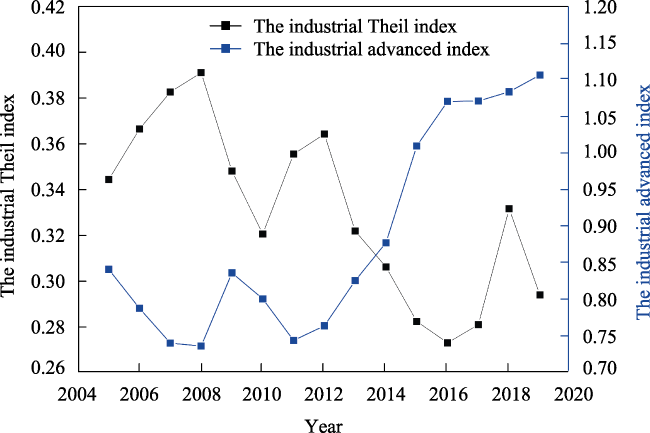
Figure S1 The industrial Theil index and the industrial advanced index in the Curve Area of the Yellow River basin from 2005 to 2019
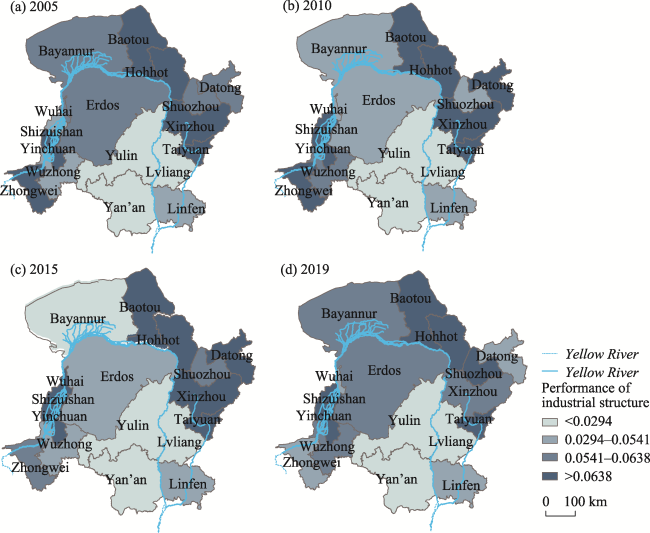
Figure 4 Spatiotemporal evolution of structure performance in the Curve Area of the Yellow River basin in 2005, 2010, 2015 and 2019
Industrial spatial agglomeration is a critical way to integrate production factors, exert positive externalities and promote regional economic development. This paper used the LQ index to denote the industrial specialization level. The high LQ of extractive industries in Shaanxi and Shanxi indicated that extractive industries were the high spot of regional economic development. In this paper, the LQ of the manufacturing instead of the extractive industry was chosen to characterize the industrial specialization level for the following two reasons: First, as a dense area of resource-based cities, the LQ of the extractive industry in the Area does not have apparent spatial differentiation. Second, the stronger mobility of manufacturing compared with the extractive industry indicates that the former could be influenced by externalities more easily. This paper found that the specialization of manufacturing in the Area was not prominent and presented a downward trend. Baotou, Shizuishan, and Taiyuan were the only cities with LQ over 1 (Table S2).
Table S2 The LQ of the manufacturing and extractive industry of the 17 cities in the Curve Area of the Yellow River basin in selected years
City name 2005 2010 2015 2019
Manu LQ Extr LQ Manu LQ Extr LQ Manu LQ Extr LQ Manu LQ Extr LQ
Bayannur 0.51 0.52 0.37 0.68 0.26 0.29 0.15 0.25
Baotou 1.74 0.77 1.39 0.68 1.26 0.78 1.08 1.47
Erdos 0.77 3.32 0.61 4.09 0.58 1.20 0.58 7.79
Hohhot 0.81 0.03 0.67 0.01 0.48 0.02 0.54 0.01
Wuhai 0.89 6.07 0.49 6.83 1.27 0.28 0.63 7.56
Shizuishan 1.32 0.16 1.29 0.97 1.15 0.50 1.02 0.25
Wuzhong 0.75 0.05 0.71 0.03 0.74 0.21 0.78 0.06
Yinchuan 0.58 4.06 0.56 3.98 0.38 1.34 0.59 6.41
Zhongwei 0.68 0.22 0.60 0.00 0.51 0.00 0.30 0.00
Datong 0.51 6.94 0.33 7.82 0.38 11.42 0.44 11.76
Linfen 0.66 2.80 0.57 2.74 0.40 5.68 0.34 7.70
Lvliang 0.61 2.76 0.61 4.81 0.60 8.49 0.53 11.02
Shuozhou 0.32 5.97 0.27 5.04 0.20 8.59 0.26 12.05
Taiyuan 1.01 2.23 1.05 2.30 0.66 2.97 0.78 3.28
Xinzhou 0.46 1.86 0.29 2.70 0.21 4.26 0.18 6.57
Yan’an 0.21 4.58 0.16 6.39 0.27 7.93 0.41 9.10
Yulin 0.23 1.63 0.19 3.39 0.51 5.90 0.63 7.69
Average 0.71 2.59 0.60 3.09 0.58 3.52 0.54 5.47
This paper characterized the industrial diversification level by calculating the reciprocal of the Hirschman Herfindahl index. The findings showed that the levels of industrial diversification varied greatly among cities, with higher DI in large cities and provincial capitals. The gravity model was used to construct the industrial association network. The spatial organization of the industrial economy in the Area presented an incompact polycentric structure that did not evolve along the river basin. From 2005 to 2019, the industrial connection within the region has been strengthened, and more linkages have been formed (Figure 5). Big cities and provincial capitals generally had higher industrial location degrees. The industrial location index and industrial association networks in the upper part of the basin were relatively weak (Figure 6). Urban agglomerations evolved, to some extent, along the paths of regions with high industrial location degrees, and the connection between agglomerations was weak.
Figure 5 Industrial association network in the Curve Area of the Yellow River basin in 2005 and 2019
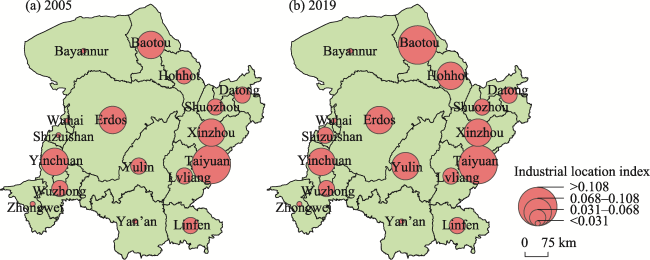
Figure 6 Industrial location index in the Curve Area of the Yellow River basin in 2005 and 2019

4.2.2 Performance of development efficiency and development momentum

Almost all of the 17 cities in the Curve Area have experienced an increase in single-factor productivity during the study period. The regional TFP grew at an average annual rate of 11.2%, where the level of technological progress was also 11.2%, and the average annual growth rates of pure technical efficiency and scale efficiency were -0.1% and 0.2%, respec-tively (Table S3). In other words, the growth of TFP mainly came from technological progress, while the contribution of factor allocation efficiency and factor use efficiency was not significant. The TFP growth rate maintained a positive growth trend from 2005 to 2019. TFP had the most significant growth momentum before 2010, with growth rates exceeding 10%. Along with the continuous advancement of China’s economic system reform, technological progress in the Curve Area has maintained a long-term positive growth before 2008, but the loss of scale efficiency was significant, maintaining negative growth in consecutive years. After 2008, in response to the ongoing impact of the global financial crisis, the Area implemented a large-scale investment stimulus policy, thus exacerbating the regional imbalance of production factors and further accentuating overcapacity, which resulted in the negative growth of pure technical efficiency and the slowdown of technological progress and TFP growth.
Table S3 The TFP and its decompositions in the Curve Area of the Yellow River basin from 2005 to 2019
Year effch techch pech sech tfpch
2005 1.000 1.000 1.000 1.000 1.000
2006 0.983 1.190 0.988 0.995 1.170
2007 0.984 1.169 1.007 0.977 1.150
2008 0.986 1.178 0.996 0.990 1.162
2009 0.981 1.126 0.973 1.008 1.105
2010 0.991 1.166 1.003 0.988 1.156
2011 1.002 1.093 1.005 0.997 1.095
2012 1.014 1.078 1.008 1.006 1.093
2013 0.984 1.114 0.988 0.996 1.096
2014 1.026 1.056 0.993 1.033 1.084
2015 1.034 1.096 1.021 1.012 1.133
2016 1.002 1.080 1.003 0.999 1.082
2017 1.006 1.060 0.999 1.006 1.066
2018 1.009 1.078 0.998 1.011 1.088
2019 1.009 1.082 1.005 1.004 1.092
Average 1.001 1.112 0.999 1.002 1.112
Technological progress also played an important role in the cumulative growth of TFP in the Curve Area. From 2005 to 2019, the cumulative growth rate of TFP was 379% in the Area, with a cumulative growth rate of 373% for technological progress, 2.7% for scale efficiency, and a cumulative decline of 0.2% for pure technical efficiency. Although technological progress has kept a good growth momentum, the loss of allocation efficiency has greatly hindered the improvement of TFP (Table S5). From the perspective of spatial differentiation, the TFP growth rate of all cities in the Area was greater than 1, and the technological progress of all cities also reported positive growth during the study period (Table S4 and S6). Cities with positive annual growth in pech and sech included Erdos, Hohhot, Wuhai, Wuzhong, Zhongwei, Yan’an, and Yulin, while most other cities suffered from efficiency loss, which pulled down the overall TFP growth rate. Wuhai ranked first with an average annual growth rate of 18% in TFP. This may be attributed to the construction of economic development zones in Wuhai, which has attracted a large inflow of capital and technology, thus enhancing regional innovation.
Table S4 The average TFP and its decompositions of the 17 cities in the Curve Area of the Yellow River basin
City name effch techch pech sech tfpch
Bayannur 1.019 1.106 1.020 0.999 1.127
Baotou 0.989 1.137 0.981 1.009 1.125
Erdos 1.000 1.111 1.000 1.000 1.111
Hohhot 1.024 1.085 1.017 1.007 1.111
Wuhai 1.003 1.180 1.000 1.003 1.184
Shizuishan 0.985 1.157 1.000 0.985 1.140
Wuzhong 1.017 1.115 1.003 1.014 1.135
Yinchuan 0.983 1.115 0.976 1.007 1.096
Zhongwei 1.011 1.114 1.000 1.011 1.126
Datong 0.995 1.113 0.994 1.001 1.108
Linfen 0.987 1.116 0.994 0.993 1.102
Lvliang 0.998 1.043 1.000 0.998 1.041
Shuozhou 0.999 1.117 1.000 0.999 1.116
Taiyuan 0.989 1.108 0.993 0.995 1.095
Xinzhou 0.997 1.119 1.000 0.998 1.116
Yan’an 1.000 1.039 1.000 1.000 1.039
Yulin 1.017 1.120 1.008 1.008 1.138
Table S5 The TFP cumulation and its decompositions of the Curve Area in the Yellow River basin from 2005 to 2019
Year effch cumulation techch cumulation pech cumulation sech cumulation tfpch cumulation
2005 1.00 1.00 1.00 1.00 1.00
2006 0.98 1.19 0.99 1.00 1.17
2007 0.97 1.40 1.00 0.97 1.35
2008 0.96 1.65 1.00 0.97 1.57
2009 0.94 1.89 0.97 0.98 1.75
2010 0.94 2.21 0.98 0.96 2.03
2011 0.94 2.44 0.98 0.96 2.25
2012 0.95 2.65 0.99 0.97 2.49
2013 0.94 2.97 0.98 0.96 2.73
2014 0.96 3.16 0.97 0.99 2.98
2015 1.00 3.48 0.99 1.01 3.39
2016 1.00 3.77 1.00 1.01 3.68
2017 1.01 4.04 1.00 1.01 3.97
2018 1.02 4.37 0.99 1.02 4.36
2019 1.02 4.73 1.00 1.03 4.79
Table S6 The average TFP cumulation and its decompositions of the 17 cities in the Curve Area of the Yellow River basin
City name effch cumulation techch cumulation pech cumulation sech cumulation tfpch cumulation
Bayannur 1.020 1.101 1.020 1.003 1.123
Baotou 0.991 1.132 0.984 1.009 1.119
Erdos 1.000 1.105 1.000 1.000 1.105
Hohhot 1.030 1.081 1.023 1.006 1.114
Wuhai 1.004 1.170 1.000 1.004 1.172
Shizuishan 0.987 1.148 1.000 0.987 1.131
Wuzhong 1.017 1.109 1.003 1.015 1.126
Yinchuan 0.985 1.109 0.979 1.008 1.091
Zhongwei 1.011 1.108 1.000 1.011 1.118
Datong 0.996 1.106 0.995 1.001 1.101
Linfen 0.988 1.109 0.995 0.994 1.095
Lvliang 0.998 1.043 1.000 0.998 1.042
Shuozhou 0.999 1.110 1.000 0.999 1.109
Taiyuan 0.990 1.103 0.996 0.997 1.090
Xinzhou 0.998 1.111 1.000 0.998 1.109
Yan’an 1.000 1.039 1.000 1.000 1.039
Yulin 1.016 1.112 1.008 1.008 1.131
From 2005 to 2019, the proportion of R&D expenditure in GDP, marketization rate of the wage distribution, and per capita GDP in the Area all showed an increasing trend, while the proportion of FDI in fixed-asset investment and GDP growth rate both showed a decreasing trend. In terms of spatial distribution, the development power varied significantly within the Area, with most cities in Inner Mongolia and the two capital cities of Taiyuan and Yinchuan stabilizing at a high level. In terms of spatial evolution, the power in northern Shaanxi has improved (Figure 7). As a national energy and chemical base, Northern Shaanxi avoided falling into the resource trap by continuously increasing its investment in science and technology to reduce its dependence on investment and factor inputs. The cities with low development power included Xinzhou, Datong, Shuozhou, Yulin, Linfen, and Yan’an, which were all typical resource-based cities.
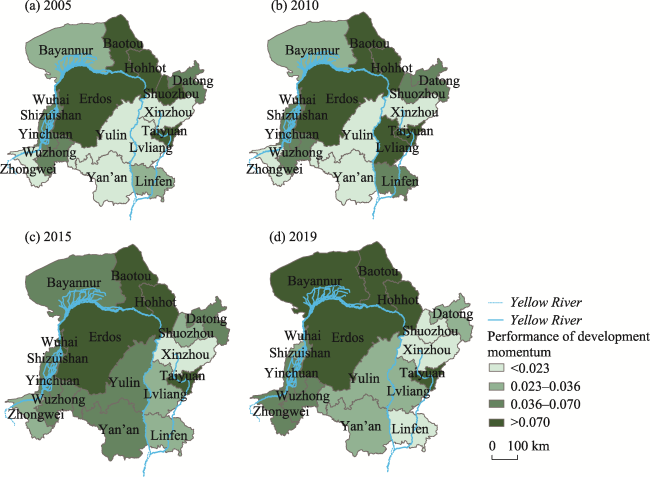
Figure 7 Spatiotemporal evolution of development momentum in the Curve Area of the Yellow River basin in 2005, 2010, 2015 and 2019

4.2.3 Performance of development environment

A good development environment is the guarantee of HID, including a stable economic environment and a harmonious social environment. In terms of the economic environment, the unemployment rate in the Curve Area has decreased over the period 2005-2019, the inflation levels have been relatively stable, and the economic volatility has been insignificant. In terms of the social performance of industrial development, the per capita years of education, per capita road mileage, and the number of medical technicians per 10,000 people in the Curve Area have all increased, and the Gini coefficient of economic growth and the income ratio of urban and rural residents has decreased year by year, indicating that the welfare has increased and the distribution of welfare has become more equitable (Table S7). From the perspective of spatial divergence, the development environment in most cities has remained stable or has improved, while the environment in Xinzhou has deteriorated, which may be related to its backward economic level and the vast income gap between the urban and rural areas.
Table S7 The performance of the social environment of industrial development in the Curve Area of the Yellow River basin from 2005 to 2019
Year Number of
medical technicians
Per capita years
of education
Per capita road mileage Gini coefficient of
economic growth
Income ratio of urban
and rural residents
2005 43.304 8.797 27.079 0.265 3.387
2006 45.473 8.903 41.830 0.268 2.818
2007 46.639 9.009 42.716 0.267 2.903
2008 48.176 9.109 44.827 0.261 2.997
2009 51.564 9.211 47.006 0.257 3.007
2010 51.310 9.316 46.955 0.249 2.928
2011 56.884 9.403 49.085 0.260 2.843
2012 56.995 9.504 49.453 0.257 2.898
2013 63.508 9.604 51.770 0.250 2.817
2014 65.990 9.704 52.046 0.243 2.678
2015 71.436 9.804 53.718 0.234 2.664
2016 75.313 9.902 56.534 0.223 2.646
2017 79.120 10.003 54.318 0.218 2.630
2018 82.024 10.079 54.682 0.230 2.582
2019 84.619 10.175 57.589 0.226 2.520

4.3 Obstacles to HID

Each index had a different obstacle degree to HID. The obstacle degree of development momentum to HID was the highest on the regional scale, among which the obstacle degree of innovation momentum was 19.18%, and the obstacle degree of the rooted momentum was 5% (Table 1). From the perspective of the inter-annual performance of the region, the obstacle degree of energy efficiency in the sub-indicators has shown a declining trend, while the obstacle degree of industrial rationalization has increased significantly, and its average value was the largest. To sum up, the technological introduction and the rationalization of the industrial structure were the primary obstacle factors. From the perspective of urban performance, the primary obstacle factor to HID in all cities except Erdos was the innovation momentum, while the development environment had the lowest obstacle degree in all 17 cities. In terms of specific indicators, the most significant obstacles to HID in each city were highly consistent, including industrial structure rationalization, the ratio of FDI to fixed asset investment, and industrial location degree. The obstacle degree of the industrial location index in Bayannur, Wuhai, Shizuishan, and Zhongwei ranked second among all the obstacle factors, indicating the urgency to promote industrial advantages in the curve’s upper reaches (Table 2).
Table 1 The obstacle factors of high-quality industrial development in the Curve Area of the Yellow River basin and their obstacle degree from 2005 to 2019
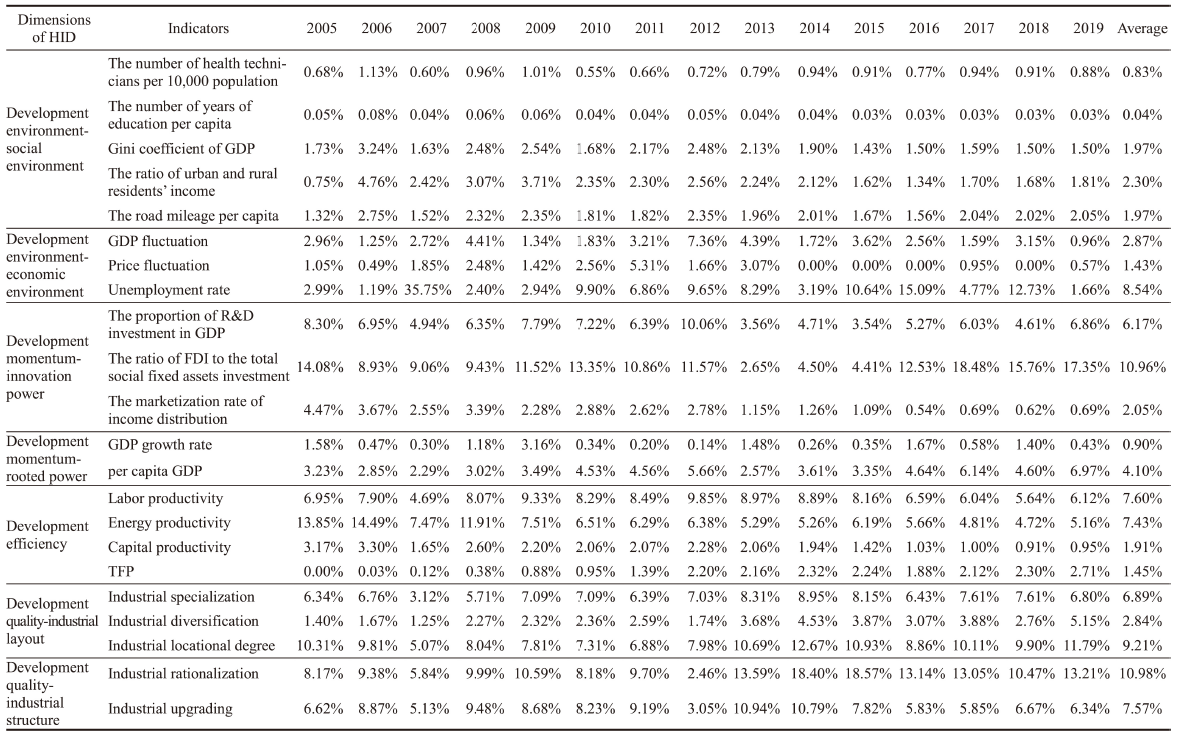
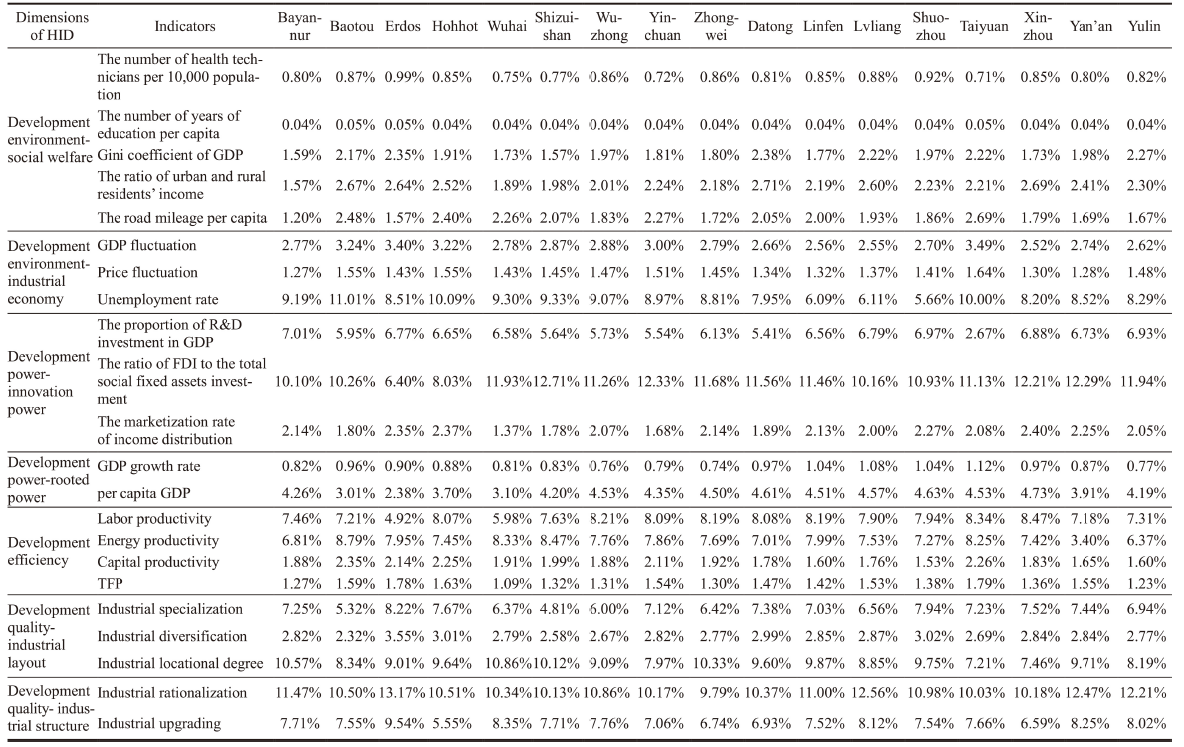
Table 2 The obstacle factors of high-quality industrial development in the 17 cities and their average obstacle degree

5 Discussion

Takes the rivers as the natural link and the arterial transportation as the backbone; a basin is a particular geographic unit that performs labor division and cooperation by integrating and optimizing the basin’s resources. This paper analyzed the industrial development in a basin under the guidance of the high-quality development strategy by constructing a “three pivots and one guarantee” evaluation framework. The levels of HID in the Curve Area were stable with slight fluctuations, characterized by spatial unevenness and relative stability. From 2005 to 2019, the HID levels improved in the basin’s upper reaches while decreased in the lower reaches. Therefore, the spatial differences need to be fully considered in the formulation and implementation of industrial policies. The upstream Area is the critical area for HID that needs to break through the development bottleneck and seek improvement space. In contrast, Inner Mongolia has a better development status and can be the demonstration and leading area. The downstream area is critical for future HID, which needs to be improved according to local conditions. The same development goals and the close relationship between the upper and lower reaches require collaboration among the 17 cities. The Curve Area needs to break through the constraints of administrative boundaries and form a coordinated industrial layout with complementary advantages by promoting the free flow and efficient allocation of factors.
There are 11 resource-based cities out of 17 cities in the Curve Area, and most of them emerged during the planned economy as a product of the national strategy to prioritize the development of the heavy industry. Resource-based cities have taken advantage of their resources to develop resource-based industries on a large scale, resulting in the secondary industry becoming the absolute dominant industry, neglecting the development of primary and tertiary industries, and the ratio between the three industries is seriously unreasonable. This paper found that the industrial rationalization and upgrading levels in resource-based cities such as Yulin, Yan’an, Linfen, and Lvliang were lower than in provincial capitals. Mean-while, considering that the obstacle degree of industrial structure for realizing HID was high, the establishment and cultivation of new leading industries should be accelerated based on continuously tapping the potential of traditional industries.
Most of the Area’s industries are state-owned or military enterprises. These industries “settled” in the basin in the early stages of industrialization, forming the islanding effect and polycentric industrial networks. Cities with a high industrial location index were maintained among a few provincial capitals and big cities and were not fully connected. The overall level of industrial diversification was low. Reasonable industrial divisions and characteristic industrial clusters have not formed among cities and urban agglomerations. Despite the increase in the specialization level of the manufacturing industry, the role of manufacturing in driving local development was still weak. Notably, DI was relatively higher in large cities and provincial capitals, which agrees with the findings of Xie and Yang (2003). The degree of economic connection and infrastructure interconnection in the Area was less satisfactory than in southeast China. Since the mainstream of the Yellow River was not navigable throughout, the economy and population were increasingly concentrated in areas with convenient transportation. This explained the trend of evolving along the areas with high industrial location index instead of the mainstream of the Yellow River for agglomerations.
Since the reform and opening up, cities in the Area have improved their industrial structure performance by increasing the share of the “light industry” in manufacturing and developing the service industry rapidly. At the same time, the global traditional industries were shifting to Southeast Asia and accelerating to the central and western regions of China. It is certain that the industrial transfer can further strengthen the ties between cities and reconstruct the socio-economic linkage network in the Area. On the basis of breaking and reconstructing industrial chains, the industrial transfer can also lead to more fierce competition for investment, talent, and development opportunities. The Area, especially the upstream areas where the obstacle degree of industrial location was high, should pay special attention to strengthening industrial association networks and improving the industrial location. This paper found that FDI was also a primary obstacle to HID. Considering that FDI can not only characterize the intensity of technology introduction but also, to a certain extent, promote industrial transfer in central and western China (Liu and Song, 2021). FDI needs to transform from passive absorption to active selection under scientific guidance. Also, the connections between urban clusters should be strengthened to bring the entire basin to participate in the national and global industrial division and collaboration.
During the study period, the single factor productivity in the Area has increased year by year. Although technological progress maintained a good growth momentum that contributed to the continued growth of TFP, the loss of factor allocation efficiency and factor use efficiency greatly hindered the improvement of TFP. Therefore, at the current stage of economic transformation, the development focus in the Area should also be on improving the market mechanism and releasing the dividends of institutional reform through institutional innovation. Technological innovation is the intrinsic driving force of industrial transformation, and institutional innovation is the extrinsic pulling force. This paper found that resource-based cities generally had lower innovation power than other cities. This is consistent with the findings of An and Li (2020) that the prosperity of resource industries in a city will to a certain extent inhibit innovation activities, resulting in insufficient human resource reserves as well as a weak willingness to innovate. Considering that the obstacle degree of innovation momentum for realizing HID was significantly high, the Area should also continuously promote independent research as well as technology introduction. From the perspective of the development environment, the Area’s economic environment and social environment have both improved, but the vast rural areas in the region were still traditional villages with a large income gap between urban areas. Besides, the Area’s heavy industries have remained primarily in state-owned enterprises, resulting in a high proportion of the state-owned economy and weak institutional innovation. With the gradual loss of resource advantage in the international context of competitive advantage shift, innovation drive has become the primary obstacle for HID in the Area.

6 Conclusions and policy implications

This paper argued that HID is represented by the efficiency increase, quality improvement, and new momentum cultivation under a stable socio-economic environment, and a four-dimensional HID evaluation framework that included “three pivots and one guarantee” was designed to study the HID in the π-shaped Curve Area of the Yellow River basin in China. The main findings were as follows:
The HID in the Curve Area was stable with slight fluctuations, characterized by spatial unevenness and relative stability. The HID in the river’s middle reaches was relatively higher than that of the upper and lower reaches, and the spatial clusters of high-level and low-value areas were gradually formed. Specifically, the performance of industrial structure was more rational in provincial capitals than in resource-based cities such as Yulin, Yan’an, Linfen, and Lvliang. The industrial specialization and diversification levels were higher in large cities and provincial capitals. Moreover, the spatial organization of the industrial economy in the Area presented an incompact polycentric structure, and the industrial location index and industrial association networks were relatively weak in the basin’s upper reaches. Urban agglomerations evolved along the paths of regions with high industrial location degrees, and the connection between agglomerations was weak. Almost all cities have experienced an increase in single-factor productivity during the study period. Although technological progress maintained a good growth momentum that contributed to the continued growth of TFP, the loss of factor allocation efficiency and factor use efficiency greatly hindered the improvement of TFP. The development momentum varied significantly within the Area, with most cities in Inner Mongolia stabilizing at a high level while resource-based cities were maintained at a low level. The development environment in most cities has remained stable or has improved, and the social welfare has increased and distributed more equitable in the Area. For the indicators that inhibit HID, the technological introduction and the rationalization of the industrial structure were the primary obstacle factors, and the upgrading of the industrial location index was critical to the upper reaches of the curve.
The diversity and variability of the HID levels in the Area indicate that the realization of HID is a long-term and arduous task. This paper proposed the development strategy of “improving quality, promoting synergy and upgrading momentum based on the above findings.” That is to say, the Curve Area should be regarded as a whole, and sufficient economic accumulation and industrial upgrading can be achieved by using new technologies and national power, so as to realize HID. Specifically, First, The Area should explore new industrial development modes to realize high-quality growth. In the tide of intelligent society and globalization, the Curve Area should actively integrate into national strategies and construct distinctive and competitive industrial clusters and industrial chains. At the same time, it is necessary to fully consider the developmental differences between the upstream, midstream, and downstream of the Curve and precisely formulate industrial policies according to local conditions. With central cities as the engines of HID, the spatial growth mechanism of urban clusters based on the endogenous linkage of industrial division and cooperation should be established by radiating small and medium-sized cities through the industrial transformation. Also, the Area should build a recycling and efficient industrial system and change the resource-based and heavy chemical industry-led structure. Second, The Area should seek national support and explore a new collaborative model under the premise of quality improvement. Specifically, the Area should coordinate the distribution of major industries, reduce disorderly industrial competition, enhance systematic industrial development, and accelerate the formation of a coordinated and balanced development pattern. The east-west industrial network could be established using the national high-speed rail and expressway, making up for the lack of water transportation and promoting cooperation between the upper and lower reaches. At the same time, central cities need to strengthen the connection with the outside of the basin to drive the overall spatial reconstruction and competitiveness and promote the healthy development of the central cities and city clusters. Third, the Area should change its development mindset and promote innovation-driven development from three aspects: the first aspect is the promotion of industrial innovation, which means that industries should improve the efficiency of clean energy utilization through the utilization of new technologies while deeply implementing the innovation-driven development strategy. The second aspect is the promotion of practice innovation. Cities should build modern industrial systems with regional characteristics according to the local development condition. With safeguarding and improving people’s livelihood as the ultimate purpose, cities should enhance the momentum and resilience of economic development. Through the construction of digital infrastructure and the improvement of public service levels, regional residents can better share the fruits of reform and development. The third aspect is the promotion of institutional innovation. Governments need to deepen market-oriented reforms explore mechanism innovation, and promote the free flow of resources to improve allocation efficiency. At the same time, government functions should be transformed to create a favorable business environment through decentralization and simplification, thus realizing HID.
[1]
An S, Li R, 2020. Intension and promotion strategy of high-quality development in the Yellow River Basin. Reform, (1): 76-86. (in Chinese)

[2]
Bai X, Jin J, Zhou R et al., 2022. Coordination evaluation and obstacle factors recognition analysis of water resource spatial equilibrium system. Environmental Research, 210: 112913, doi: 10.1016/j.envres.2022.112913.

DOI

[3]
Bruntland G, 1987. World Commission on Environment and Development:Our Common Future. London: Oxford University Press.

[4]
Bureau of City Statistics (BCS), 2005-2019. City Statistical Yearbook of 17 Cities. Beijing: China Statistics Press. (in Chinese)

[5]
Chen L, Ye W, Huo C et al., 2020. Environmental regulations, the industrial structure, and high-quality regional economic development: Evidence from China. Land, 9 (12): 517, doi: 10.3390/land9120517.

DOI

[6]
Chen Z, Qing M, Yang Y, 2022. Measurement of high-quality development level in Sichuan-Chongqing Economic Circle and its spatio-temporal convergence. Economic Geography, 42(4): 65-73. (in Chinese)

[7]
Cho H, Lee J, 2020. Does transportation size matter for competitiveness in the logistics industry? The cases of maritime and air transportation. The Asian Journal of Shipping and Logistics, 36(4): 214-223, doi: 10.1016/j.ajsl.2020.04.002.

DOI

[8]
Cui D, Bu X, Xu Z et al., 2021. Comprehensive evaluation and impact mechanism of high-quality development of China’s resource-based cities. Acta Geographica Sinica, 76(10): 2489-2503. (in Chinese)

[9]
Cutler H, Davies S, 2010. The economic consequences of productivity changes: A computable general equilibrium (CGE) analysis. Regional Studies, 44(10): 1415-1426, doi: 10.1080/00343400701654210.

DOI

[10]
Ding H, Liu X, 2017. Measure and analysis on the urban-rural income gap in China. Economic Geography, 37(4): 32-41. (in Chinese)

[11]
Ehigiamusoe K, Lean H, Chan J, 2020. Influence of macroeconomic stability on financial development in developing economies: Evidence from west African region. The Singapore Economic Review, 65(4): 837-856, doi: 10.1142/S0217590819500553.

DOI

[12]
Fu C, Yang Y, 2020. The quality measurement and evaluation of industrial development in China’s industrialization process. Quantitative & Technical Economics, 37(3): 3-25. (in Chinese)

[13]
Fu X L, Pietrobelli C, Soete L, 2011. The role of foreign technology and indigenous innovation in the emerging economies: Technological change and catching-up. World Development, 39(7): 1204-1212, doi: 10.1016/j.worlddev.2010.05.009.

DOI

[14]
Gill I, Kharas H, Bhattasali D et al., 2007. An East Asian Renaissance: Ideas for Economic Growth. Washington, DC, United States: World Bank Publications, The World Bank Group: 6798.

[15]
He W, Qiao D, Ding Z et al., 2017. Spatial and temporal patterns of urban interrelation in Central Plains Economic Zone. Areal Research and Development, 36(4): 19-26. (in Chinese)

[16]
Hong Y, Liu W, Song H, 2022. Spatial econometric analysis of effect of new economic momentum on China’s high-quality development. Research in International Business and Finance, 61: 101621, doi: 10.1016/j.ribaf.2022.101621.

DOI

[17]
Huang J, Lin H, Chen M, 2017. The dynamics and empirical analysis of input and output efficiency of urban agglomerations in China, 2000-2013: Based on the DEA model and Malmquist index method. Progress in Geography, 36(6): 685-696. (in Chinese)

[18]
Huang Q, Shi P, Hu J, 2020. Industrial agglomeration and high-quality economic development: Examples of 107 prefecture-level cities in the Yangtze River Economic Belt. Reform, (1): 87-99. (in Chinese)

[19]
Inner Mongolia Bureau of Statistics (IMBS), 2005-2019. Statistical Yearbook of Inner Mongolia. Beijing: China Statistics Press. (in Chinese)

[20]
Jacobs J, 1969. The Economy of Cities. New York: Vintage.

[21]
Li B, Wang H, 2022. Comprehensive evaluation of urban high-quality development: A case study of Liaoning Province. Environment, Development and Sustainabilit, doi: 10.1007/s10668-022-02129-5.

DOI

[22]
Li J, Song D, 2008. Specialization, diversification and urban agglomeration economy: An empirical study based on panel data of Chinese prefectural units. The Management World, (2): 25-34. (in Chinese)

[23]
Li Y, Han P, 2021. Mechanism and path of high-quality development of manufacturing industry in digital economy. Macroeconomic Management, (5): 36-45. (in Chinese)

[24]
Liu H X, Xie Z T, Song X, 2017. The impact of industrial structure change on economic growth. In: 11th Annual International Conference on Management Science and Engineering Management (ICMSEM), 522-529, doi: 10.1007/978-3-319-59280-0_42.

DOI

[25]
Liu J, 2021. Research on the remolding of high quality industry development dynamics based on original innovation value network. Guangxi Social Sciences, (5): 109-119. (in Chinese)

[26]
Liu M, Song Y, 2021. Does FDI in the central and western regions of China promote the transfer of industries from the east: Based on FDI quality perspective. Journal of International Trade, (9): 88-104. (in Chinese)

[27]
Liu T, Wu Y, 2019. The connotation requirements, key difficulties, and strategic measures of high quality industrial development in Xiongan New Area. West Forum, 29(4): 116-124. (in Chinese)

[28]
Marshall A, 1920. Principles of Economics. London: Macmillan.

[29]
Miao C, Wang H, 2012. Study on the relationship between urban economic location and the spatial economy of the three urban agglomerations along the Yellow River. Yellow River Civilization and Sustainable Development, (2): 21-31. (in Chinese)

[30]
Ministry of Housing and Urban-Rural Development (MHURD), 2005-2019. China Urban Construction Statistical Yearbook. Beijing: China Planning Press. (in Chinese)

[31]
National Bureau of Statistics (NBS), 2005-2019. China Urban Statistical Yearbook. Beijing: China Statistics Press. (in Chinese)

[32]
National Forestry and Grassland Administration (NFGA), 2005-2019. China Forestry and Grassland Statistical Yearbook. Beijing: China Forest Publishing Company. (in Chinese)

[33]
Pan W, Wang J, Lu Z et al., 2021. High-quality development in China: Measurement system, spatial pattern, and improvement paths. Habitat International, 118, doi: 10.1016/j.habitatint.2021.102458.

DOI

[34]
Ren B, He M, 2019. Commentary on several research points of view on high-quality development of China’s economy since the Nineteenth National Congress. Journal of Weinan Normal University, 34 (9): 25-33. (in Chinese)

[35]
Shaanxi Provincial Bureau of Statistics (Shaanxi PBS), 2005-2019. Statistical Yearbook of Shaanxi Province. Beijing: China Statistics Press. (in Chinese)

[36]
Shamkhi M K, Ahmed D A, Hameed Majeed O, 2021. The effectiveness of the manufacturing industry in Iraq. Materials Today: Proceedings, 60(3): 1223-1228, doi: 10.1016/j.matpr.2021.08.100.

DOI

[37]
Shanxi Provincial Bureau of Statistics (Shanxi PBS), 2005-2019. Statistical Yearbook of Shanxi Province. Beijing: China Statistics Press. (in Chinese)

[38]
Sheng Y, Zhou Y, Xu L, 2022. Driving factors and mechanisms of high-quality economic growth: An empirical study of the Yellow River Basin. Economic Geography, 42(6): 45-54. (in Chinese)

[39]
State Council of China (SC), 2021. Outline of the Plan for Ecological Protection and High-quality Development of the Yellow River Basin. http://www.gov.cn/zhengce/2021-10/08/content_5641438.htm. in Chinese)

[40]
Ningxia Provincial Bureau of Statistics (Ningxia PBS), 2005-2019. Ningxia Statistical Yearbook. Beijing: China Statistics Press. (in Chinese)

[41]
Sun C, Zhu Y, 2020. Discussion on the spatial disequilibrium pattern and causes of regional marine innovation in China based on Dagum Gini coefficient. Economic Geography, 40(1): 103-113. (in Chinese)

[42]
Sun Y, Wang N, 2021a. Development and correlations of the industrial ecology in China’s Loess Plateau: A study based on the coupling coordination model and spatial network effect. Ecological Indicators, 132: 108332, doi: 10.1016/j.ecolind.2021.108332.

DOI

[43]
Sun Y, Wang N, 2021b. Eco-efficiency in China’s Loess Plateau region and its influencing factors: A data envelopment analysis from both static and dynamic perspectives. Environmental Science and Pollution Research, doi: 10.1007/s11356-021-15278-3.

DOI

[44]
Sun Y, Wang N, 2022. Sustainable urban development of the π-shaped Curve Area in the Yellow River basin under ecological constraints: A study based on the improved ecological footprint model. Journal of Cleaner Production, 337: 130452, doi: 10.1016/j.jclepro.2022.130452

DOI

[45]
Tsai P-H, 2020. Strategic evaluation criteria to assess competitiveness of the service industry in Taiwan. Journal of Policy Modeling, 42(6): 1287-1309, doi: 10.1016/j.jpolmod.2020.05.003.

DOI

[46]
Tu S, 2018. The outstanding problems faced by the high quality development of Chinese industry and the realization paths. China Development Observation, (14): 13-17. (in Chinese)

[47]
Wei M, Li S, 2018. Study on the measurement of economic high-quality development level in China in the new era. The Journal of Quantitative & Technical Economics, 35 (11): 3-20. (in Chinese)

[48]
Xie X, Yang K, 2003. Diversification and specialization of Chinese cities. Soft Science, 17(1): 10-13, 33. (in Chinese)

[49]
Xu H, Wang Y, 2010. Urban-rural income gap and total factor productivity in China. Financial Research, (10): 54-67. (in Chinese)

[50]
Xu L, Yao S, Chen S et al., 2019. Evaluation of eco-city under the concept of high-quality development: A case study of the Yangtze River Delta urban agglomeration. Scientia Geographica Sinica, 39(8): 1228-1237. (in Chinese)

DOI

[51]
Yang Y, Ren L, Du Z et al., 2021. Measurement and spatiotemporal analysis of high-quality development of China’s industry. PloS One, 16(12): e0259845, doi: 10.1371/journal.pone.0259845.

DOI

[52]
Yu Y, Duan S, Lin B, 2021. High quality development of the Chinese industries under the new development pattern: realistic dilemma and policy guidance. Journal of Macro-quality Research, 9(4): 78-98. (in Chinese)

[53]
Zhang F, Sun C, An Y et al., 2021. Coupling coordination and obstacle factors between tourism and the ecological environment in Chongqing, China: A multi-model comparison. Asia Pacific Journal of Tourism Research, 26(7): 811-828, doi: 10.1080/10941665.2021.1925715.

DOI

[54]
Zhang H, 2019. Building a modern state governance mode that supports high-quality development: China’s experience and challenges. Economist, (11): 23-32. (in Chinese)

[55]
Zhang H, Zhang J, Song J, 2022. Analysis of the threshold effect of agricultural industrial agglomeration and industrial structure upgrading on sustainable agricultural development in China. Journal of Cleaner Production, 341: 130818, doi: 10.1016/j.jclepro.2022.130452.

DOI

[56]
Zhang Y, Li X, Su Q, 2017. Does spatial layout matter to theme park tourism carrying capacity? Tourism Management, 61: 82-95, doi: 10.1016/j.tourman.2017.01.020.

DOI

[57]
Zheng J, Shao X, Liu W et al., 2021. The impact of the pilot program on industrial structure upgrading in low-carbon cities. Journal of Cleaner Production, 290: 125868, doi: 10.1016/j.jclepro.2021.125868.

DOI

Outlines

/