Research Articles

Transnational technology transfer network in China: Spatial dynamics and its determinants

  • LIU Chengliang , 1, 2, 3 ,
  • YAN Shanshan 3
Expand
  • 1. Institute for Global Innovation & Development, East China Normal University, Shanghai 200062, China
  • 2. Center for World Geography and Geo-strategic Studies, East China Normal University, Shanghai 200062, China
  • 3. School of Urban & Regional Science, East China Normal University, Shanghai 200241, China

Liu Chengliang, Professor, specialized in economic geography and regional innovation. E-mail:

Received date: 2021-12-17

  Accepted date: 2022-04-18

  Online published: 2022-12-25

Supported by

National Social Science Foundation of China(21ZDA011)

Abstract

Patent transfer has been regarded as an important channel for the nations and regions to acquire external technology, and also a direct research object to depict the relationship between supply and demand of technology flow. Therefore, based on traceable patent transfer data, this article has established a dual-pipeline theoretical framework of transnational-domestic technology transfer from the interaction of the global and local (glocal) perspective, and combines social networks, GIS spatial analysis as well as spatial econometric model to discover the spatial evolution of China’s transnational technology channels and its determinant factors. It is found that: (1) The spatial heterogeneity of the overall network is significant while gradually weakened over time. (2) The eastward shift of the core cities involved in transnational technology channels is accelerating, from the hubs in North America (New York Bay Area, Silicon Valley, Caribbean offshore financial center, etc.) and West Europe (London offshore financial center etc.) to East Asia (Tokyo and Seoul) and Southeast Asia (Singapore), which illustrates China has decreased reliance on the technology from the USA and West Europe. (3) The four major innovation clusters: Beijing-Tianjin-Hebei region (Beijing as the hub), Yangtze River Delta (Shanghai as the hub), The Greater Bay Area (Shenzhen and Hong Kong as the hubs) and north Taiwan (Taipei and Hsinchu as the hubs), are regarded as global technology innovation hubs and China’s distribution centers in transnational technology flow. Among those, Chinese Hong Kong’s betweenness role of technology is strengthened due to linkage of transnational corporations and their branches, and low tax coverage of offshore finance, thus becoming the top city for technology transfer. Meanwhile, Chinese Taiwan’s core position is diminishing. (4) The breadth, intensity, and closeness of domestic technology transfer are conducive to the expansion of transnational technology import channels. Additionally, local economic level has positive effect on transnational technology transfer channels while technology strength and external economic linkage have multifaceted influences.

Cite this article

LIU Chengliang , YAN Shanshan . Transnational technology transfer network in China: Spatial dynamics and its determinants[J]. Journal of Geographical Sciences, 2022 , 32(12) : 2383 -2414 . DOI: 10.1007/s11442-022-2053-y

1 Introduction

Science and technology are widely endorsed to be the promoters of regions’ economic growth (Romer, 1986; Tödtling, 1992). They act as the necessities for nations, regions and corporations to cope with external constraints to achieve a long-term sustainable development (Lee, 1996; Antonelli and Fassio, 2016). Currently, economic globalisation and a new round of sci-tech revolution have accelerated the deep integration of industry and technology, so that knowledge globalisation and a large amount of transnational technology transfer are emanated and rapidly developed, which forms the complex global innovation network.
The global innovation network is a type of interconnection across organisation boundaries and geographical borders that integrates or disperses engineering, R&D activities, product development (Ernst, 2009), and also an important channel for the local to acquire external knowledge (Mathews, 2006). Heated debates have covered the transnational corporations’ global R&D network, technology innovation network of specific industries, and knowledge innovation network based on knowledge cooperation (Liu et al., 2017; Gui et al., 2019). The research perspective originated from the global to local scale, and recently has developed to the interaction of both globalisation and localisation, dubbed glocalisation (Swyngedouw, 2004; Cooke, 2006; Ernst, 2009). Among these prudent researches, technology transfer has called for special attention as being an important indicator to portray the complexity of global innovation network. Research contents towards technology transfer mainly discourse the main actors and their interrelationship (Rahm, 1994; Rao et al., 2011; Sun and Liu, 2017; Zeng and Li, 2019), strategies and channels (Bozeman, 2000; Peng and Li, 2013), efficiency and spillover (Wang et al., 2010; Feng and Ding, 2018), spatial evolution and its determinants (Battistella et al., 2016; Qian et al., 2016), etc. However, the research scales were usually onefold locked in nations (Wen, 2014; Donges and Selgert, 2019; Guan et al., 2022), urban agglomerations (Liu et al., 2019) or cities (Duan et al., 2018; Zhang and Gu, 2018), which showed a large constraint, as they overlooked the interaction of innovation networks in different scales (Chaminade and Plechero, 2015).
The perspective from the global-local (glocal) has gradually emerged to replace merely onefold research scale (Mathews, 2016). Since the 1990s, geographical scholars have begun discussing the connection of capital elements from glocal perspective. Regarding glocal network of knowledge and technology, Bathelt et al. (2004) firstly proposed the theory of global pipeline and local buzz to provide a fundamental framework in order to illustrate the interaction process of knowledge and technology elements glocally. On this basis, the concept of glocal innovation network was proposed later (Chaminade and Plechero, 2015). A large number of studies under this concept have discovered transnational corporations, in a glocal innovation network, can not only gain value from local network by coordinating and integrating internal technology knowledge, but also can absorb external information from non-local channels under different scales, thus realising a cross-regional knowledge and technology flow at a glocal scale (Swyngedouw, 2004; Sun and Cheng, 2019; Xia et al., 2019; Liu and Niu, 2020).
China has been continuing integrating into global innovation network since it joined WTO, and got much benefit from such cross-regional technology linkages. Existing research has demonstrated the gap is diminishing between technology innovation hubs in China and developed counties such as the USA, and China even has surpassed the USA regarding some indicators (Du et al., 2019), which means China has become one of the most important innovational economic entities and technology innovation centers. Meanwhile, current studies at a glocal perspective are still relatively fixed in scale (Sun and Cheng, 2019; Xia et al., 2019), thus possibly omitting the complex technology linkage between international, national, regional and local area (Mao and He, 2016; Mackinnon et al., 2019). It means the interaction mechanism of global pipelines at different scales, and also the local embeddedness of global pipelines still remain a riddle. The research towards spatial evolution of global technology network from Chinese perspective is also not yet sophisticated, which needs further study.
In view of the fact mentioned above, this article establishes a theoretical framework of technology transfer’s dual pipelines, and uses complex network method to depict the spatial evolution of transnational technology transfer network in China. It aims at revealing the influence mechanism of domestic technology channels on transnational technology channels, so as to enrich the theory of glocal innovation network. Finally, based on the research result, this article can also provide policy support for China’s initiative to construct worldwide innovation hubs and get further involved into global innovation network.

2 Theoretical framework and research methodology

2.1 Theoretical framework of technology transfer’s dual pipelines

Recently, with the rapidity of technology globalisation, acquisition of internal tacit knowledge and external new knowledge have been an important way to promote regional technology flow in the pursuit of harmonious economic development. Unless depict the interaction between local and external actors, and recombination of local and external elements from glocal muti-dimension can the scholars correctly understand the spatial paths of regional technology transfer and knowledge innovation.
The terms “global” and “local” in “glocal theory” are not fixed scales, but two terminals of a series of complex interactions (Dicken, 1994), and the general relation between the global and local (Coenen et al., 2012; Zhang et al., 2013). Glocalisation achieves a conversion from hierarchically organised system to loosely-coupled network (Boschma, 2005; He and Mao, 2015), which puts emphasis on the comprehensive effect of economic activities across different scales.
From glocal perspective, local cities play an increasingly important role in being a technology transfer node in global innovation network. With the help of R&D activities and market development (transnational corporations and intermediaries), knowledge production (universities and research institutions), and local innovation system (governments), cities with diverse innovation actors are embedded into global innovation network, which become important spatial carriers in global technology flow.
Also from glocal perspective, technology is led by International Technology Association and Local Technology Alliance. Technology channels are then prevailingly conceptualised as the stable channels for transferring, transplanting, absorbing and communicating explicit knowledge (production, equipment, patent, technical standard, technology license, etc.) and tacit knowledge (market information, innovation capacity), which is generated by formal or informal linkages (market transaction, FDI, New Argonaut, etc.) of the technology within or between the nations, regions, corporations and individuals (Si et al., 2016; Mao and He, 2019). In addition, technology channels also have multi-scale interdependency (Zhang et al., 2013), and the intensities can be primarily illustrated as transnational and domestic one. Transnational intercity technology channels mean the origin and terminal cities are in different countries or different regions during the technology transfer process, while domestic technology channels mean the process happens between cities within the same country or region. Transnational and domestic technology channels also interact bidirectionally (Trippl et al., 2009; Mao and He, 2019), forming a complex mechanism of “competition and complementation” towards channels’ intensity, breadth, distance, control ability, etc.
Diverse social and economic context (local economic level, technological strength, intensity of external linkage, etc. (Ivarsson and Alvstam, 2005; Broekel, 2015; Karreman et al., 2017; Květoň and Horak, 2018)) that affect local technology innovation capacity is embedded into the dual pipelines of transnational and domestic technology transfer through its actors’ structure and network relationship, which has done multiple effects on the pipelines. The local accumulates and recombines pre-existing knowledge and ideas (Aghion and Howitt, 1992), and relies on local clusters’ internal communication and linkage to promote innovation. It is this way that booms the dual pipelines. However, merely regrouping local knowledge or technology may conversely lead to the decrease of knowledge value, bringing out the “Locked-in Effect” (Boschma, 2005). The potential solution making senses is to strengthen external linkage to the series of non-local technology, so as to achieve “path breakthrough” (Bathelt et al., 2004; Bergman and Maier, 2009). Therefore, the pursuit of external technology channels has been regarded as the important driving force to promote the creation and evolution of local technology innovation (He et al., 2018).
To sum up, local technology innovation context influences external technology channels through the continuous local embeddedness. Transnational and domestic technology channels improve the local innovation capacity by technology flow. Therefore, local innovation context, domestic technology channels and transnational technology channels represent characters of openness, complexity and multiple interaction, which are symbiotic, competitive, cooperative and dynamically evolving (Figure 1). For instance, the enhanced local economy propels the industrial transformation to knowledge and human capital oriented, which stimulates emerging industries’ demand of external technology and accelerates traditional industries’ flow to periphery area (Perkins and Neumayer, 2005). Then, local technology strength made up by universities, research institutions, corporations, governments, etc., improves the flow and delivery of knowledge, information, resource, etc. in technology transfer channels (Wang et al., 2016). Thirdly, strengthened domestic technology channels and intensified external socio-economic linkages will benefit the diversity of local knowledge stock through learning and integrating diverse knowledge and technology (Yin et al., 2019). This can help the local to enhance the understanding of advanced exogenous technology and improve endogenous innovation capacity, so that will further facilitate transnational technology communication and cooperation.
Figure 1 The dual-pipeline theoretical framework of technology transfer from the glocalisation perspective

2.2 Research hypothesis

A large quantity of literature has demonstrated that channel breadth (degree centrality of node cities), intensity (weighted degree centrality), distance (closeness centrality) and control ability (betweenness centrality) have positive effect on cities’ innovation performance (Zhang et al., 2016; Gui et al., 2018a), so that cities occupying the central position in the network are more capable of controlling and scheduling innovation resource, thus being more possible to enhance innovation capacity, and produce further influence on transnational technology transfer channels. At the same time, local technology innovation context such as economic level, innovation capacity, external social economic linkage, etc. also has influence on technology transfer (Gui et al., 2018b). Therefore, this article raises the following hypotheses:
H1: The breadth of domestic technology transfer may have positive effect on transnational technology transfer channels.
H2: The intensity of domestic technology transfer may have positive effect on transnational technology transfer channels.
H3: The distance of domestic technology transfer may have positive effect on transnational technology transfer channels.
H4: The control ability of domestic technology transfer may have positive effect on transnational technology transfer channels.
H5: The local innovation context may have positive effect on its transnational technology transfer channels.

2.3 Research data and methodology

2.3.1 Data source and processing

Patent transaction is an important indicator to measure technology transfer, which can directly reflect technology market’s relationship between supply and demand (Liu and Guan, 2019; Liu and Niu, 2019). Therefore, this article uses patent transaction data to represent technology transfer, so as to measure the primary channels for regions to acquire external technology and also its flow direction from a glocal perspective. The data is gained by using distributed crawler extracting from China National Intellectual Property Administration (CNIPA) (http://www.cnipa.com/). The website was established by the national legal patent literature publishing unit, updated every week, including all publicly available international and domestic patent transfer records with high integrity. Acquired data involves China’s international (including Hong Kong, Macao and Taiwan) and domestic (excluding Hong Kong, Macao and Taiwan) intercity patent transaction data from 2004 to 2018, including the information of patent’s application number, classification number, assignor and address, assignee and address, transfer time, application time, guaranteed time, etc.
City is used as the basic analysis unit in the research. Each patent’s participating country and city are listed separately by data cleaning, and the city’s coordinates are obtained through Google Map API. The data processing is as follows: Firstly, when taking city as the unit (including Tianmen, Xiantao, Qianjiang and autonomous prefectures), Chinese Hong Kong and Macao are considered directly as city unit, while Chinese Taiwan can be divided into 6 municipalities (Taipei, Kaohsiung etc.) and 11 county-level cities (patent information within the county is counted to the county-level city) according to Taiwan’s administrative districts. Secondly, the data of cities in other countries or regions are cleaned by python and manual work. The filtering criteria are as follows. (1) The location of sub-national government (e.g. state governments in the USA) or top 5 cities by population size. (2) Innovative cities with well-known universities or R&D centers. (3) Cities with a population of more than 200 thousand. (4) Cities not meeting the above criteria will be grouped into the nearest qualified cities which can be reached within 45 minutes by ground transportation (Matthiessen and Schwarz, 2010; Csomos and Toth, 2016). The detailed transportation information is searched from Google Map. (5) If none of the above criteria is qualified, cities with more than 5 patent transfer or the only city having transfer record with China in a country are retained. Next step is to establish two spatial databases of transnational and domestic patent transfer records by only retaining the data involved intercity transfer. Finally, since a large number of transnational companies entered China after 2004, the number of transnational patent transactions has been continuously increasing after that year. Therefore, 2004 is regarded as the initial year of the research. In order to avoid the dramatical change interannually, this research divides the data into three periods from 2004 to 2008, 2009 to 2013, and 2014 to 2018 for cumulative analysis.

2.3.2 Network construction and modelling

Since intercity patent transaction is regarded as a flow with number and directivity, a directed-weighted network G(v, e) is constructed based on graph theory. Where node v represents the city involved in patent transfer process, and edge e represents the quantity of patent transfer between cities. The weighted asymmetric matrix M at global (transnational) or local (domestic) scale are constructed as:
$M=\left[\begin{array}{ccccc}0 & M_{12} & \cdots & M_{1(n-1)} & M_{1 n} \\M_{21} & 0 & \cdots & M_{2(n-1)} & M_{2 n} \\\cdots & \cdots & 0 & \cdots & \cdots \\M_{(n-1) 1} & M_{(n-1) 2} & \cdots & 0 & M_{(n-1) n} \\M_{n 1} & M_{n 2} & \cdots & M_{n(n-1)} & 0\end{array}\right]$
Then, centrality evaluation of complex network model is introduced:
(1) Degree Centrality (CD), means the number of other cities directly connected to this city, which illustrates the necessity of the city in the network. Because patent transfer network is a directional network, the node’s degree can also be divided into in-degree and out-degree. In-degree represents the number of cities transferring patent to this city, while out-degree represents the number of cities getting transferred patent from this city. Both of these indicators are used to illustrate every city’s breadth of transnational technology transfer channels:
$C_{D}(i)=\sum_{j=1}^{N} a_{i j}$
where aij represents the adjacency matrix of intercity patent transfer. Assign 1 if there has patent export (import), otherwise 0.
(2) Weighted Degree (CWD), means the sum of purchased and sold patents by a certain city. It can be divided into weighted in-degree and weighted out-degree. Weighted in-degree means the sum of patent number transferring to this city, while weighted out-degree means the sum of patent number transferred from this city:
$C_{W D}(i)=\sum_{j=1}^{N} x_{i j}$
where xij represents the actual number of patents that city i exports (imports) to (from) city j, that is, the intensity of technology transfer.
(3) Closeness Centrality (CC), means the ratio of the total number of other cities to the sum of the shortest paths from this city to all other cities, which illustrates the Eucildean distance of patent transfer between certain city and other cities. It can measure the closeness of related cities in technology channels:
$C_{c}(i)=\frac{N-1}{\sum_{j=1 ; j \neq i}^{N} d_{i j}}$
where dij represents the number of the shortest paths between city i and j, and N represents the number of node cities.
(4) Betweenness Centrality (CB), means the frequency with which certain city appears on the shortest path that connects other cities in the network. It represents transit capacity like “gateway” function of certain city. The larger betweenness the city has, the greater control ability this city has towards technology channels.
$C_{B}(i)=\sum_{j=1 ; k=1 ; j \neq k \neq i}^{N} \frac{N_{j k}(i)}{N_{j k}}$
where Njk represents the number of the shortest paths between city j and k, and Njk(i) represents the number of the shortest paths between city j and k that pass through city i.

2.3.3 Regression model

In regression analysis, the network’s linkage structure and node attributes are different concepts, so that they should be processed separately. Closeness centrality and betweenness centrality belong to the linkage structure of network, thus without any directionality. Meanwhile, the degree of node has directivity and weight. Due to the directivity involving export and import, the degree of node should be dealt with separately according to its direction and whether it should be weighted. Additionally, in order to secure the accuracy of analysis, every node city’s socio-economic indicators are set to be control variables.
Because the number of patent transfers between cities is a non-negative integer, and the variance of patent export and patent import is significantly greater than expected, it can be then regarded as “excessive dispersion”. Therefore, the panel negative binomial regression method is introduced to explore the factors that determine the intensities of China’s transnational technology channels:
$\begin{array}{l}T_{\mathrm{i}}=\alpha+\beta_{1} \text { indegree }+\beta_{2} \text { outdegree }+\beta_{3} \text { windegree }+\beta_{4} \text { woutdegree }+\beta_{5} \text { close }+ \\\beta_{6} \text { between }+\beta_{7} \text { pergdp }+\beta_{8} \text { exp }+\beta_{9} \text { imp }+\beta_{10} \text { tech }+\beta_{11} \text { fdi }+\beta_{12} \text { company }+\beta_{13} \text { innovation } \\+\beta_{14} \text { colleget } \varepsilon \\\end{array}$
where α is a constant term;ε is the random errorterm; T represents the sum of patent number that city i exports (imports) internationally; indegree represents city i’s in-degree value in domestic channels; outdegree represents city i’s out-degree value in domestic channels; In the same way, windegree and woutdegree represent weighted in-degree and weighted out-degree value, respectively. close and between represent closeness centrality and betweenness centrality, respectively. pergdp, exp, imp, tech, fdi, company, innovation, college in the equation represent city i’s GDP per capita, total export of goods, total import of goods, number of technicians, amount of actually-used foreign capital, number of listed corporations, number of national-recognised enterprise technical centers, number of universities, respectively.

3 Spatial evolution of China’s transnational technology channels

3.1 Spatial evolution of China’s transnational technology intensities

In the past 15 years, the number of foreign cities transferring technology with China had been increasing, which concentrated in North America, West Europe, East Asia and Southeast Asia (Figure 2). At the same time, the number of Chinese cities that took part in transnational technology transfer process was also increased, and their intensity of transfer was continuously strengthened. Finally, it shaped 4 global technology innovation hubs: urban agglomeration of north Chinese Taiwan, the Guangdong-Hong Kong-Macao Greater Bay Area, Yangtze River Delta, and Beijing-Tianjin-Hebei region (Figure 3).
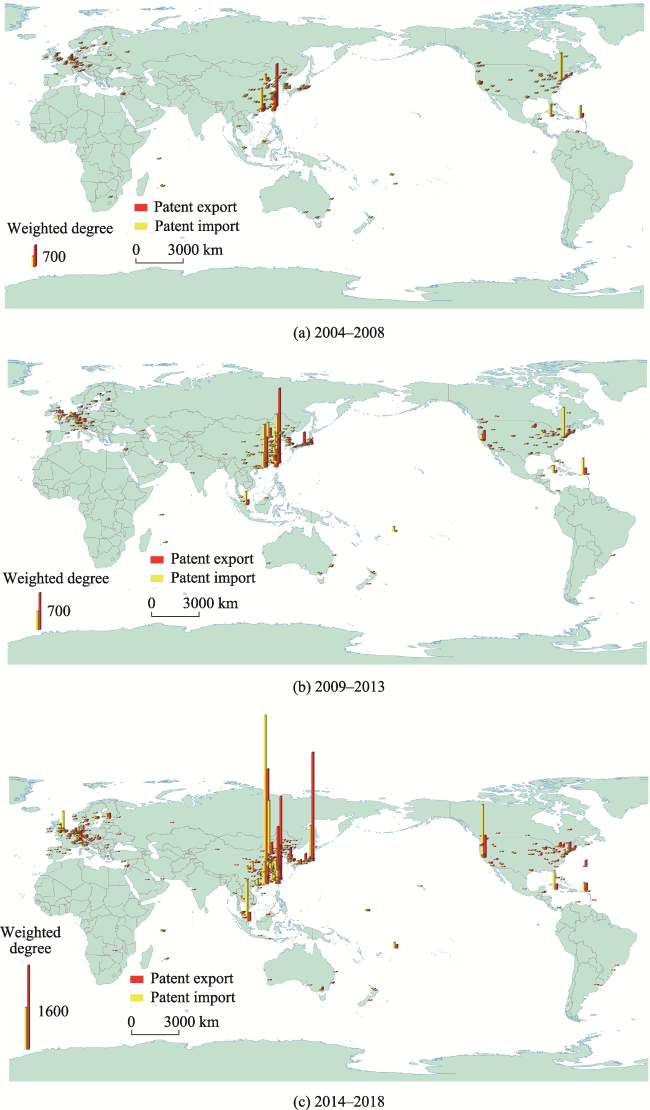
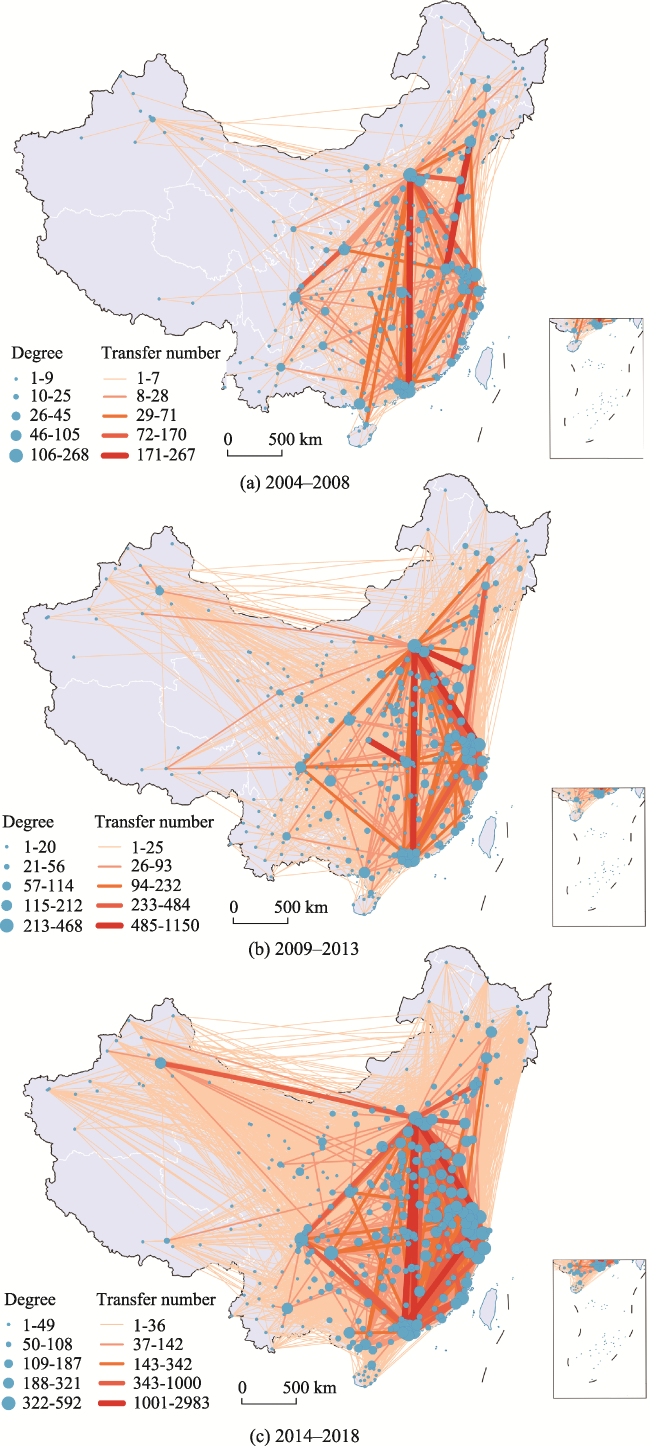
Figure 2 Spatial evolution of patent transfer intensities in China and overseas cities (2004-2018)
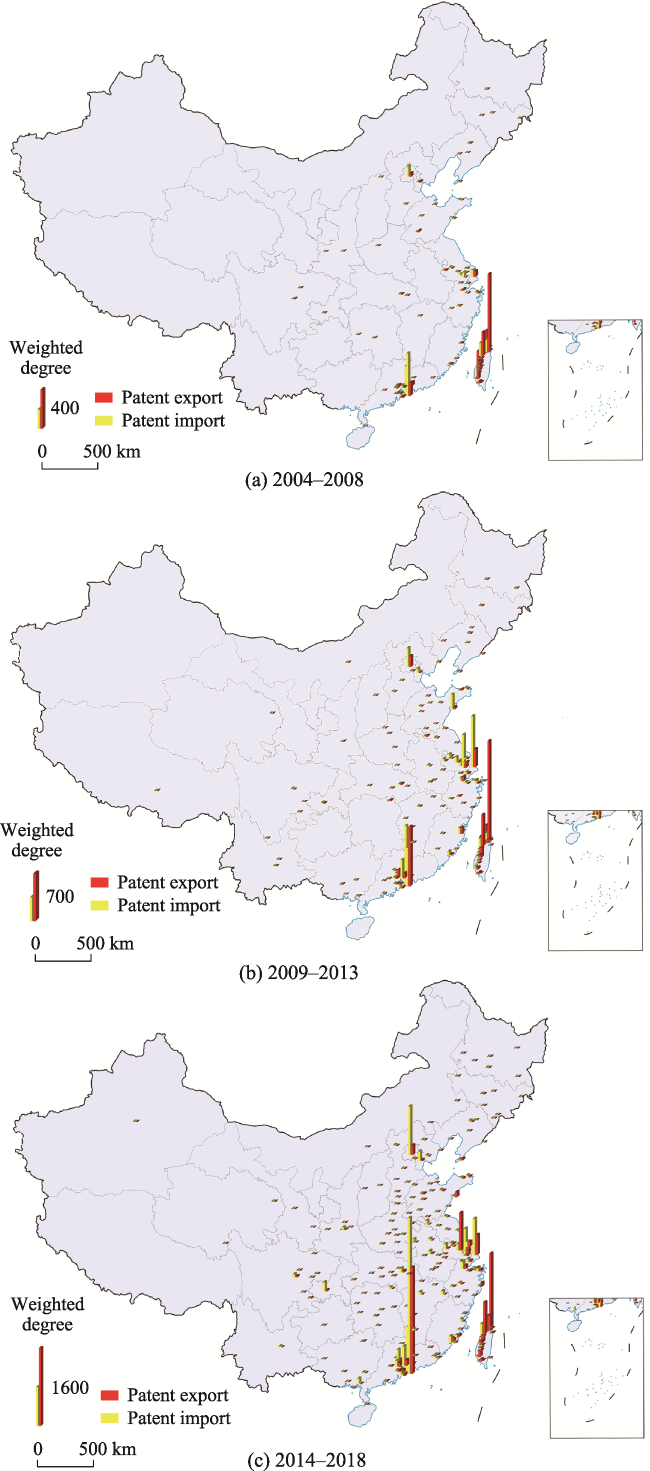
Figure 3 Spatial evolution of transnational patent transfer intensities in China’s cities (2004-2018)
(1) From 2004 to 2008, China primarily relied on Chinese Hong Kong and Chinese Taiwan to carry out technology transfer with foreign cities, and actively connected with global innovative cities, such as San Jose in the USA Silicon Valley, New York and Wilmington in the USA New York Bay Area, Eindhoven and Paris in West Europe, Caribbean offshore financial center, etc. Among them, patent export played a leading role in West Europe while patent import seemed to be the main activity in North America and the Caribbean. Domestically, the overall patent transfer intensity was weak, especially for patent export. Regarding patent export, Taipei, Tainan, Hsinchu, Taoyuan in Taiwan and Hong Kong ranked the top 5 cities due to the low tax rate, loose regulatory system and free foreign exchange settlement. Therefore, Taiwan and Hong Kong became the primary technology divergence center of China. Their imported patents are primarily from northeast coast of the USA (e.g. Wilmington) and technology centers along east coast of China (e.g. Shanghai and Beijing). Chinese mainland cities with comparatively strong technology export intensity were Shanghai, Shenzhen, Huizhou and Beijing, but remained huge gap with Hong Kong and Taiwan. In terms of patent import, the Greater Bay Area was recognised as the primary technology hub for importing patents due to its advantage of openness, high concentration of innovative enterprises and Hong Kong’s low-tax jurisdiction, which formed the two major technology convergence centers - Shenzhen and Hong Kong.
(2) From 2009 to 2013, innovative cities in North America (New York, Boston, Wilmington and San Jose) and Caribbean offshore financial centers (Georgetown and Road Town) had unceasingly demonstrated the position as hub cities in technology transfer process. Technology transfer centers in East Asia and Southeast Asia gradually emerged (Singapore, Osaka and Tokyo). At the same time, the technology transfer’s intensity of the Greater Bay Area, Yangtze River Delta, and Beijing-Tianjin-Hebei region increased rapidly, becoming the domestic primary technology convergence centers and growth poles of innovation. On one hand, San Jose, New York, Osaka, Tokyo and other cities were increasingly exporting technology to China, while Wilmington, Road Town, Singapore and Georgetown had become the hubs for importing technology from Taiwan, Hong Kong and the southeast coast of China. On the other hand, Taipei, Hsinchu, Taichung and Hong Kong still remained the core cities for China’s transnational technology export. Shanghai and Shenzhen’s export intensity followed them with the help of Shanghai’s R&D institutes of transnational corporations and Shenzhen’s local innovative companies. In addition, the innovative economy developed rapidly on the east coast, including the Greater Bay Area (Shenzhen, Hong Kong and Dongguan), Yangtze River Delta (Shanghai and Suzhou) and Beijing-Tianjin-Hebei region (Beijing). The external technology import intensity in these areas gradually increased, which made them the global technology convergence centers. During this period, Chinese cities’ demand for external technology had been increased, leading to the continuously strengthened intensity of technology import. At the same time, some innovation centers’ technology producing capacity also increased significantly, so that the export intensity quickly rose in turn, and the gap between technology export and import intensity was shrunk.
(3) From 2014 to 2018, developed cities in East Asia and Southeast Asia had become the primary targets that China interacted with. Chinese cities involved in transnational technology transfer were spreading from the southeast coastal areas to the central-west regions but areas with a large number of patent transfers were highly concentrated in 4 innovative urban agglomerations, namely, north Taiwan, the Greater Bay Area, Yangtze River Delta and Beijing-Tianjin-Hebei region. During this period, Tokyo and Seoul in East Asia, Singapore in Southeast Asia had replaced innovative cities in the USA and West Europe to be the top transnational export centers and import centers towards China, respectively. The urban agglomeration in north Taiwan takes Taipei, Hsinchu, Taichung and other cities as the technological growth centers, with stable patent transfer numbers and strong technology producing capacity, becoming the global technology divergence centers and production centers. The number of patent transfers in the Greater Bay Area grew rapidly and concentrated in Hong Kong, Shenzhen, Dongguan and Guangzhou. Among these cities, Hong Kong, due to its international free trade port, had low tax rate and loose supervision towards patent obtaining, holding and transferring, thus became the important transit place for China’s high-tech enterprises to import patent technology from Europe, the USA and East Asia; Shenzhen, relied on local innovation environment, R&D investment and concentration of innovative talents, equipment and industries, had significant improvement on technology producing capacity, and became the largest international technology producing center in China. On the contrary, the overall technology development of Yangtze River Delta was advanced, but what is different from the Greater Bay Area is that Yangtze River Delta’s intensity of export technology was higher than its import, which was concentrated in Shanghai, Hangzhou, Suzhou and Changzhou. For Beijing-Tianjin-Hebei region, the intensity of technology transfer was quite uneven within the region, that was, dominated by import technology and highly concentrated in Beijing while had limited scale of export technology.
On the whole, the oversea hub cities China primarily interacted with had transformed from New York Bay Area (New York, Boston and Wilmington), San Francisco Bay Area (San Jose and San Francisco) and Caribbean offshore financial center (Road Town, Georgetown) to East Asia (Tokyo and Seoul) and Southeast Asia (Singapore, etc.). Domestic hub cities involved in transnational technology transfer process transformed from Hong Kong, Taipei and Hsinchu to the costal technology innovation centers (Beijing, Shanghai and Shenzhen). In addition, the urban function of domestic hub cities transformed from the role of technology divergence (Taiwan) to the roles of technology convergence (Beijing, etc.), distribution (Yangtze River Delta) and transition (Hong Kong) as shown in Figure 3.

3.2 Spatial evolution of China’s transnational technology transfer channels

During 2004-2018, China’s transnational patent transfer channels showed a significant spatial heterogeneity in the global scope, mainly concerned with developed countries or regions in Europe, the USA and East Asia. The primary technology channels shifted from the USA, West Europe to East Asia and Southeast Asia, while the domestic technology transfer hubs transformed from Taiwan and Hong Kong to the southeast coast of China, highly concentrated in three innovative urban agglomerations of the Beijing-Tianjin-Hebei region, Yangtze River Delta and the Greater Bay Area. Hong Kong, Beijing, Shanghai, Shenzhen, etc., had become the global hubs of China to connect with the rest of the world.
(1) From 2004 to 2008, both China’s transnational technology export channels and import channels showed a significant spatial disassortativeness. Exported technology largely flew to New York Bay Area and Caribbean offshore financial center, while import flow was concentrated in West Europe and East Asia. The Chinese hub cities in these kinds of transnational technology flow were highly concentrated in international technology innovation centers like Taipei, Hsinchu, Beijing and Shanghai, as well as technology transit center as Hong Kong (Figures 4(1), 5(1)-a, 5(2)-a, and Table 1).
Table 1 Top 10 cities in terms of out-degree and in-degree from 2004 to 2018
Period Chinese cities Foreign cities
Out-degree Value In-degree Value Out-degree Value In-degree Value
2004-2008 Taipei 25 Hong Kong 26 San Jose 12 Road Town 14
Hong Kong 19 Taipei 20 Road Town 8 San Jose 7
Taichung 10 Beijing 17 Tokyo 5 Tokyo 6
Hsinchu 10 Shanghai 15 Liverpool 5 Georgetown 6
Shanghai 9 Hsinchu 10 New York 5 Wilmington 6
Beijing 8 Shenzhen 7 Los Angeles 4 Apia 5
Tainan 7 Wuxi 6 Georgetown 4 Port Louis 5
Taoyuan 7 Tianjin 5 Eindhoven 3 Houston 5
Hangzhou 5 Dalian 4 Wilmington 3 Chicago 5
Dongguan 4 Suzhou 4 Singapore 3 Los Angeles 4
Shenzhen 4 Seoul 3 Singapore 4
2009-2013 Hong Kong 38 Shanghai 60 Road Town 20 Road Town 14
Taipei 26 Hong Kong 50 San Jose 13 San Jose 7
Beijing 24 Suzhou 47 Tokyo 10 Tokyo 6
Shanghai 23 Beijing 44 Wilmington 10 Georgetown 6
Hsinchu 16 Shenzhen 30 Georgetown 8 Wilmington 6
Taichung 11 Taipei 22 Singapore 7 Apia 5
Suzhou 10 Tianjin 18 Los Angeles 6 Port Louis 5
Shenzhen 8 Hangzhou 13 Chicago 6 Houston 5
Taoyuan 8 Qingdao 13 Apia 5 Chicago 5
Hangzhou 7 Guangzhou 12 Melbourne 5 Los Angeles 4
Wuxi 12 Seoul 5 Singapore 4
2014-2018 Hong Kong 47 Hong Kong 65 San Jose 41 Road Town 21
Shenzhen 38 Beijing 59 Seoul 30 San Jose 20
Shanghai 36 Shanghai 57 Singapore 24 Tokyo 18
Taipei 28 Shenzhen 51 Tokyo 23 Singapore 14
Beijing 21 Suzhou 46 Road Town 21 Georgetown 11
Suzhou 20 Hangzhou 28 Osaka 18 Seoul 9
Xiamen 14 Guangzhou 26 Georgetown 18 Apia 8
Hsinchu 14 Taipei 25 Toronto 16 Los Angeles 8
Dongguan 12 Changzhou 21 Gyeonggi-do 16 Victoria 7
Taichung 11 Dongguan 19 New York 14 Chicago 7
Hsinchu 19 San Francisco 14
Firstly, the foreign nodes of China’s technology flow were highly concentrated in a small number of innovative cities in the USA, West Europe and East Asia. These innovation centers, which accounted for less than 20 percent of the total, carried more than 80 percent of China’s transnational patent transfer, as most cities only had 1 or 2 channels. Therefore, it demonstrated the flow of transnational technology transfer in China was highly unbalanced and that technology transfer activities were centralised in a few cities, presenting a typical Pareto distribution (80-20 rule).
Secondly, during this period, the overall scale of technology export was much higher than technology import in China, and Taipei became the divergence center in China’s transnational technology flow (Figure 4(1)-a). The number of Chinese patents exported over the five years (1290) had been 2.1 times that of those imported from other countries, and the technology channels were largely connected to Wilmington in the New York Bay Area, Road Town in the Virgin Islands of Caribbean, and Georgetown in the Cayman Islands. Among them, Delaware had become one of the most preferred locations for a large number of transnational corporations to register in the USA due to its political advantages in taxation and approval procedures (Giudic and Agstner, 2019), thus entitled “the world capital of corporations”. In addition, Wilmington in Delaware is also known as “the world capital of chemical engineering”, which has a developed chemical industry. With the connection between headquarters and branches of a variety of transnational corporations, it became the technology backflow place from R&D branches (Taipei and Hsinchu) in Taiwan. Road Town and Georgetown in British Virgin Islands and Cayman Islands are the world's famous offshore financial centers, with tax advantages, confidentiality rights and ideal foreign trade relations (Buckley et al., 2015), being the global technology transit places and registration choices for Taiwan’s and Hong Kong’s offshore innovative corporations. It could be seen that Chinese Taiwan (Taipei, Hsinchu, Tainan, etc.) had become the divergence center and hub for China’s transnational technology export (Figure 5(1)-a), and Taipei was regarded as the global innovation hub and the most important city in the transnational technology network of China. Taiwan and Hong Kong not only had a considerable volume of transnational patent export accounting for 87% of the total, but also developed a large breadth of patent export, whose out-degree value ranked top 10 in the overall technology transfer channels (Table 1).
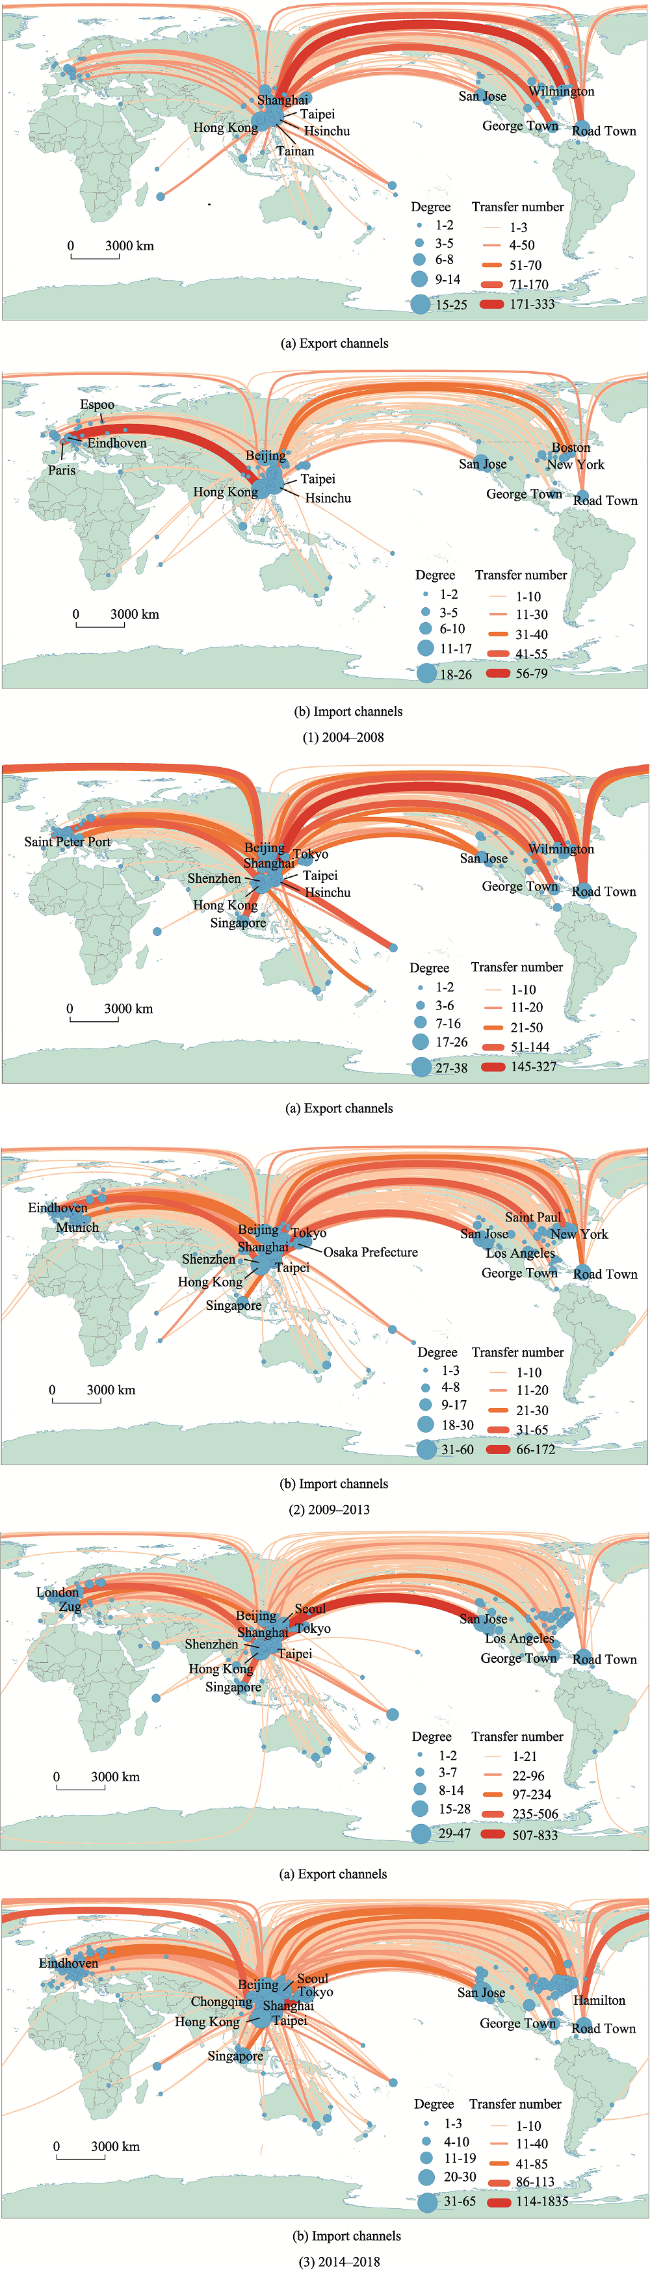
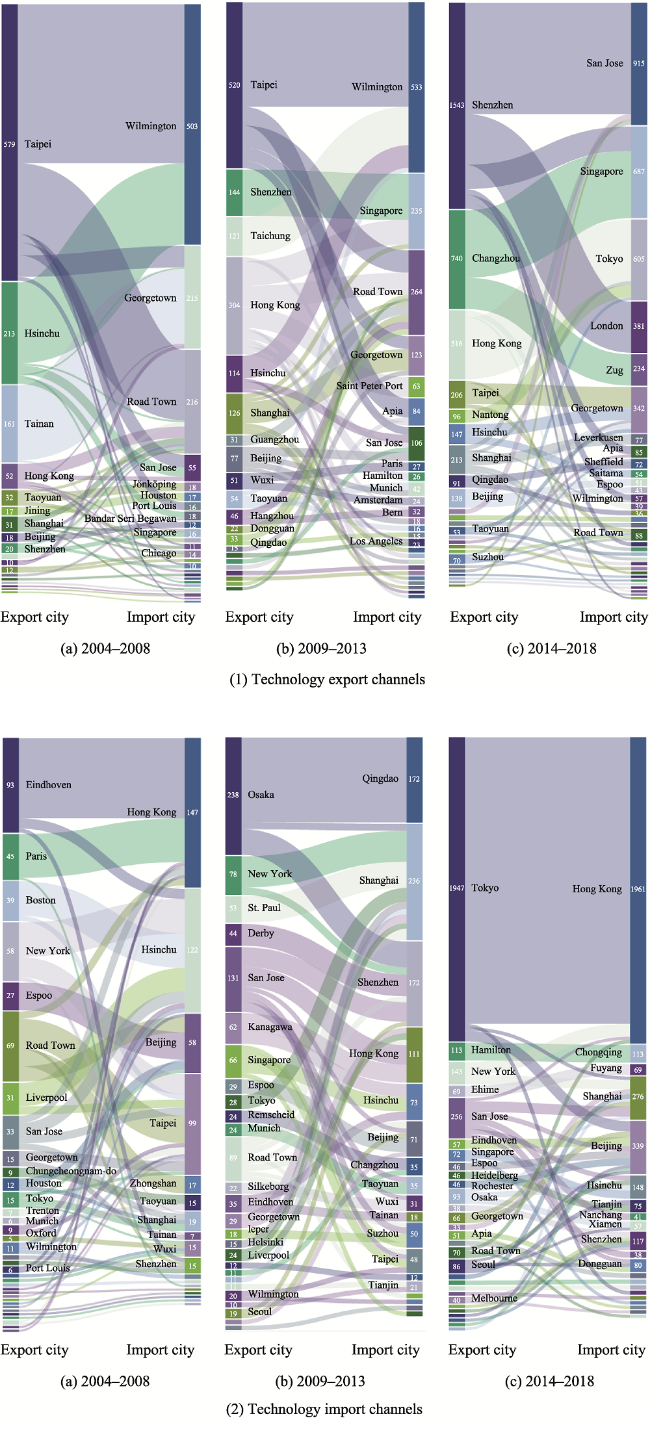
Figure 4 Spatial evolution of China’s transnational patent export (a) and import (b) channels (2014-2008) Drawing Review No.GS(2016)1666
Figure 5 Top 50 cities in terms of China’s transnational patent export (1) and import (2) intensity (2004-2018)
Thirdly, China relied heavily on technology from West Europe (France, Netherland, The United Kingdom, Finland, etc.) and the USA from 2004 to 2008, and Chinese Taiwan and Hong Kong became the convergence centers in China’s transnational technology flow (Figure 5(2)-a). During this period, China had imported up to 194 patents from West Europe’s innovative cities such as Eindhoven, Paris, Liverpool, etc., which was close to 204 patents from the USA. Hong Kong, Hsinchu and Taipei were the top 3 cities who had the largest number of transnational patent imported, accounting for 63% of the total. Their in-degree values in the transnational technology transfer network all exceeded 10 (Table 1). Eindhoven and Paris had become the main sources of patent imported to Hong Kong through transnational corporations’ headquarters-branches network. The amount of patent rights imported to Hong Kong of these two international cities was more than 50% of the Hong Kong’s total imported patents, ranking the top 2 cities in the overall China’s transnational technology import channels. On the other hand, New York, Boston, San Jose (the heart of Silicon Valley) in the USA and Road Town in Virgin Islands were the technology sources of Taiwan (Figure 5(1)-b). To sum up, the global technology producing centers and offshore corporation transit centers had become the original places for technology imported to China. There was a clear geographical division of labour between Hong Kong and Taiwan: the technologies imported to Hong Kong greatly originated from innovative cities in West Europe, while the technology imported to Taiwan primarily originated from global technology innovation centers in the USA and offshore financial centers in the Caribbean.
(2) From 2009 to 2013, compared with the last stage, China’s technology producing capacity was continuously rising. The number of transnational technology exports was equivalent to import, and the intensity and breadth of technology export channels and import channels were both increased. The overall network became denser, and its spatial heterogeneity was weakening but spatial disassortativeness was increasing. The core of the technology import network started to eastward move, so that Singapore rapidly emerged to be the third technology convergence center behind Wilmington in New York Bay Area and Road Town in British Virgin Area. At the same time, the original cities of technology import flow were increasingly dispersed, shifting from West Europe to the west coast of the USA, Japan and Singapore. The transnational technology divergence centers in China were greatly locked in Chinese Taipei and Hong Kong, while the convergence centers were concentrated in developed cities along the southeast coast such as Shanghai, Shenzhen, Qingdao, Beijing, etc. (Figures 4(2), 5(1)-b, 5(2)-b and Table 1).
Firstly, in the past 5 years, China’s transnational technology export channels had presented a coexistence of “path locked-in” and “path breakthrough”. On one hand, it was consistent with the last stage that Taiwan (concentrate in Taipei and Taichung) and Hong Kong were still the divergence centers for technology export whose out-degree value had always been in the top 10 of the overall technology transfer network (Table 1). It was the connection between transnational corporations’ headquarters and their branches that played a leading role in Hong Kong and Taiwan’s status maintenance. Their primary technology channels were greatly directed to Wilmington in New York Bay Area and global major offshore financial centers (Road Town, Georgetown and Apia). On the other hand, China’s technology export channels were gradually expanded with the emergence of new technology channels. Global innovation centers or global financial centers such as Singapore, Tokyo, San Jose had become the latest centers for absorbing Chinese technology, which had portrayed a spatial evolution from highly concentrated in West Europe and North America to dispersed in East Asia, Southeast Asia and the USA (Figures 4(2)-a and 5(1)-b); At the same time, Chinese metropolis such as Shenzhen, Shanghai and Beijing were also strengthening their innovation capacity, who had become the primary suppliers of Chinese patents. In addition, four innovative clusters - the Greater Bay Area, Yangtze River Delta, Beijing-Tianjin-Hebei region and north Taiwan agglomerations with Shenzhen and Hong Kong, Shanghai, Beijing, and Taipei as the cores were gradually forming, and had shown great potential of being global technology innovation clusters.
Secondly, during these 5 years, the spatial change of China’s transnational technology import channels was significant which presented a typical path creativity. On one hand, the origin cities transferring patent to China accelerated to expand from West Europe to Japan and the USA, which had the trend of decentralisation and diversification, while China still showed a high reliance on a small number of developed countries such as Japan and the USA (Figures 4(2)-a and 5(1)-b). In addition, the origin cities of patent import were dispersed in technology innovation centers in Osaka, Tokyo and Kanagawa in Japan, and the Silicon Valley, St. Paul in the USA, as well as dispersed in global financial centers in New York, Road Town, Georgetown and Singapore. However, the cities with a great number were still comparatively concentrated in Japan (with 314 patents imported from Tokyo and Osaka), the USA (with 290 patents imported from the Silicon Valley and New York Bay Area) and Singapore (with 85 patents imported). These three major innovative countries provided 55.1% of the total imported patents in China. On the other hand, Chinese technology convergence centers quickly moved from Taiwan and Hong Kong to coastal area, and greatly concentrated in three urban agglomerations - Pearl River Delta, Yangtze River Delta and Beijing-Tianjin-Hebei region. Some technology convergence centers (Qingdao, Suzhou, etc.) and technology distribution centers (Beijing, Shenzhen, Shanghai, etc.) rose immediately. Their in-degree values exceeded 20 in the whole network (Table 1), who had challenged the position of Hong Kong and Taiwan to become the new global technology gathering centers to absorb external technology.
To sum up, global technology producing centers and offshore corporation transit centers were still the primary origin places for China’s technology import. Among them, China showed increasing reliance on Japan and the USA, but decreasing reliance on West Europe.
(3) From 2014 to 2018, the spatial pattern of China’s transnational technology export channels and import channels was getting balanced. The core cities involved in technology transfer were increased, and China’s linkage with East Asia and Southeast Asia was intensified, displaying an eastward movement of technology flow corresponding with global financial centers. Technology export flow was mainly directed to the global city regions like the Silicon Valley in the USA, Singapore, London in the UK and Tokyo in Japan. Meanwhile, the technology import flow was concentrated in global technology innovation centers and financial centers like Tokyo and Seoul in East Asia, and Silicon Valley in the USA. China’s coastal innovative cities such as Shenzhen, Shanghai and Beijing constantly grew up and became the core hubs for China’s transnational technology channels. Taiwan’s role of technology transit had been declined significantly (Figures 4(3), 5(1)-c, 5(2)-c and Table 1).
Firstly, the number of China’s technology exports continued to increase. The primary export destination transferred from the USA to West Europe, East Asia and Southeast Asia, displaying the evolution from two cores (Wilmington in the USA and Road Town in the Caribbean) to multi-centers (Silicon Valley, San Francisco, Singapore, Tokyo, London, etc.) which were dotted-clustered in the USA’s west coast, West Europe and East Asia, showing a trend of highly concentrated in global financial centers and technology innovation centers. With the advantages of technology capacity (Silicon Valley, Tokyo, Singapore, etc.), clusters of transnational corporations and their branches (Tokyo, London, Silicon Valley, etc.), and global financial centers with low-tax regions (Singapore, Tokyo, London, etc.), these cities became the registration places for China’s metropolitan innovative corporations and technology distribution places for conducting technology transfer. Finally, they correspondingly formed three types of technology transfer hubs, which are technology-dominated, headquarter-clustered and finance-dominated (Figure 5(1)-c).
Secondly, China’s primary technology import channels accelerated to shift to Asia-Pacific regions, and showed a greater reliance on Japanese technology than the USA’s. Hong Kong, Shenzhen, Beijing and Shanghai in coastal area became the convergence centers in China’s transnational technology flow. The phenomenon mentioned above was reflected in detail as follows: (1) The number of patents imported from Japan exceeded the USA significantly. For example, merely the volume of technology flow from Tokyo to Hong Kong had already reached 1835 which were far more than the total import from the USA’s 1197, demonstrating a declining reliance on the USA’s technology (Figure 5(2)-c). (2) China had formed a significant regional division towards transnational technology import channels, mainly imported from global technology producing centers. Tokyo became the main source of Hong Kong through its machinery, engineering, high-tech communication, and the network of headquarters and branches; Besides, New York, San Jose (Core regions in Silicon Valley) and Seoul became the primary suppliers to a large number of technology innovation centers in China such as Beijing and Shanghai; The global technology innovation centers in the USA became the primary technology origins for Taiwan. (3) China’s transnational technology import channels accelerated to move eastward, so that Tokyo and Osaka in Japan, Seoul, Gyeonggi-do in Korea and Singapore became the new hubs. Their in-degree value ranked top 10 in the whole technology import network. The connection between transnational corporations’ headquarters and their branches, and technical alliance became the main organizing forms for China’s technology import channels, including Singapore-Changzhou (e.g. AAC Technologies Headquarter-AAC R&D Centers), Tokyo-Hong Kong (e.g. NEC Corporation-Hong Kong Lenovo Innovation Co., LTD; Seiko Epson Corporation-Boe Technology (HK) Limited; Johnson Controls Hitachi Air Conditioning (Tokyo) Co., LTD-Johnson Controls Hitachi Air Conditioning (Hong Kong) Co., LTD, etc.).
To sum up, the total number of China’s transnational technology transfers increased every year, and the intensity of technology transfer gradually increased at the same time. The primary target area moved from the New York Bay Area and Silicon Valley in the USA, the Caribbean offshore financial center and London global financial center to technology innovation centers in East Asia and Southeast Asia, such as Tokyo, Singapore and Seoul. China’s innovation capacity was also strengthened with the emergence of global technology innovation centers like Shenzhen, Beijing and Shanghai, and gradually formed three major coastal innovation clusters - the Greater Bay Area, Beijing-Tianjin-Hebei region and Yangtze River Delta, with Shenzhen, Beijing and Shanghai as the core, respectively. Hong Kong’s role as global technology hub of betweenness was constantly increased while the technology producing centers in Taiwan showed declined importance in the network.

4 Determinant factors of China’s transnational technology transfer channels

By comparing China’s transnational technology network and the domestic one (Figures 4 and 6), this research discovers that they have a high degree of spatial assortativeness at glocal scale that the rising technology innovation centers and their innovation clusters are not only the hubs of transnational technology transfer, but also the growth poles and innovation hubs of domestic technology transfer.
Figure 6 Spatial evolution of domestic patent transfer network in China
In order to further analyse the internal acting mechanism of the two networks, this study refers to the research paradigm of capital factors from glocal perspective (Shi et al., 2019), that is, based on Hausmann test, uses a panel negative binomial regression model with random effect to portray the influential mechanism of domestic technology channels’ structure and local innovation context on transnational technology channels (Zhang et al., 2016; Link et al., 2019; Si et al., 2019).
Due to the directivity of patent transaction, two explained variables-patent import intensity and export intensity are respectively analysed by regression model (Tables 2 and 3). Correspondingly, explaining variables are also analysed through dual directions. Among the models, 1-5 and 9-13 measure the influence of domestic technology network structure, while 6-8 and 14-16 reveal the influence of local innovation context through multi-dimensional socio-economic indicators of the city. Models 1, 3, 9 and 11 are used to demonstrate Hypothesis H1; models 2, 4, 10 and 12 are used to demonstrate Hypothesis H2; models 5 and 13 are used to demonstrate hypotheses H3 and H4; models 6-8 and 14-16 are used to demonstrate Hypothesis H5.
Table 2 Results of panel negative binomial regression
Explaining variables Transnational patents import
Model 1 Model 2 Model 3 Model 4 Model 5 Model 6 Model 7 Model 8
In-degree 0.25**
(2.08)
Weighted in-degree 0.30***
(3.64)
Out-degree 0.26**
(2.45)
Weighted out-degree 0.27***
(4.45)
Closeness centrality 3.34***
(3.60)
Betweenness centrality -0.00002
(-0.23)
GDP per capita 1.14***
(6.43)
0.69***
(3.20)
1.08***
(5.68)
0.75***
(3.85)
0.70***
(3.00)
1.46***
(9.34)
Total export of goods 0.34***
(2.61)
0.26**
(2.30)
0.34**
(2.52)
0.29**
(2.45)
0.31***
(2.78)
0.42***
(2.66)
0.32***
(4.25)
Total import of goods -0.25***
(-2.98)
-0.16*
(-1.93)
-0.24**
(-2.59)
-0.18**
(-1.98)
-0.14
(-1.46)
-0.31***
(-3.26)
-0.11*
(-1.69)
Number of technicians 0.72***
(5.72)
0.67***
(5.54)
0.71***
(5.16)
0.69***
(5.09)
0.65***
(4.99)
0.74***
(5.90)
0.36**
(2.53)
Amount of actually-used foreign capital 0.12
(0.91)
0.13
(1.01)
0.13
(1.00)
0.13
(0.99)
0.10
(0.75)
0.09
(0.73)
0.22***
(2.84)
Number of universities -0.46***
(-4.07)
-0.46***
(-4.45)
-0.46***
(-4.00)
-0.46***
(-4.43)
-0.39***
(-3.79)
-0.39***
(-3.79)
-0.42***
(-4.19)
Number of listed
corporations
-0.06
(-0.32)
-0.04
(-0.19)
-0.08
(-0.40)
-0.11
(-0.59)
-0.07
(-0.39)
-0.01
(-0.55)
0.19
(1.61)
Number of national-
recognised enterprise
technical centers
-0.04
(-0.30)
-0.07
(-0.51)
-0.05
(-0.33)
-0.05
(-0.33)
-0.08
(-0.51)
-0.001
(-0.01
0.39***
(3.85)

Note: The statistical results, * p < 0.1, ** p < 0.05, *** p < 0.01

Table 3 Results of panel negative binomial regression
Explaining variables Transnational patents export
Model 9 Model 10 Model 11 Model 12 Model 13 Model 14 Model 15 Model 16
In-degree 0.35**
(2.09)
Weighted in-degree 0.38***
(4.35)
Out-degree 0.35**
(1.99)
Weighted out-degree 0.35***
(4.20)
Closeness centrality 5.44***
(3.53)
Betweenness centrality -0.00002
(-0.15)
GDP per capita 0.81*
(1.66)
0.40
(1.09)
0.73
(1.40)
0.36
(0.90)
0.13
(0.45)
1.17***
(3.20)
Total export of goods 0.10
(0.88)
0.10
(0.99)
0.12
(1.11)
0.11
(1.17)
0.15
(1.33)
0.19
(1.52)
0.35***
(2.91)
Total import of goods 0.04
(0.30)
0.08
(0.74)
0.07
(0.54)
0.09
(0.86)
0.14
(1.43)
-0.03
(-0.25)
-0.06
(-0.54)
Number of technicians 0.21
(1.04)
0.18
(0.96)
0.17
(0.83)
0.18
(0.95)
0.19
(0.91)
0.22
(1.05)
0.06
(0.29)
Amount of actually-used foreign capital -0.27
(-1.33)
-0.32*
(-1.71)
-0.29
(-1.38)
-0.27
(-1.35)
-0.29
(-1.42)
-0.32
(-1.54)
0.04
(0.32)
Number of universities 0.003
(0.01)
-0.02
(-0.09)
0.02
(0.06)
-0.007
(-0.03)
-0.04
(-0.20)
0.04
(0.15)
-0.17
(-0.69)
Number of listed
corporations
-0.04
(-0.19)
-0.09
(-0.51)
-0.08
(-0.39)
-0.12
(-0.73)
-0.05
(-0.25)
-0.03
(-0.12)
0.23
(1.15)
Number of national-
recognised enterprise technical centers
0.10
(0.54)
0.20
(1.08)
0.12
(0.60)
0.12
(0.65)
0.10
(0.59)
0.15
(0.72)
0.41***
(2.70)

Note: The statistical results, * p < 0.1, ** p < 0.05, *** p < 0.01

4.1 The effect of domestic technology transfer channels

(1) The expansion of local innovation network has significantly promoted innovative cities to integrate into global innovation network and import oversea technology.
Firstly, the breadth of domestic technology transfer has significantly motivated the absorption of oversea technology. The result of models 1 and 3 shows the in-degree and out-degree value (reflect the scope and breadth of technology linkage) of domestic technology network has a greatly positive effect on the volume of oversea technology imported. It demonstrates the more domestic technology transfer channels the city owns, the stronger diffusion and absorption capacity towards oversea technology import it has, thus beneficial to the development of transnational technology import channels.
Secondly, the intensity of domestic technology transfer promotes the import of oversea technology. Based on the result of models 2 and 4, the weighted in-degree value and weighted out-degree value (represent the intensity of technology transfer) of domestic technology transfer network shows positive effect on the import of oversea technology, which illustrates domestic technology transfer can improve city’s technology absorption and innovation capacity (Bathelt et al., 2004). Therefore, domestic technology transfer can effectively strengthen the imitation of external technology and local innovation capacity, thus extending the transnational technology import channels, which has demonstrated the previous research’s conclusion on the driving mechanism of regional technology transfer (Yang and Liu, 2014).
Thirdly, city’s closeness in domestic technology transfer network is beneficial to the import of oversea technology. The result of Model 5 shows city’s closeness centrality in the domestic network has positive correlation with its volume of oversea technology import. That is, the stronger linkage capacity the city has in domestic technology transfer network, the shorter pathway to acquire (spread) technology patent from (to) other cities domestically, which can not only improve the local innovation capacity, but also benefit the learning and absorbing of diffused transnational technology. Therefore, it further demonstrates the technology network structure’s innovation performance mechanism (Cheng and Wang, 2013; Zeng and Wang, 2014).
(2) The breadth, intensity and closeness of local technology channels are conducive to innovative cities’ transnational technology export and global network forming.
Firstly, the breadth of domestic technology transfer has positive effect on local technology’s transnational export. The result of models 9 and 11 shows the more extensive the domestic technology transfer channels are, the bigger degree of opening the technology transfer have, and the better local innovation capacity as well as international cooperation and competition capacity the city owns (Cheng and Wang, 2013). It is this mechanism that promotes the development of transnational technology channels.
Secondly, the intensity of domestic technology transfer also has positive effect on the local embeddedness in global innovation network. The result of models 10 and 12 shows city’s intensity of domestic technology transfer has positive correlation with transnational technology export, which demonstrates city’s breadth of intercity technology transfer has greatly positive effect on improving innovation performance and optimising innovation network (Gui et al., 2018a).
Thirdly, city’s closeness in domestic technology transfer plays a vital role in the export of local technology. The result of Model 13 shows that city’s closeness centrality in domestic technology transfer network has significantly positive correlation with its intensity of transnational technology export, that is, the closer linkage between cities can enhance the communication among industry clusters and multi-clusters’ network, so as to promote the spill-over of new technology (Zhou et al., 2019).
To sum up, local city’s breath, intensity and closeness in domestic technology network have significantly positive correlation with its development and expansion of transnational technology import and export channels. Especially, the intensity of domestic technology transfer has the strongest effect, which demonstrates hypotheses H1 to H3. Furthermore, the node’s betweenness centrality in the domestic network has no obvious effect on its transnational technology transfer, so that H4 cannot stand.

4.2 The effect of local technology innovation context

(1) Local city’s innovation context has significant effect on its integration into global innovation network and promotion of oversea technology import.
Firstly, local economic level greatly affects its absorption of oversea technology. The result of models 1-6 shows that city’s economic development level (GDP per capita) can significantly illustrate its volume of oversea technology import, that is, city’s economic development level drives the import and absorption of external technology because of high technique demand brought by industrial vitality.
Secondly, local technology strength has multiple influence on oversea technology import. After comprehensively analysing models 1-7, this research discovers city’s effort on recruiting technicians and building national-recognised enterprise technical centers can effectively enhance the intensity of external technology import, while the number of universities can restrain the oversea technology import. Therefore, Hypothesis H5 cannot stand. The potential reason is that the main body of transnational technology transfer is the cities with highly concentrated corporations, technicians and national-recognised enterprise technical centers, so that they have a better technology stock and R&D level to absorb oversea technology more effectively. Meanwhile, Chinese universities play a limited role in the process of technology transfer, thus providing little technology transfer, which shows the maladjustment of the coupling of urban higher education with its technology producing capacity (Xiao and Liu, 2018). These elements usually hinder the subsequent development of corporations’ technology innovation (Xu, 2013). Therefore, the number of universities inhibits the development of transnational technology import channels.
Thirdly, city’s intensity of external economic linkage has multiple effects on its intensity of transnational technology import. The result of models 1-6 and 8 shows city’s volume of goods export can promote the oversea technology import, while its volume of goods import has negative correlation with oversea technology import. Goods export is regarded as the important channel for cities’ external economic linkage, which promotes acquisition of spill-over information to form a stable intercity cooperation, so that it facilitates the import and absorption of oversea technology. However, the result that the volume of goods import has adverse effect on transnational technology import, which is different from the previous researches (Zhang and Sun, 2011). The reason may be the increasing scale of imported consumer goods whose average of annual growth rate is beyond 10%. The reliance on imported consumer goods can suppress the local innovation capacity (Zhou, 2019), becoming difficult to produce technology learning and absorption activities. On the other hand, city’s increased amount of actually-used foreign capital can promote the economic cooperation and technology communication between domestic cities and foreign corporations, so that it facilitates the expansion of oversea technology import channels, but the regression result is not robust enough.
(2) Local technology innovation context has positive effect on the intensity of transnational technology export, but the robustness is weak.
Firstly, local economic level has positive effect on the volume of transnational technology exported. Together with the result of models 9-14, city’s higher economic development level (GDP per capita) means the better production efficiency, so that it usually links with higher technology investment and R&D capacity. This will definitely bring a stronger technology export capacity.
Secondly, local technology strength and degree of openness have a certain influence on its intensity of transnational technology export, but the robustness is weak. The result of models 9-16 illustrates that when taking the number of national-recognised enterprise technical centers and volume of goods export as two variables for regression, local technology strength and degree of openness have positive effect on the intensity of transnational technology export. However, when taking multiple indices for regression, the majority of them are no longer significant. Specifically, the larger number of national-recognised enterprise technical centers the city has, the greater technology innovation capacity and international competitiveness it owns, and the closer transnational economic linkage and technology communication it conducts. On the other hand, international standard that the export goods referring to is often stricter, and requires relevant companies to master more advanced technology. Therefore, it promotes relevant foreign trade enterprises’ innovation capacity (Li et al., 2016).
To sum up, towards the import and export of transnational technology, local economic level has a significant positive effect while technology strength and external economic linkage have multiple effects. Among them, local city’s volume of goods export, amount of foreign direct investment, the number of technicians and the number of national-recognised enterprise technical centers are conducive to transnational technology import, but the volume of goods import and the number of universities have adverse effects. In addition, goods export and national-recognised enterprise technical centers promote the development of transnational technology export pipelines weakly.

5 Conclusions and policy implications

5.1 Conclusions and discussion

This article based on China’s transnational and domestic intercity patent transfer data, has integrated big data mining, complex network analysis, GIS spatial analysis and spatial econometrics to systematically portray the spatial evolution of China’s transnational technology network in 15 years. At the same time, it is also based on the theoretical framework of the dual pipelines of technology transfer from glocal perspective to analyse the influence mechanism of local innovation network and local innovation context on the evolution of China’s transnational technology channels:
(1) The form and development of transnational intercity technology channels shows a significant spatial heterogeneity while gradually weakened and balanced over time. The primary foreign cities involved in technology transfer network evolves from two cores (Wilmington in New York Bay Area and the Caribbean offshore financial center) to multi-centers (Major technology innovation centers and offshore financial centers, such as Silicon Valley in the USA, New York Bay Area, Tokyo, Seoul and Singapore). The eastward movement of the transnational technology channels accelerated overall, which demonstrates that China shows a decreased reliance on the technology from the USA and West Europe.
(2) There is a spatial disassortativeness between import channels and export channels of transnational technology network. Chinese Hong Kong, Shenzhen, Beijing and Shanghai are regarded as the hubs of transnational technology import network and the origin import cities are concentrated in West Europe and East Asia. On the other hand, Chinese Taiwan is regarded as the technology producing hub and Hong Kong is the transit center in technology export flow. The flow is primarily directed to technology innovation centers in the USA and the Caribbean offshore financial centers.
(3) Transnational technology transfer shows great reliance on a small number of metropolitan regions, so that global technology innovation centers along southeast coastal area in China are constantly emerging such as Shenzhen, Beijing and Shanghai, and then being greatly concentrated to form 3 major technology innovation clusters: The Greater Bay Area, Beijing-Tianjin-Hebei region and the Yangtze River Delta. Among them, Chinese Hong Kong’s betweenness role (gateway position) is strengthened with its advantage of proximity to Chinese mainland market, close linkage between transnational corporations’ headquarters and their branches, and low tax rate in offshore financial center. However, Chinese Taiwan’s technology distribution role (hub position) is continuously weakened.
(4) The evolution of transnational technology channels shows a significant path dependence and path breakthrough. On one hand, China’s transnational technology transfer channels are highly directed to a small number of developed countries like Japan and the USA. Global technology producing centers and offshore financial centers are still the main origin places for technology import, and Taiwan and Hong Kong remain the hub position during transnational technology transfer process. On the other hand, the oversea core cities involved in China’s transnational technology transfer is accelerating to move to Asian-Pacific regions and the new technology channels are constantly generated, so that China’s reliance on technology from the USA and West Europe continues to decrease. At the same time, Chinese technology innovation centers in southeast coastal regions are rising such as Shenzhen, Beijing and Shanghai, and gradually replace Taiwan to be the new hubs of technology transfer.
(5) City’s local innovation network and innovation context are conducive to its integration into global innovation network. The research result shows local city’s technology network, economic development level, technology strength and external linkage intensity have positive effect on its expansion and development of transnational technology transfer channels. Local technology channel breadth, intensity and closeness can be beneficial to local embeddedness in global innovation network, which has a significantly positive effect on local development of both transnational technology import and export channels. On the other hand, local technology innovation context has multiple effects on its expansion of transnational technology channels: Firstly, local economic level, volume of goods export and number of national-recognised enterprise technical centers are conducive to improving local capacity of technology producing, absorbing and transforming, which does benefit to city’s import and export of transnational technology; Secondly, local amount of foreign direct investment and number of technicians also have significantly positive effect on transnational technology import, but its volume of import goods and number of universities suppress the transnational technology import; Thirdly, local technicians, foreign direct investment, goods export and university have limited effect on the expansion of city’s transnational technology export channels.
(6) The evolution mechanism of glocal innovation network is a front topic combining with science innovation geography and global economic geography. Although this article tries to illustrate the influence of local innovation context and local innovation network on the spatial evolution of China’s transnational innovation network, it has obvious limitation that needs to be further dealt with: due to the limitation of data itself, this article does not identify the relationship between the parties of the patent technology transaction and the actual users, which may lead to the deviation of the technology supply and demand analysis; This article merely discusses the influence of domestic technology channels on transnational technology transfer channels, so that the coupling mechanism between transnational technology channels and domestic technology channels need to be further discovered; Patent transaction is an effective indicator to measure the supply and demand of technology market, but it is not comprehensive, thus a more comprehensive analysis should be conducted from the aspects of communication and cooperation of knowledge, the trade of technology products and cooperation of scientific research project; This article also overlooks the further comparison of different types of technology patent transfer’s spatio-temporal heterogeneity, especially for those “strangled” technology.

5.2 Policy implication

(1) The oversea cities involved in China’s transnational technology channels are highly concentrated, which shows China has a continuous reliance on technology from developed countries like the USA and Japan, thus being risky to integrate into global innovation network. On one hand, it is necessary to expand the breadth of technology import so as to promote the technology transaction between countries (regions) along the Belt and Road. It is in this way that we can improve the diversity and balance of transnational technology channels. On the other hand, China should continue to seek self-independence in science and technology, at the same time, strengthens national strategic technology capacity, fosters innovation growth poles and develops a series of comprehensive national science centers and regional innovation hubs.
(2) The spatial organisation of China’s transnational technology channels is due to the linkage between transnational corporations’ headquarters and their branches, which means being highly controlled by foreign transnational corporations. Therefore, Chinese corporations should be continuously encouraged to develop globally and construct R&D centers. This type of Chinese corporations should be actively involved in global innovation network and gather and make full use of global innovation elements; At the same time, they should also strengthen the technology trade and R&D cooperation with foreign transnational corporations, top universities and research institutions, so as to expand the channels of technology transfer and achieve technology spill-over.
(3) Chinese hub cities integrated in global innovation network are highly concentrated in a small number of technology innovation centers in southeast coastal region, which has limited radiation capacity to motivate the inland. On one hand, China should make full use of the technology spill-over effect generated by highly concentrated innovation activities to accelerate the development of innovation hubs especially Beijing-Tianjin-Hebei region, the Greater Bay Area and the Yangtze River delta with the innovative cities Beijing, Hong Kong, Shenzhen and Shanghai as the cores. At the same time, Chinese mainland should also strengthen its technology market alliance with Taiwan to establish a cross-straits innovation community, and construct a comprehensive and unified technology transfer market as well as the efficient transfer mechanism, so as to promote the integrated development of intercity technology within innovation clusters. On the other hand, China should also strengthen the technology transfer and transform between different innovation clusters to improve the technology linkage and cooperation between innovation clusters and inland cities. Furthermore, an innovative city system containing hierarchy and connection of function among different levels should be constructed, so as to encourage technology innovation, attract technicians and improve university-industry cooperation to strengthen the R&D and technology transfer capacity of primary innovative cities. This innovative city system can increase the density and flow of intercity technology channels, so that the improved intensity of transnational technology channels can be achieved to radially promote the overall domestic development and propel innovative clusters at different levels in the hierarchy of national innovative system to develop collaboratively.
(4) The development of local innovation network and innovation context have significantly positive effect on the expansion of China’s transnational technology channels, but currently universities and national-recognised enterprise technical center have provided limited support for local integration into global innovation network. At one hand, national role of exerting top universities and technology institutions to produce knowledge, and the role of cultivating talents remain to be further developed. China should intensify the deep integration of knowledge chain, innovation chain and industrial value chain, to promote an integrated innovation system of production, education and research, so as to ensure the local advantages in global technology competitiveness and cooperation. On the other hand, China should also accelerate to improve national technology transfer system, which contains vigorous development of intermediaries for socialising technology transfer, improvement of the intellectual property protection, expansion of the transfer channels among corporations, universities and research institutions, accelerated construction of international technology transfer centers, and global layout of technology transfer carriers.

Acknowledgement

We appreciate Dr. Weisheng Mao and Dr. Junxian Piao from School of Urban & Regional Science in East China Normal University who have helped us with theoretical framework improvement and text amendment in this article. We also show our deepest gratitude to the two anonymous reviewers for their valuable comments which have the greatest help to the improvement of our article.
[1]
Aghion P, Howitt P, 1992. A model of growth through creative destruction. Econometrica, 60(2): 323-351.

DOI

[2]
Antonelli C, Fassio C, 2016. Academic knowledge and economic growth: Are scientific fields all alike? Socio-Economic Review, 14(3): 537-565.

DOI

[3]
Bathelt H, Malmberg A, Maskell P, 2004. Clusters and knowledge: Local buzz, global pipelines and the process of knowledge creation. Progress in Human Geography, 28(1): 31-56.

DOI

[4]
Battistella C, De Toni A F, Pillon R, 2016. Inter-organisational technology/knowledge transfer: A framework from critical literature review. The Journal of Technology Transfer, 41(5): 1195-1234.

DOI

[5]
Bergman E M, Maier G, 2009. Network central: Regional positioning for innovative advantage. Annals of Regional Science, 43(3): 615-644.

DOI

[6]
Boschma R, 2005. Proximity and innovation: A critical assessment. Regional Studies, 39(1): 61-74.

DOI

[7]
Bozeman B, 2000. Technology transfer and public policy: A review of research and theory. Research Policy, 29(4/5): 627-655.

DOI

[8]
Broekel T, 2015. Do cooperative research and development (R&D) subsidies stimulate regional innovation efficiency? Evidence from Germany. Regional Studies, 49(7): 1087-1110.

DOI

[9]
Buckley P J, Sutherland D, Voss H et al., 2015. The economic geography of offshore incorporation in tax havens and offshore financial centres: The case of Chinese MNEs. Journal of Economic Geography, 15(1): 103-128.

DOI

[10]
Chaminade C, Plechero M, 2015. Do regions make a difference? Regional innovation systems & global innovation networks in the ICT industry. European Planning Studies, 23(2): 215-237.

DOI

[11]
Cheng K, Wang Y, 2013. Mechanism and evidence of the promotion of city network on technological innovation. Studies in Science of Science, 31(9): 1399-1411, 1440. (in Chinese)

[12]
Coenen L, Benneworth P, Truffer B, 2012. Toward a spatial perspective on sustainability transitions. Research Policy, 41(6): 968-979.

DOI

[13]
Cooke P, 2006. Global bioregional networks: A new economic geography of bioscientific knowledge. European Planning Studies, 14(9): 1265-1285.

DOI

[14]
Csomos G, Toth G, 2016. Exploring the position of cities in global corporate research and development: A bibliometric analysis by two different geographical approaches. Journal of Informetrics, 10(2): 516-532.

DOI

[15]
Dicken P, 1994. The Roepke lecture in economic geography global-local tensions: Firms and states in the global space-economy. Economic Geography, 70(2): 101-128.

DOI

[16]
Donges A, Selgert F, 2019. Technology transfer via foreign patents in Germany, 1843-1877. The Economic History Review, 72(1): 182-208.

DOI

[17]
Du D, Liu C, Duan D et al., 2019. China-U.S. Science and Technology Competitiveness Assessment Report 2019. Shanghai: East China Normal University Press. (in Chinese)

[18]
Duan D, Du D, Chen Y et al., 2018. Spatial-temporal complexity and growth mechanism spatial-temporal complexity and growth mechanism of city innovation network in China. Scientia Geographica Sinica, 38(11): 1759-1768. (in Chinese)

DOI

[19]
Ernst D, 2009. A new geography of knowledge in the electronics industry? Asia’s role in global innovation networks. Policy Studies, 54: 1-51.

[20]
Fang W, Zheng L, Wang L, 2019. Forty years since the reform and opening: China’s road of technology transfer system construction. Forum on Science and Technology in China, (4): 17-27. (in Chinese)

[21]
Feng Z, Ding M, 2018. An empirical analysis of the impact of local technology transfer on the innovation efficiency of inter-provincial high-tech industries. Statistics & Decision, 34(22): 108-111. (in Chinese)

[22]
Giudici P, Agstner P, 2019. Startups and company law: The competitive pressure of Delaware on Italy (and Europe)? European Business Organization Law Review, 20(4): 597-632.

DOI

[23]
Guan M, Wu S, Liu C, 2022. Comparing China’s urban aviation and innovation networks. Growth and Change, 53(1): 470-486.

DOI

[24]
Gui Q, Liu C, Du D, 2018a. Does network position foster knowledge production? Evidence from international scientific collaboration network. Growth and Change, 49(4): 594-611.

DOI

[25]
Gui Q, Liu C, Du D, 2018b. International knowledge flows and the role of proximity. Growth and Change, 49(3): 532-547.

DOI

[26]
Gui Q, Liu C, Du D, 2019. Globalization of science and international scientific collaboration: A network perspective. Geoforum, 105: 1-12.

DOI

[27]
He C, Mao X, 2015. Economic globalization research based on scale-construction in western human geography. Progress in Geography, 34(9): 1073-1083. (in Chinese)

DOI

[28]
He C, Yan Y, Rigby D, 2018. Regional industrial evolution in China. Papers in Regional Science, 97(2): 173-198.

DOI

[29]
Ivarsson I, Alvstam C G, 2005. Technology transfer from TNCs to local suppliers in developing countries: A study of AB Volvo’s truck and bus plants in Brazil, China, India, and Mexico. World Development, 33(8): 1325-1344.

DOI

[30]
Karreman B, Burger M J, Van Oort F et al., 2017. Location choices of Chinese multinationals in Europe: The role of overseas communities. Economic Geography, 93(2): 131-161.

DOI

[31]
Květoň V, Horak P, 2018. The effect of public R&D subsidies on firms’ competitiveness: Regional and sectoral specifics in emerging innovation systems. Applied Geography, 94: 119-129.

DOI

[32]
Lee S, Kim B S, Kim Y et al., 2018. The framework for factors affecting technology transfer for suppliers and buyers of technology in Korea. Technology Analysis & Strategic Management, 30(2): 172-185.

[33]
Lee Y S, 1996. ‘Technology transfer’ and the research university: A search for the boundaries of university-industry collaboration. Research Policy, 25(6): 843-863.

DOI

[34]
Li B, Yue Y, Chen T, 2016. Export and innovation: Empirical evidence from patent data at firm level. The Journal of World Economy, 39(12): 72-94. (in Chinese)

[35]
Link A N, Morris C A, van Hasselt M, 2019. The impact of public R&D investments on patenting activity: Technology transfer at the US Environmental Protection Agency. Economics of Innovation and New Technology, 28(5): 536-546.

[36]
Liu C, Guan M, 2019. Spatio-temporal evolution of interurban technological flow network in the Yangtze River Delta urban agglomeration: From the perspective of patent transaction network. Geographical Research, 37(5): 981-994. (in Chinese)

[37]
Liu C, Guan M, Duan D, 2018. Spatial pattern and influential mechanism of interurban technology transfer network in China. Acta Geographica Sinica, 73(8): 1462-1477. (in Chinese)

DOI

[38]
Liu C, Gui Q, Duan D et al., 2017, Structural heterogeneity and proximity mechanism of global scientific collaboration network based on co-authored papers. Acta Geographica Sinica, 72(4): 734-752. (in Chinese)

[39]
Liu C, Niu C, 2019. Spatial evolution and factors of interurban technology transfer network in Northeast China from national to local perspectives. Acta Geographica Sinica, 74(10): 2131-2146. (in Chinese)

[40]
Liu C, Niu C, Han J, 2019. Spatial dynamics of intercity technology transfer networks in China’s three urban agglomerations: A patent transaction perspective. Sustainability, 11(6): 1647.

DOI

[41]
Liu C, Xu J, Zhang H, 2020. Competitiveness or complementarity? A dynamic network analysis of international agri-trade along the Belt and Road. Applied Spatial Analysis and Policy, 13(2): 349-374.

DOI

[42]
Mackinnon D, Dawley S, Pike A et al., 2019. Rethinking path creation: A geographical political economy approach. Economic Geography, 95(2): 113-135.

DOI

[43]
Mao X, He C, 2016. Progress of environmental effects of international trade: A global-local perspective. Progress in Geography, 35(8): 10271038. (in Chinese)

[44]
Mao X, He C, 2019. A review of global-local interactions for regional development. Progress in Geography, 38(10): 1449-1461. (in Chinese)

DOI

[45]
Mathews J A, 2006. Dragon multinationals: New players in 21st century globalization. Asia Pacific Journal of Management, 23(1): 5-27.

DOI

[46]
Matthiessen C W, Schwarz A W, 2010. World cities of scientific knowledge: Systems, networks and potential dynamics. An Analysis based on bibliometric indicators. Urban Studies, 47(9): 1879-1897.

DOI

[47]
Peng F, Li Y, 2013. Study of the relationship between technology transfer, indigenous R&D and technical efficiency in high-tech industry. Science of Science and Management of S.&T., 34(5): 46-54. (in Chinese)

[48]
Perkins R, Neumayer E, 2005. The international diffusion of new technologies: A multitechnology analysis of latecomer advantage and global economic integration. Annals of The Association of American Geographers, 95(4): 789-808.

DOI

[49]
Qian C, Du D, Hu X et al., 2019. Does genetic difference influence inter-region technology transfer? Evidence from China’s provincial-level patent transfer data of 2001-2005. Progress in Geography, 38(5): 745-755. (in Chinese)

[50]
Rahm D, 1994. Academic perceptions of university-firm technology transfer. Policy Studies Journal, 22(2): 267-278.

DOI

[51]
Rao K, Meng X, Chen Q et al., 2011. Comparative research on university patent technology transfer between China and Europe. Soft Science, 25(10): 22-26. (in Chinese)

[52]
Romer P, 1986. Increasing returns and long-run growth. Journal of Political Economy, 94(5): 1002-1037.

DOI

[53]
Shi S, Wall R, Pain K, 2019. Exploring the significance of domestic investment for foreign direct investment in China: A city-network approach. Urban Studies, 56(12): 2447-2464.

DOI

[54]
Si Y, Wang D, Wang F, 2019. Geographical patterns and determinants of transnational technology transfer to China. Scientia Geographica Sinica, 39(2): 259-266. (in Chinese)

DOI

[55]
Si Y, Zeng G, Cao X et al., 2016. Research progress of glocal innovation networks. Progress in Geography, 35(5): 600-609. (in Chinese)

DOI

[56]
Sun P, Cheng D, 2019. Research on the innovation effect of Xi’an software industry cluster from global-local perspective. Human Geography, 34(5): 101-108. (in Chinese)

[57]
Sun Y, Liu X, 2017. The impact of university-industry R&D collaboration on technology transfer: The moderator effect of technology transfer center. Science of Science and Management of S.&T., 38(9): 15-24. (in Chinese)

[58]
Swyngedouw E, 2004. Globalisation or ‘glocalisation’? Networks, territories and rescaling. Cambridge Review of International Affairs, 17(1): 25-48.

DOI

[59]
Tödtling F, 1992. Technological change at the regional level: The role of location, firm structure, and strategy. Environment and Planning A, 24(11): 1565-1584.

DOI

[60]
Trippl M, Tödtling F, Lengauer L, 2009. Knowledge sourcing beyond buzz and pipelines: Evidence from the Vienna software sector. Economic geography, 85(4): 443-462.

DOI

[61]
Wang H, Lai M, Qi J, 2010. Research on international technology transfer, heterogeneity and technology innovation of Chinese enterprises. Management World, (12): 131-142. (in Chinese)

[62]
Wang Y, Ning L, Li J et al., 2016. Foreign direct investment spillovers and the geography of innovation in Chinese regions: The role of regional industrial specialization and diversity. Regional Studies, 50(5): 805-822.

DOI

[63]
Wen F, 2014. Research on the time and space distribution law of patent technology transfer in China: Based on the quantitative analysis of SIPO patent license information. Information Studies: Theory & Application, 37(4): 32-36. (in Chinese)

[64]
Xia L, Wang R, Liang X et al., 2019. Evolution of R&D behavior and influential factors of indigenous enterprises of host countries under the global-local background: A case study of manufacturing enterprises in Guangzhou from the perspective of technology spillover. Scientia Geographica Sinica, 39(2): 277-284. (in Chinese)

[65]
Xiao S, Liu J, 2018. The coordinated development analysis about the science-technology innovation ability of regional higher education. Economic Geography, 38(8): 124-131. (in Chinese)

[66]
Xu C, 2013. Universities’ patents, technology transfer and firms’ innovation in China: Based on the accumulation innovation. Science of Science and Management of S.&T., 34(12): 78-86. (in Chinese)

[67]
Yang L, Liu X, 2014. Is there “Matthew Effect” in regional technology transfer? The driving orientation of inter-regional technology transfer. Studies in Science of Science, 32(12): 1820-1827, 1858. (in Chinese)

[68]
Yin D, Wu H, Jin Z, 2019. Innovation network, knowledge spillover and high quality integrated development: An empirical study based on the urban agglomeration of the Yangtze River Delta. Shanghai Journal of Economics, (11): 30-45. (in Chinese)

[69]
Zeng M, Li L, 2019. Research on the dislocation of technology transfer: Analysis based on the bilateral perspective of technology transferors and receivers. Management Review, 31(11): 108-114. (in Chinese)

[70]
Zeng Q, Wang G, 2014. An empirical study on the relations between network capability of industrial network and innovation performance. Economic Geography, 34(10): 111-118. (in Chinese)

[71]
Zhang G, Duan H, Zhou J, 2016. Investigating determinants of inter-regional technology transfer in China: A network analysis with provincial patent data. Review of Managerial Science, 10(2): 345-364.

DOI

[72]
Zhang J, Sun Y, 2011. A comparative study on technology spillovers from FDI and import. World Economy Study, (12): 51-58, 85-86. (in Chinese)

[73]
Zhang Y, Gu R, 2018. The geography of knowledge complexity and its influence in Chinese cities. Acta Geographica Sinica, 73(8): 1421-1432. (in Chinese)

DOI

[74]
Zhang Y, Liang Q, Fan P, 2016. A Meta analysis of the relationship between network embeddedness and innovation performance. Science Research Management, 37(11): 80-88. (in Chinese)

[75]
Zhang Y, Zeng G, Cheng J, 2013. Evolution of the city region concept and progress in study on its mechanism of formation. Areal Research and Development, 32(3): 38-43. (in Chinese)

[76]
Zhou C, Cao X, Zeng G, 2019. Cluster networks and evolution path of China’s electronic information industry innovation. Geographical Research, 38(9): 2212-2225. (in Chinese)

DOI

[77]
Zhou R, 2019. The impact of intellectual property protection and technology spillover of import trade on innovation. Statistics & Decision, 35(14): 90-94. (in Chinese)

Outlines

/