
Journal of Geographical Sciences >
Morphological differentiation characteristics and classification criteria of lunar surface relief amplitude
|
Deng Jiayin, PhD Candidate, specialized in digital geomorphologic analysis. E-mail: dengjy.20b@igsnrr.ac.cn |
Received date: 2022-07-10
Accepted date: 2022-08-22
Online published: 2022-11-25
Supported by
Strategic Priority Research Program of the Chinese Academy of Sciences(XDB41000000)
National Natural Science Foundation of China(42130110)
National Natural Science Foundation of China(41571388)
Key Project of National Basic Work of Science and Technology(2015FY210500)
Lunar landforms are the results of geological and geomorphic processes on the lunar surface. It is very important to identify the types of lunar landforms. Geomorphology is the scientific study of the origin and evolution of morphological landforms on planetary surfaces. Elevation and relief amplitude are the most commonly used geomorphic indices in geomorphological classification studies. Previous studies have determined the elevation classification criteria of the lunar surface. In this paper, we focus on the classification criteria of the topographic relief amplitude of the lunar surface. To estimate the optimal window for calculating the relief amplitude of the lunar surface, we use the mean change-point method based on LOLA (Lunar Orbiter Laser Altimeter) Digital Elevation Model (DEM) data and SLDEM2015 DEM data combining observations from LOLA and SELenological and Engineering Explorer Terrain Camera (SELENE TC). The classification criterion of the lunar surface relief amplitude is then determined according to the statistical analysis of basic lunar landforms. Taking the topographic relief amplitudes of 100 m, 200 m, 300 m, 700 m, 1500 m and 2500 m as thresholds, the lunar surface is divided into seven geomorphic types, including minor microrelief plains (< 100 m), minor microrelief platforms [100 m, 200 m), microrelief landforms [200 m, 300 m), small relief landforms [300 m, 700 m), medium relief landforms [700 m, 1500 m), large relief landforms [1500 m, 2500 m) and extremely large relief landforms (≥ 2500 m). The minor microrelief plains are mainly distributed in the maria and the basalt filled floors of craters and basins, while the minor microrelief platforms are mainly in the transition regions between the maria and highlands. The microrelief landforms are mainly located in regions with relatively high topography, such as wrinkle ridges and sinuous rilles in the mare. The small relief landforms are mainly scattered in the central peak and floor fractures of craters. The medium relief landforms are mainly distributed in the transition regions between crater floors and crater walls, between crater walls and crater rims, between basin floors and basin walls, and between basin walls and basin rims. Large and extremely large relief landforms are mainly found along crater walls and basin walls. The classification criteria determination for assessing lunar surface relief amplitude described in this paper can provide important references for the construction of digital lunar surface geomorphology classification schemes.
DENG Jiayin , CHENG Weiming , LIU Qiangyi , JIAO Yimeng , LIU Jianzhong . Morphological differentiation characteristics and classification criteria of lunar surface relief amplitude[J]. Journal of Geographical Sciences, 2022 , 32(11) : 2365 -2378 . DOI: 10.1007/s11442-022-2052-z
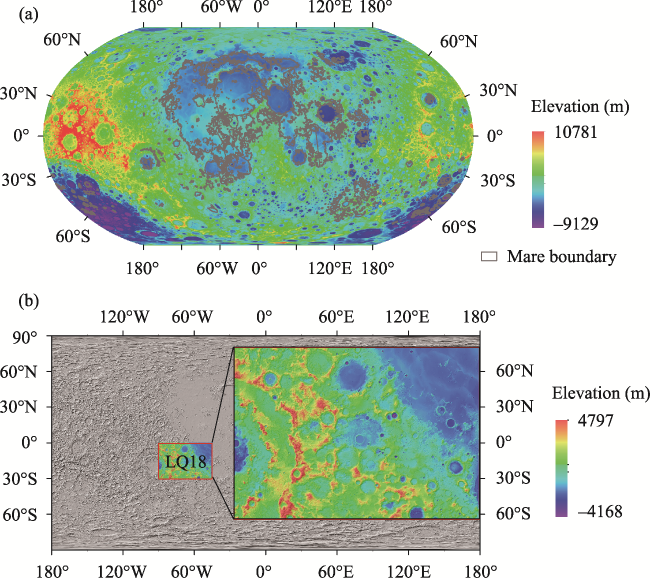
Figure 1 Topography map of the lunar surface LOLA DEM data and SLDEM data |
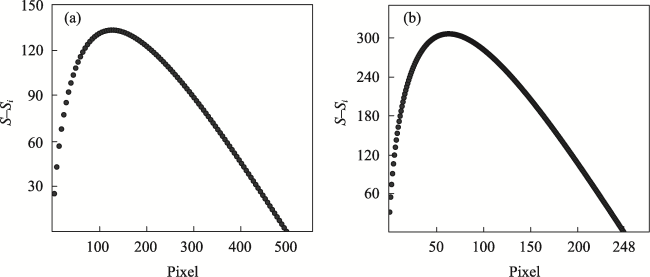
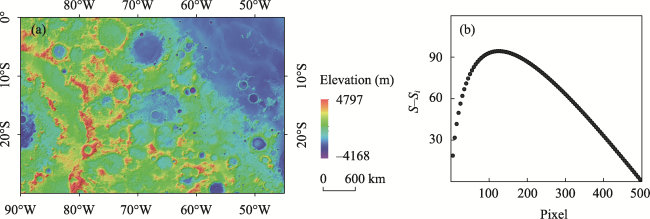
Figure 2 The preanalysis results (a) and accurate analysis results (b) of the best window for calculating the relief amplitude of the lunar surface by the mean change-point method based on LOLA data |
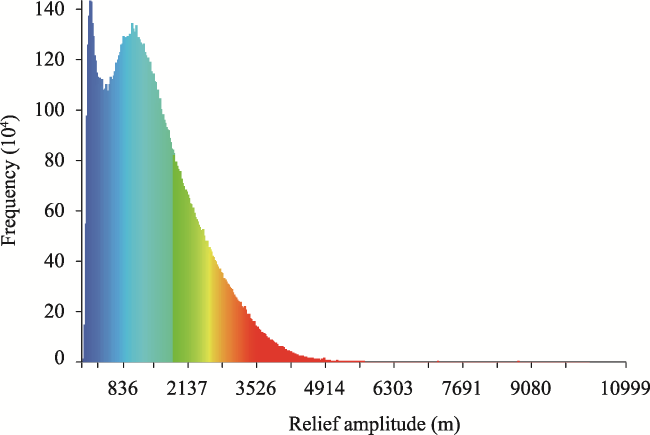
Figure 3 Frequency distribution histogram of the lunar surface relief amplitude |
Table 1 Quantile statistics of lunar surface relief amplitude |
| Statistic | Minimum | Lower quartile | Median | Upper quartile | Inner boundary | Outer boundary | Mean |
|---|---|---|---|---|---|---|---|
| Relief amplitude | 1 | 687 | 1240 | 1939 | 3817 | 5695 | 1393.6 |
Table 2 Percentile of cumulative frequency of lunar surface relief amplitude |
| Cumulative frequency (%) | 10 | 20 | 30 | 40 | 50 | 60 | 70 | 80 | 90 |
|---|---|---|---|---|---|---|---|---|---|
| Relief amplitude (m) | 299 | 562 | 803 | 1022 | 1240 | 1481 | 1767 | 2140 | 2688 |
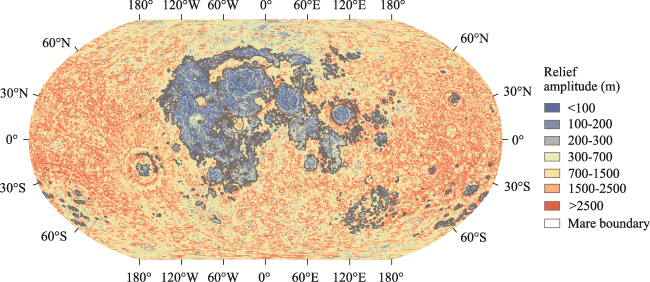
Figure 4 Distribution characteristics of lunar surface relief amplitude, with mare labelled by grey lines |
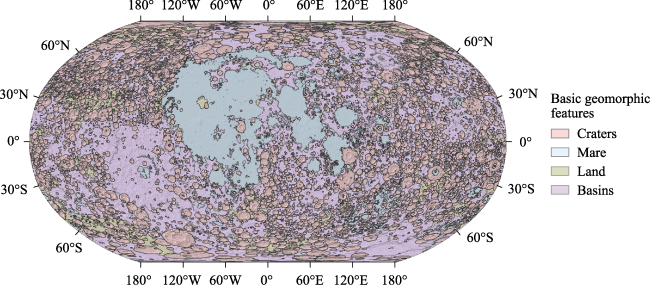
Figure 5 The basic geomorphic landforms of the lunar surface |
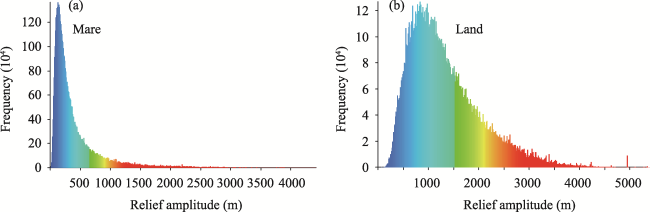
Figure 6 Frequency distribution histogram of lunar mare and highland |
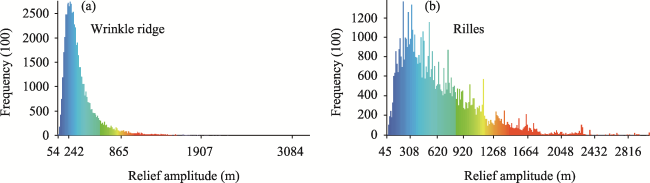
Figure 7 Frequency distribution histogram of lunar wrinkle ridges and lunar sinuous rilles |
Table 3 Quantile statistics of lunar surface relief amplitude in basic lunar geomorphic landforms |
| Basic lunar geomorphic feature | Relief amplitude (m) | |||||
|---|---|---|---|---|---|---|
| Minimum | Lower quartile | Median | Upper quartile | Maximum | Mean | |
| Mare | 23 | 159 | 253 | 445 | 4772 | 380.27 |
| Land | 1 | 735 | 1082 | 1583 | 5396 | 1231.69 |
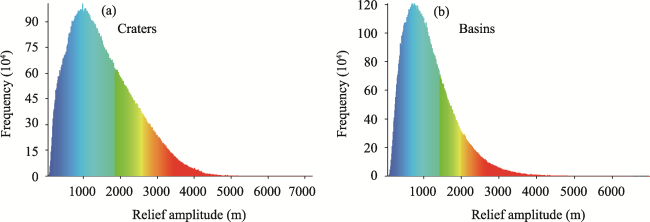
| Craters | 71 | 1132 | 1721 | 2455 | 7200 | 1842.39 |
| Basins | 1 | 794 | 1197 | 1716 | 7200 | 1330.97 |
Table 4 Cumulative frequency of lunar surface relief amplitude in basic geomorphic landforms and the relief amplitude corresponding to cumulative frequency |
| Basic lunar geomorphic feature | Relief amplitude (m) | ||||||||
|---|---|---|---|---|---|---|---|---|---|
| 10% | 20% | 30% | 40% | 50% | 60% | 70% | 80% | 90% | |
| Mare | 111 | 143 | 173 | 210 | 253 | 308 | 388 | 521 | 795 |
| Land | 507 | 665 | 802 | 937 | 1082 | 1250 | 1457 | 1734 | 2177 |
| Craters | 730 | 1013 | 1247 | 1478 | 1721 | 1987 | 2287 | 2642 | 3125 |
| Basins | 520 | 709 | 975 | 1034 | 1197 | 1378 | 1589 | 1866 | 2307 |
Figure 8 Frequency distribution histogram of impact craters and basin |
Table 5 Statistics of the classification criterion of lunar surface relief amplitude |
| Lunar relief amplitude classification scheme (m) | |||||||
|---|---|---|---|---|---|---|---|
| <100 | [100, 200) | [200, 300) | [300, 700) | [700, 1500) | [1500, 2500) | ≥2500 | |
| Geomorphic type | Minor microrelief plains | Minor microrelief platforms | Microrelief landforms | Small relief landforms | Medium relief landforms | Large relief landforms | Extremely large relief landforms |
| Proportion (%) | 1.06 | 4.3 | 4.71 | 15.48 | 35.18 | 27.38 | 12.89 |
Figure 9 The classification results of the lunar surface relief amplitude |
Figure 10 SLDEM data (a) and the analysis results of the mean change-point method based on SLDEM data (b) |
| [1] |
|
| [2] |
|
| [3] |
|
| [4] |
|
| [5] |
|
| [6] |
|
| [7] |
|
| [8] |
|
| [9] |
Institute of Geographic Sciences and Natural Resources Research, Chinese Academy of Sciences, 1987. 1: 1000000 Geomorphological Mapping Specification (trail). Beijing: Science Press. (in Chinese)
|
| [10] |
|
| [11] |
|
| [12] |
|
| [13] |
|
| [14] |
|
| [15] |
|
| [16] |
|
| [17] |
|
| [18] |
|
| [19] |
|
| [20] |
|
| [21] |
|
| [22] |
|
| [23] |
|
| [24] |
|
| [25] |
|
| [26] |
|
| [27] |
|
| [28] |
|
/
| 〈 |
|
〉 |
