Research Articles

Impacts of seismic activity and climatic change on Chinese history in the recent millennium

  • FAN Jiawei , 1, 2, 3 ,
  • JIANG Hanchao 1 ,
  • XU Hongyan 1 ,
  • ZHANG Wei 4
Expand
  • 1. State Key Laboratory of Earthquake Dynamics, Institute of Geology, China Earthquake Administration, Beijing 100029, China
  • 2. Xinjiang Pamir Intracontinental Subduction National Observation and Research Station, Beijing 100029, China
  • 3. Urumqi Institute of Central Asia Earthquake, China Earthquake Administration, Urumqi 830011, China
  • 4. State Key Laboratory of Atmospheric Boundary Layer Physics and Atmospheric Chemistry, Institute of Atmospheric Physics, CAS, Beijing 100029, China

Fan Jiawei (1987-), Associate Professor, specialized in paleolimnology, paleoclimatology, and paleoseismology. E-mail:

Received date: 2022-03-10

  Accepted date: 2022-08-08

  Online published: 2022-11-25

Supported by

National Nonprofit Fundamental Research Grant of China, Institute of Geology, China Earthquake Administration(IGCEA2009)

Abstract

General history of disasters in China suggests that China has frequently experienced two major natural disasters in its long history, one is from catastrophic earthquake events, and the other is from extreme climatic events, due to its unique active tectonic environment and climatic complexity. Although these two major natural disasters have caused great damage to human society, it remains unclear whether and how they affect Chinese dynasty alternation on decadal (emperor) timescales. Based on detailed comparisons between abrupt climatic changes, catastrophic seismic activities, and the history of Chinese dynasty alternation from 1000-2000 AD, we conclude that on decadal timescales, extreme drought (and/or flood) events could indeed significantly reduce agricultural production, cause severe food shortages and famine, and result in increases in population exile, rising food prices and inflation, and insufficient supplies for military defense, which could exceed social resilience and eventually lead to financial risks and social upheavals of the dynasties. In addition, catastrophic seismic events in the densely populated, agricultural areas of China, including the 1303 surface wave magnitude (Ms) 8.0 Hongtong earthquake, the 1556 Ms 8.25 Huaxian earthquake and the 1920 Ms 8.5 Haiyuan earthquake, caused more than 200,000 casualties and millions of victims to live in exile which was almost equivalent to the order of magnitude of those extreme climatic events-induced refugees. The secondary geological hazards related to the earthquakes (e.g., extensive landslides and soil erosion), which could last for decades, caused more casualties and reduced food production. Furthermore, great plague spread caused by the casualties could significantly increase psychological panic among the survivors, resulting in social instability. Therefore, catastrophic seismic events could also accelerate the collapse of the dynasties (e.g., the Ming dynasty) without immediate mitigation measures. This study indicates that catastrophic seismic activities, as well as extreme climatic events, could have great effects on the social structures and thus on the Chinese dynasty alternation on decadal timescales, which highlights the far-reaching implications of geological hazard research.

Cite this article

FAN Jiawei , JIANG Hanchao , XU Hongyan , ZHANG Wei . Impacts of seismic activity and climatic change on Chinese history in the recent millennium[J]. Journal of Geographical Sciences, 2022 , 32(11) : 2328 -2348 . DOI: 10.1007/s11442-022-2050-1

1 Introduction

China is generally characterized by cool and dry climate in the north and warm and humid climate in the south (not including the Qinghai-Tibet Plateau) (Zheng et al., 2018). In the historical period, China experienced severe drought and calamitous flooding events, as well as extreme cold events that seriously threatened the people’s lives and food security (e.g., Chen et al., 2000; Jiang, 2014; Fang et al., 2017; Tao et al., 2022; Zeng et al., 2022). In addition, China is located in one of the most active seismic regions of the world (Molnar and Tapponnier, 1975; Zhang et al., 2004; Wang and Shen, 2020). Frequent earthquake disasters caused great losses of people’s lives and property (Ren et al., 2018; Fan et al., 2022), and irreversible damage to the surface morphology and ecosystem (Fan et al., 2020a, 2020b; Jin et al., 2021; Wei et al., 2021). Although both extreme climatic events and catastrophic earthquake events have caused great damage to social communities and economic development (e.g., Jongman et al., 2014; Winsemius et al., 2016; Chen et al., 2022; León et al., 2022; Salazar et al., 2022), it is still strongly debated whether and how they have impacts on Chinese dynasty alternation. Understanding the response of Chinese dynasty alternation to these natural disasters, and/or the relationship between Chinese dynasty alternation and devastating natural disasters is of great importance for the policy formulation of disaster prevention, relief and mitigation, and for the maintenance of social stability.
It has long been recognized that climatic changes could have played an important role in the evolution of regional civilization (deMenocal, 2001; Pei and Zhang, 2014; Dong et al., 2017; Xiao et al., 2019; Zhang et al., 2021a), population migration and wars (including peasant uprising) (Ye et al., 2004; Chen, 2015; Lee et al., 2017; Chen et al., 2019a; Mao et al., 2021; Yang et al., 2021; Zhang et al., 2021b) and dynasty alteration (Yancheva et al., 2007; Büntgen et al., 2016; Liu et al., 2018). Several studies suggested that a centennial-scale cooling climate could impede agricultural production, and then cause price inflation, famine and wars, leading to the reorganization of society in recent human history (e.g., Zhang et al., 2007). Several other studies suggested that large-scale flooding and inundation in central eastern China would force major relocations of human settlements away from floodplain areas, resulting in the collapse of prehistoric cultures (e.g., Xie et al., 2013). In addition, other studies argued that extreme drought events were the main cause for the decline of late Neolithic civilization in North China (e.g., Guo et al., 2018). These studies established large-scale (Zhang et al., 2007) or long-term (Xie et al., 2013; Guo et al., 2018) relationships between climatic changes and human society in China. However, in terms of Chinese dynastic duration, the Northern Song (960-1127 AD) and Southern Song (1127-1276 AD) dynasties lasted 167 and 152 years, respectively, much shorter than the Ming (1368-1644 AD) and Qing (1644-1911 AD) dynasties (http://www.gov.cn/, last access: 2022/03/01), but the temperature and humidity conditions for agricultural production in the Northern Song and Southern Song dynasties (within the Medieval Warm Period (MWP)) were generally better than those in the Ming and Qing dynasties (covering the Little Ice Age (LIA)) (Chen et al., 2015). These data imply that short-term extreme climatic events should have played an important role in the Chinese dynasty alternation. Recent studies indicated that annual to daily climatic events, such as severe storms, cyclones and tornadoes could have significant impacts on human beings, but such events could usually be absorbed by the social resilience system before they redefined the social structures (e.g., Degroot et al., 2021; Ulus and Ellenblum, 2021). Therefore, decadal-scale impacts of regional climatic changes on Chinese dynasty alternation are still worthy of further studies (Ye et al., 2004; Liu et al., 2018).
In addition to extreme climatic changes, China has suffered from numerous destructive earthquakes in its long history (e.g., Su et al., 2003; Yuan and Feng, 2010; Deng, 2011). Great earthquake events could cause massive casualties and ecological destruction (Wei et al., 2021; Fan et al., 2022), and induce secondary geological hazards including debris flows (Cui et al., 2012), landslides (Xu et al., 2018; Zhang et al., 2021c) and outburst floods (Wu et al., 2016) which could last for decades. Earthquake-induced tremendous casualties could cause a wide spread of plague, give rise to psychological panic among the survivors, and weaken the social stability (Sullivan and Hossain, 2010). Nevertheless, whether and how earthquake disasters affect Chinese dynasty alternation are still little known.
In this study, we present results of the time series of historical seismic records and paleoclimatic records in different regions of China from 1000-2000 AD, and make detailed comparisons between abrupt climatic changes, catastrophic seismic activities, and the history of Chinese dynasty alternation, in order to determine the decadal-scale impacts of climatic changes as well as seismic activities on Chinese history in the recent millennium.

2 Data and research methods

In this study, we divide China into seven climatic zones (including the northwestern China, northeastern China, North China, central eastern China, southwestern China, South China and southeastern China). According to the provincial-level administrative divisions of the People’s Republic of China (PRC) (source data are from https://gmt-china.org/data/, last access: 2022/03/01), the northwestern China generally includes Xinjiang, Qinghai, Gansu, Ningxia, northern Shaanxi and western Inner Mongolia. The northeastern China generally includes eastern Inner Mongolia, Heilongjiang, Jilin and Liaoning. The North China generally includes Beijing, Hebei, Tianjin, Shanxi, southern Shaanxi, Henan and Shandong. The central eastern China generally includes Hubei, Hunan, Anhui, Jiangxi, Jiangsu, Shanghai and Zhejiang. The southwestern China generally includes Xizang, Sichuan, Yunnan, Guizhou and Chongqing. The South China generally includes Guangxi, Guangdong and Hainan. The southeastern China generally includes Fujian and Taiwan (Figure S1 in the Supplementary Material). The division of these climatic zones is generally consistent with the current classification of geographical climatic zones (Zhang, 1982; Ge et al., 2010). Temperature anomaly data (relative to the reference climatology from 1851-1950 AD) in China from 1000-2000 AD are based on a composite series of temperature variations reconstructed from peats, lakes, stalagmites, tree rings, ice cores and historical records (Ge et al., 2013 and references therein). Wet/dry climatic data in seven climatic zones of China are based on historical records with an average resolution of ~10 yr (Chu et al., 2009 and references therein; Man, 2009), and reconstructed paleoclimatic records with explicit moisture or precipitation implications of proxy indicators, well-supported chronology and an average resolution of generally better than 30 yr (Chu et al., 2002; Chen et al., 2010; Selvaraj et al., 2012; Tan et al., 2018). For northeastern China, North China and central eastern China which are the most important grain production bases (Cheng and Zhang, 2005; Wei et al., 2014), the paleoclimatic and historical records have a resolution of better than 10 yr (Chu et al., 2009 and references therein; Man, 2009; Zhao et al., 2021). The climatic data in this study are generally consistent with those reviewed by Chen et al. (2015).
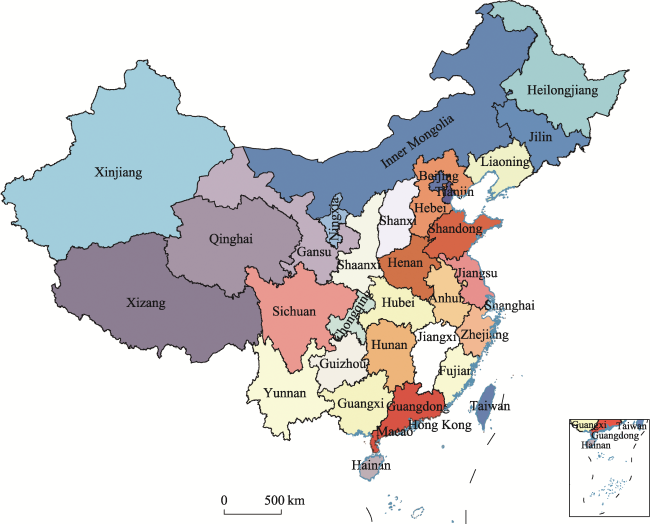
Figure S1 Provincial-level administrative divisions of the People’s Republic of China (PRC).
China can be generally divided into five active-tectonic provinces, including the Qinghai-Tibetan tectonic province (QTTP), the Xinjiang tectonic province (XTP), the Northeast China tectonic province (NECTP), the North China tectonic province (NCTP), and the Southeast China tectonic province (SECTP) (Xu and Deng, 1996). Data of Holocene active faults in China are from Xu et al. (2016). Data of historical earthquakes (including the date, magnitude, epicenter, maximum intensity and death toll) in China from 1000-2000 AD are mainly based on the catalogues from China Earthquake Administration (CEA, 1999a, 1999b), local chronicles (e.g., HCLCCC, 1992), general history of disasters in China (e.g., He, 2008), macroseismic survey (e.g., Han and Yang, 2021) and monograph on major earthquake disasters (e.g., Lou, 1996).
Historically, China is a non-digital management country and lack of unified and standardized social and economic statistics (Fang et al., 2017). There are only discontinuous data of population, cultivated land area and prices in the recent millennium, except for the Qing dynasty which has relatively continuous grain harvest data (Fang et al., 2017). Previous studies used semantic differential method to quantitatively reconstruct famine (e.g., frequency of cannibalism), migration (e.g., interregional migration), fiscal balance (e.g., fiscal difficulty/insufficient) and social vicissitudes (e.g., peasant uprisings) (Wei et al., 2014; Xiao et al., 2015; Yin et al., 2016). In this study, we primarily collect currently available historical data of grain harvest, grain price, fiscal expenditure and population exile from historical archives, chronicles and recently published papers (e.g., HCLCCC, 1992; Cao, 1997; CEA, 1999a, 1999b; Zeng, 2016; Han and Yang, 2021), and consult a series of descriptive documents on the social-economic and demographic response to climatic changes (e.g., He, 2008; Qiu, 2008; Su, 2009). Based on comparisons between climatic changes and social response within different Chinese dynasties from 1000-2000 AD, we conclude the decadal-scale impacts of extreme climatic events on social instability, and quantitatively demonstrate the climatic impacts on the destruction of social structure (including financial crisis, population exile and decreased military relief) and the resultant acceleration of the Ming dynasty collapse, under the theoretical framework of food security issues which are usually the starting points triggering social instability (e.g., Fang et al., 2014; Degroot et al., 2021; Ulus and Ellenblum, 2021). More importantly, we compare the social impacts of catastrophic seismic activities and extreme climatic events within different Chinese dynasties, and quantitatively demonstrate the uniqueness of catastrophic seismic activities in the acceleration of the Ming dynasty collapse. Finally, we put forward a theoretical model to illustrate the processes and mechanisms of social impacts from extreme climatic events and catastrophic seismic activities.

3 Characteristics of climate and seismic activity in China in the last millennium

3.1 Climatic characteristics in the recent millennium of China

Paleoclimatologists have made great efforts to synthesize the patterns of climatic changes of China in the recent millennium (e.g., Zhou et al., 2011; Chen et al., 2015; Lan et al., 2020; Xiao et al., 2021). The last millennium was characterized by two key periods: the MWP (~1000-1300 AD) and the LIA (~1400-1900 AD) (Figure 1a) (e.g., Ge et al., 2013). The average temperature in the LIA was ~0.5℃ lower than that in the MWP (Figure 1a) (Ge et al., 2013). In the recent century, the temperature increased to the level of the MWP (Figure 1a) (Ge et al., 2013).
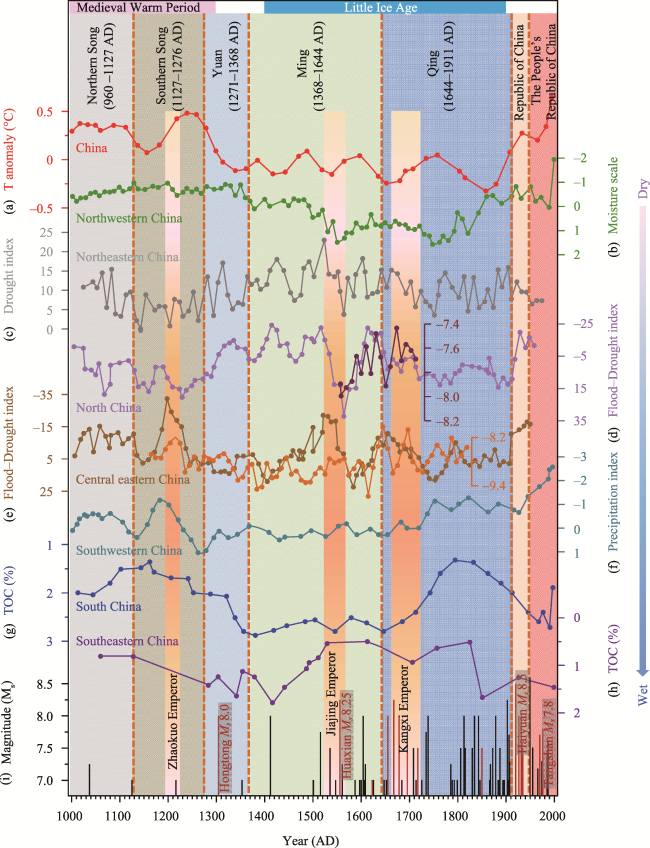
Figure 1 The climatic and seismic history in China from 1000-2000 AD. Chinese dynasty alternation is plotted against the (a) temperature anomaly based on a composite series of temperature variations (Ge et al., 2013), (b-h) wet/dry climatic conditions inferred from proxy indices (b: Chen et al., 2010; f: Tan et al., 2018; g: Chu et al., 2002; h: Selvaraj et al., 2012) and historical records (c: Chu et al., 2009 and references therein; d and e: Man, 2009), and (i) historical Ms ≥ 7.0 earthquakes in China from 1000-2000 AD (CEA, 1999a, 1999b). Purple data points in (d) and orange data points in (e) are the ~10-yr average δ18O values (‰, VPDB) of stalagmites from Qujia Cave in North China and Xiniu Cave in central China, respectively (Zhao et al., 2021). Red lines in (i) indicate earthquake casualties ≥ 10,000.
The variations in the dry-wet conditions were much more complex than the temperature. In Westerlies-dominated northwestern China, the climate was dry during the MWP and wet during the LIA (Figures 1b, 2a and 2b) (Chen et al., 2010, 2015). In the East Asian summer monsoon (EASM) region of northeastern China and North China, the climate was generally wet during the MWP and dry during the LIA (Figures 1c, 1d, 2a and 2b) (Chu et al., 2009; Man, 2009; Chen et al., 2015; Fan et al., 2016). The climatic changes in central eastern China generally exhibited similar patterns to those in Westerlies-dominated northwestern China (Figures 1e, 2a and 2b) (Man, 2009; Chen et al., 2015). In southwestern China and South China, the climatic patterns were much more complex due to the influences of multiple climatic systems (Chen et al., 2015; Xiao et al., 2021). Recent studies suggested that the southwestern China was influenced by the Westerlies and Indian summer monsoon (ISM), and generally exhibited a moderately dry climate during the MWP and a moderately wet climate during the LIA (Figures 1f, 2a and 2b) (Zhang et al., 2017; Tan et al., 2018). The South China was influenced by the ISM and EASM, and was generally dry during the MWP and wet during the LIA (Figures 1g, 2a and 2b) (Chu et al., 2002). The southeastern China was prone to be affected by typhoons (Chen et al., 2018), and exhibited a (moderately) wet climate during the MWP and a (moderately) dry climate during the LIA (Figures 1h, 2a and 2b) (Selvaraj et al., 2012; Lei et al., 2014). In general, the dry-wet conditions within the LIA in northern and central eastern China were much more unstable than those within the MWP (Figures 1b-1e), which was supported by additional evidence in recent studies (Cui et al., 2018; Chen et al., 2019b; Zhao et al., 2021; Feng et al., 2022). During the transition from the MWP to the LIA, the regions of North China experienced a rapid drying climate while South China experienced a rapid wetting climate (Figures 1d and 1g) (Chu et al., 2002; Man, 2009).
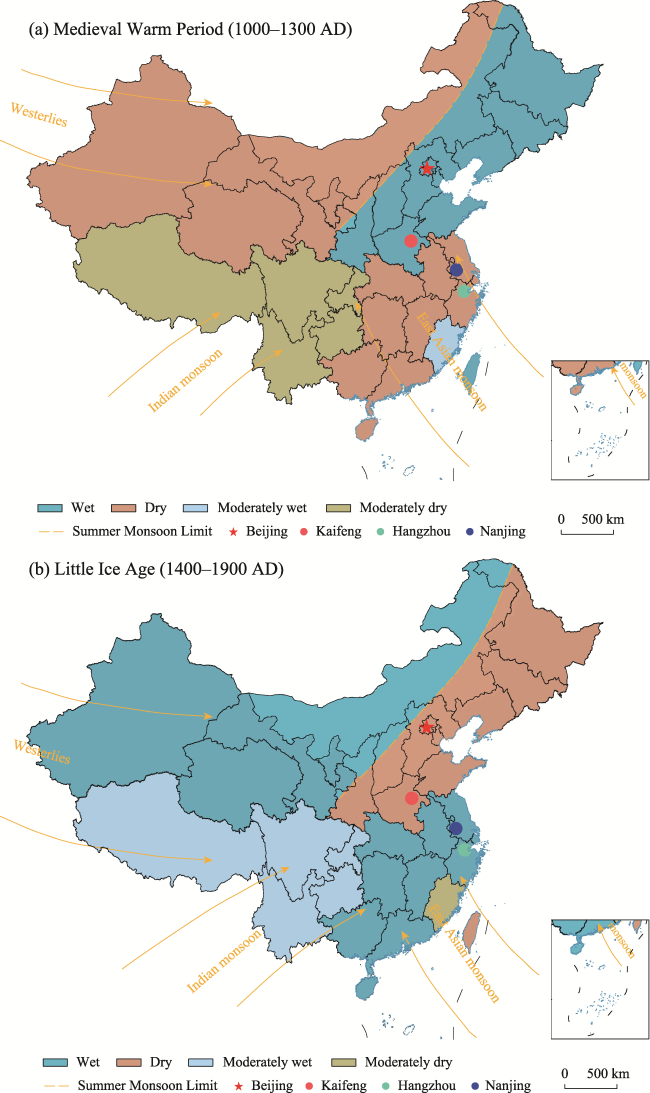
Figure 2 Sketch maps of climatic characteristics in China during the two typical periods. (a) Medieval Warm Period (MWP), and (b) Little Ice Age (LIA). Climatic characteristics are compiled with a sketch map of the provincial-level administrative divisions of China (source data are from https://gmt-china.org/data/, last access: 2022/03/01). Beijing was the capital of the Yuan, Ming and Qing dynasties, and Kaifeng, Nanjing and Hangzhou were the capitals of the Northern Song, Republic of China (RC) and Southern Song dynasties, respectively.
On decadal timescales, historical records indicate the occurrence of significant drought events at 1400-1420, 1480-1520 and 1610-1640 AD, and extreme flood events around 1560s and 1570s AD in North China (Figure 1d) (Man, 2009; Zhao et al., 2021). In addition, there were extreme drought events in central eastern China around 1200s AD and ~1480-1550 AD (Figure 1e) (Man, 2009; Zhao et al., 2021). During the period of 1912-1949 AD, the regions of North China and central eastern China generally experienced extreme drought events (Figures 1d and 1e) (Man, 2009).

3.2 Seismic activities in the recent millennium of China

China has become one of the most tectonically active regions in the world, in response to the ongoing India-Asia collision, the southeastward movement of the Mongolia and Siberia blocks, and the subduction processes of the Pamir orogen and the Pacific western margin (Molnar and Tapponnier, 1975; Schellart et al., 2019; Fan et al., 2020b, 2022; Wang and Shen, 2020). Among the five active-tectonic provinces in China, the QTTP, XTP and NCTP have dominated the Holocene active faults (Figure 3) (Xu et al., 2016). The historical seismic records are relatively complete from 1000-2000 AD (CEA, 1999a, 1999b), and the earthquake disaster records are very rich since 1950 AD (Lou, 1996). This study focuses on large (surface wave magnitude (Ms) ≥ 7.0) to great (Ms ≥ 8.0) earthquakes, because the casualties caused by relatively small (e.g., Ms ˂ 7.0) earthquakes were relatively low (Lou, 1996; CEA, 1999a, 1999b). These small earthquakes should have little effect on the Chinese dynasty alternation.
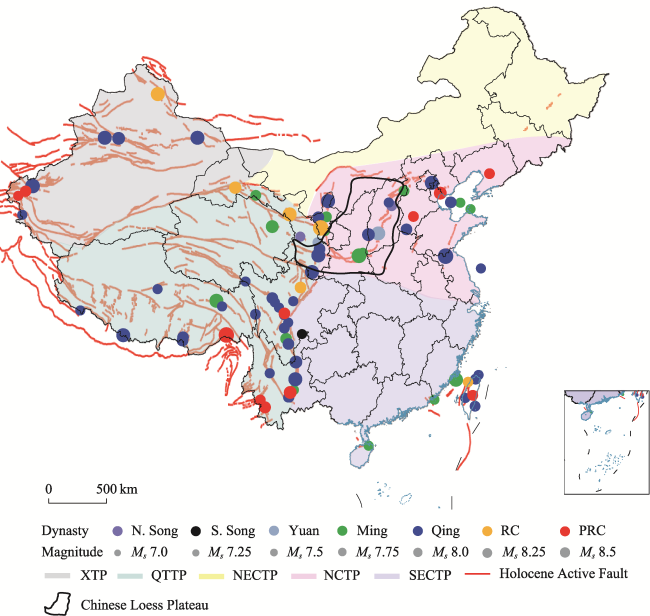
Figure 3 Tectonic background and major earthquake events in China from 1000-2000 AD. Holocene active faults in China and its adjacent area, and distribution of historical Ms ≥ 7.0 earthquakes are compiled with a sketch map of the five active-tectonic provinces of China (Xu and Deng, 1996). N. Song, Northern Song; S. Song, Southern Song; XTP, Xinjiang tectonic province; QTTP, Qinghai-Tibetan tectonic province; NECTP, Northeast China tectonic province; NCTP, North China tectonic province; SECTP, Southeast China tectonic province. Fault data were provided by the Active Fault Survey Data Centre at the Institute of Geology, China Earthquake Administration (Xu et al., 2016). Earthquake data are from China Earthquake Administration (1999a, 1999b).
There are a total of 81 Ms ≥ 7.0 earthquakes in China from 1000-2000 AD, and most of them occurred during the LIA (Figures 1i and 3; Table S1 in the Supplementary Material). Among them, 16 earthquakes caused more than 10,000 casualties (Figure 1i; Table 1). The 1303 Ms 8.0 Hongtong earthquake in the Yuan dynasty (1271-1368 AD), the 1556 Ms 8.25 Huaxian earthquake in the Ming dynasty (1368-1644 AD), and the 1920 Ms 8.5 Haiyuan earthquake in the Republic of China (RC) (1912-1949 AD) are the most destructive earthquakes that occurred in the densely populated, agricultural areas of China where are the junction of the QTTP and NCTP (Figures 3, 4a and 4b), and caused more than 200,000 casualties (Table 1). These devastating earthquakes had a maximum intensity exceeding XI (Figures 3, 4a and 4b; Table 1) (Lou, 1996). Seismic intensity map of the 1303 Ms 8.0 Hongtong earthquake shows that seismic intensity area of VII covered more than half of Shanxi Province, and parts of Shaanxi, Hebei and Henan Provinces (Figures S1 and 4b) (United Group, 2003). Seismic intensity V area of the 1556 Ms 8.25 Huaxian earthquake covered most areas of Shaanxi, Ningxia, Shanxi, Henan, Hubei and Anhui Provinces, and parts of Gansu, Inner Mongolia, Hebei, Shandong, Jiangsu, Hunan and Jiangxi Provinces (Figures S1 and 4b) (Yuan and Feng, 2010). Seismic intensity VI area of the 1920 Ms 8.5 Haiyuan earthquake covered most areas of Ningxia Province, and part areas of Gansu, Qinghai, Inner Mongolia and Shaanxi Provinces (Figures S1 and 4b) (LIS et al., 1980).
Table S1 Historical Ms ≥ 7.0 earthquakes in China from 1000-2000 AD
No. Dynasty
(Capital)
(Duration)
Datea
(AD)
Magnitude
(Ms)
Epicenter (Location) Maximum
intensity
(MMI)
Death toll
1 Northern Song (Kaifeng)
(960-1127)
1038/01/15 7.25 38.4°N, 112.9°E (Dingxiang, Shanxi) X NA
2 1125/09/06 7.0 36.1°N, 103.7°E (Lanzhou, Gansu) IX NA
3 Southern Song (Hangzhou) (1127-1276) 1216/03/24 7.0 28.4°N, 103.8°E (Leibo, Sichuan) IX NA
4 Yuan (Beijing)
(1271-1368)
1303/09/25 8.0 36.3°N, 111.7°E (Hongtong, Shanxi) XI 270,000 +
5 1352/04/26 7.0 35.6°N, 105.3°E (Huining, Gansu) NA NA
6 Ming (Beijing)
(1368-1644)
1411/10/08 8.0 30.1°N, 90.5°E (Dangxiong, Xizang) X-XI NA
7 1500/01/13 7.0 24.9°N, 103.1°E (Yiliang, Yunnan) IX NA
8 1501/01/29 7.0 34.8°N, 110.1°E (Chaoyi, Shaanxi) IX 170 +
9 1515/06/27 7.75 36.7°N, 100.7°E (Yongsheng, Yunnan) X Thousands
10 1536/03/29 7.5 28.1°N, 102.2°E (Xichang, Sichuan) X NA
11 1548/09/22 7.0 38.0°N, 121.0°E (Bohai Sea) NA NA
12 1556/02/02 8.25 34.5°N, 109.7°E (Huaxian, Shaanxi) XI ~830,000
13 1561/08/04 7.25 37.5°N, 106.2°E (Zhongwei, Ningxia) IX-X NA
14 1588/08/09 7.0 24.0°N, 102.8°E (Jianshui, Yunnan) IX NA
15 1597/10/06 7.0 38.5°N, 120.0°E (Bohai Sea) NA NA
16 1600/09/29 7.0 23.5°N, 117.2°E (Nan’ao, Guangdong) IX 6
17 1604/12/29 8.0 25.0°N, 119.5°E (Quanzhou offshore) NA NA
18 1605/07/13 7.0 19.9°N, 110.5°E (Qiongshan, Hainan) X 1200 +
19 1609/07/12 7.25 39.2°N, 99.0°E (Jiuquan, Gansu) X 840 +
20 1622/10/25 7.0 36.5°N, 106.3°E (Guyuan, Ningxia) IX-X 12,000 +
21 1626/06/28 7.0 39.4°N, 114.2°E (Lingqiu, Shanxi) IX NA
22 Qing (Beijing)
(1644-1911)
1652/07/13 7.0 25.5°N, 100.6°E (Midu, Yunnan) IX + 3000 +
23 1654/07/21 8.0 34.3°N, 105.5°E (Tianshui, Gansu) XI 31,000 +
24 1642-1654 7.0 30.8°N, 95.6°E (Luolong, Xizang) IX NA
25 1668/07/25 8.5 34.8°N, 118.5°E (Tancheng, Shandong) XI 10,200 +
26 1679/09/02 8.0 40.0°N, 117.0°E (Sanhe, Hebei) XI 12,677 +
27 1683/11/22 7.0 38.7°N, 112.7°E (Yuanping, Shanxi) IX NA
28 1695/05/18 7.75 36.0°N, 110.5°E (Linfen, Shanxi) X 52,600 +
29 1709/10/14 7.5 37.4°N, 105.3°E (Zhongwei, Ningxia) IX-X 2000 +
30 1713/09/04 7.0 32.0°N, 103.7°E (Maoxian, Sichuan) IX-X NA
31 1718/06/19 7.5 35.0°N, 105.3°E (Tongwei, Gansu) X 40,000 +
32 1725/08/01 7.0 30.0°N, 101.9°E (Kangding, Sichuan) IX NA
33 1733/08/02 7.75 26.3°N, 103.1°E (Dongchuan, Yunnan) X NA
34 1739/01/03 8.0 38.8°N, 106.5°E (Pingluo, Ningxia) X + 1000 +
35 1786/06/01 7.25 29.9°N, 102.0°E (Kangding, Sichuan) X NA
36 Qing (Beijing)
(1644-1911)
1786/06/10 7.0 29.4°N, 102.2°E (Luding, Sichuan) NA NA
37 1789/06/07 7.0 31.0°N, 102.9°E (Huaning, Yunnan) IX + NA
38 1792/08/02 7.0 23.6°N, 120.6°E (Jiayi, Taiwan) IX 100 +
39 1799/08/27 7.0 23.8°N, 102.4°E (Shiping, Yunnan) IX NA
40 1806/06/11 7.5 28.2°N, 91.8°E (Cuona, Xizang) X NA
41 1812/03/08 8.0 43.7°N, 83.5°E (Nilek, Xinjiang) XI 58
42 1816/12/08 7.5 31.4°N, 100.7°E (Luhuo, Sichuan) X 2854
43 1830/06/12 7.5 36.4°N, 114.3°E (Cixian, Hebei) X NA
44 1833/08/26 8.0 28.3°N, 85.5°E (Nielamu, Xizang) X NA
45 1833/09/06 8.0 25.0°N, 103.0°E (Songming, Yunnan) X 6700 +
46 1842/06/11 8.0 43.5°N, 93.1°E (Balikun, Xinjiang) X NA
47 1846/08/04 7.0 33.5°N, 122.0°E (Yellow Sea) NA NA
48 1850/09/12 7.5 27.7°N, 102.4°E (Xichang, Sichuan) X 20,652 +
49 1867/12/18 7.0 25.3°N, 121.8°E (Jilong, Taiwan) NA NA
50 1868/01/04 7.25 30.0°N, 99.1°E (Batang, Sichuan) X 1000 +
51 1871/06/NA 7.5 28.0°N, 91.5°E (Cuona, Xizang) X NA
52 1879/07/01 8.0 33.2°N, 104.7°E (Wudu, Gansu) XI 9881
53 1883/10/NA 7.0 30.2°N, 81.2°E (Pulan, Xizang) IX NA
54 1887/12/16 7.0 23.7°N, 102.5°E (Shiping, Yunnan) IX 2000 +
55 1888/06/13 7.5 38.5°N, 119.0°E (Bohai Sea) NA NA
56 1893/08/29 7.0 30.6°N, 101.5°E (Daofu, Sichuan) IX 326
57 1895/07/05 7.0 37.7°N, 75.1°E (Tashkurgan, Xinjiang) IX NA
58 1896/03/NA 7.0 32.5°N, 98.0°E (Shiqu, Sichuan) IX NA
59 1902/08/22 8.25 39.9°N, 76.2°E (Atushi, Xinjiang) X ~ 1420
60 1902/11/21 7.25 23.0°N, 121.5°E (Taidong, Taiwan) NA NA
61 1904/08/30 7.0 31.0°N, 101.1°E (Daofu, Sichuan) IX 400 +
62 1906/12/23 7.75 43.5°N, 85.0°E (Shawan, Xinjiang) X 285
63 1908/08/20 7.0 32.0°N, 89.0°E (Qilin Lake, Xizang) NA NA
64 1909/04/15 7.25 25.0°N, 121.5°E (Taibei, Taiwan) NA 9
65 Republic of China (Nanjing) (1912-1949) 1920/12/16 8.5 36.5°N, 105.7°E (Haiyuan, Ningxia) XII ~ 240,000
66 1927/05/23 8.0 37.6°N, 102.6°E (Gulang, Gansu) XI 40,000 +
67 1931/08/11 8.0 46.7°N, 89.9°E (Fuyun, Xinjiang) X 10,000 +
68 1932/12/25 7.6 39.7°N, 97.0°E (Changmapu, Gansu) X ~ 70,000
69 1933/08/25 7.5 32.0°N, 103.7°E (Maoxian, Sichuan) X 20,000 +
70 1935/04/20 7.1 24.2°N, 120.8°E (Miaoli, Taiwan) NA 3276
71 The People’s Republic of China (Beijing)
(1949-)
1950/08/15 8.5 28.5°N, 96.0°E (Chayu, Xizang) XII ~ 4000
72 1951/10/22 7.3 + 7.1 23.7°N, 121.2°E (Hualian, Taiwan) NA 113
73 The People’s
Republic of
China (Beijing)
(1949-)
1955/04/14 7.5 30.0°N, 101.9°E (Kangding, Sichuan) NA ~ 100
74 1955/04/15 7.0 39.9°N, 74.7°E (Wuqia, Xinjiang) NA 18
75 1966/03/22 7.2 37.5°N, 115.1°E (Xintai, Hebei) X 8064 -
76 1970/01/05 7.7 24.0°N, 102.7°E (Tonghai, Yunnan) X 15,621
77 1975/02/04 7.3 40.7°N, 122.8°E (Haicheng, Liaoning) IX 1328
78 1976/07/28 7.8 39.4°N, 118.0°E (Tangshan, Hebei) XI ~ 242,000
79 1985/08/23 7.4 39.4°N, 75.4°E (Wuqia, Xinjiang) NA 67
80 1988/11/06 7.6 +
7.2
22.9°N, 100.1°E (Lancang, Yunnan) +
23.4°N, 99.6°E (Gengma, Yunnan)
IX-X 743
81

NA: No data.

a: Earthquake data are from historical catalogues (CEA, 1999a, 1999b).

Table 1 Historical Ms ≥ 7.0 earthquakes with death toll ≥ 10,000 in China from 1000-2000 AD
No. Datea (AD) Dynasty
(Duration)
Magnitude
(Ms)
Epicenter Maximum
intensity
Death tollb
1 1303/09/25 Yuan (1271-1368) 8.0 36.3°N, 111.7°E (Hongtong, Shanxi) XI 270,000 +
2 1556/02/02 Ming (1368-1644) 8.25 34.5°N, 109.7°E (Huaxian, Shaanxi) XI ~830,000
3 1622/10/25 7.0 36.5°N, 106.3°E (Guyuan, Ningxia) IX-X 12,000 +
4 1654/07/21 Qing (1644-1911) 8.0 34.3°N, 105.5°E (Tianshui, Gansu) XI 31,000 +
5 1668/07/25 8.5 34.8°N, 118.5°E (Tancheng, Shandong) XI 10,200 +
6 1679/09/02 8.0 40.0°N, 117.0°E (Sanhe, Hebei) XI 12,677 +
7 1695/05/18 7.75 36.0°N, 110.5°E (Linfen, Shanxi) X 52,600 +
8 1718/06/19 7.5 35.0°N, 105.3°E (Tongwei, Gansu) X 40,000 +
9 1850/09/12 7.5 27.7°N, 102.4°E (Xichang, Sichuan) X 20,652 +
10 1920/12/16 Republic of China
(RC 1912-1949)
8.5 36.5°N, 105.7°E (Haiyuan, Ningxia) XII ~240,000
11 1927/05/23 8.0 37.6°N, 102.6°E (Gulang, Gansu) XI 40,000 +
12 1931/08/11 8.0 46.7°N, 89.9°E (Fuyun, Xinjiang) X 10,000 +
13 1932/12/25 7.6 39.7°N, 97.0°E (Changmapu, Gansu) X ~70,000
14 1933/08/25 7.5 32.0°N, 103.7°E (Maoxian, Sichuan) X 20,000 +
15 1970/01/05 The People’s Republic of China (PRC 1949-) 7.7 24.0°N, 102.7°E (Tonghai, Yunnan) X 15,621
16 1976/07/28 7.8 39.4°N, 118.0°E (Tangshan, Hebei) XI ~242,000

a: Earthquake data are from historical catalogues (CEA, 1999a, 1999b).

b: “+” means “more than”.

In addition, there are four Ms ≥ 7.0 earthquakes with more than 10,000 casualties clustered in the period of Kangxi emperor (1661-1722 AD) in the Qing dynasty (1644-1911 AD) (Figures 1i and 4a; Table 1), and additional four clustered in the period of RC (Table 1). It is noted that the 1976 Ms 7.8 Tangshan earthquake occurred in the urban area of Tangshan, and caused ~242,000 people to death (Figure 1i; Table 1).
Some historical post-earthquake remains are well preserved. For example, the Anyi Pagoda in Shanxi Province was split from the top to the seventh floor, and the 61 stone statues of vassals were seriously damaged in the 1556 Ms 8.25 Huaxian earthquake (Figures S2a and S2b) (Yuan and Feng, 2010). The post-earthquake scenes of Haiyuan County (upper picture in Figure S2c) were clearly recorded (EANHAR et al., 2010), and the living willow damaged by the 1920 Ms 8.5 Haiyuan earthquake (lower picture in Figure S2c) reminds us of the severity of the earthquake disasters.
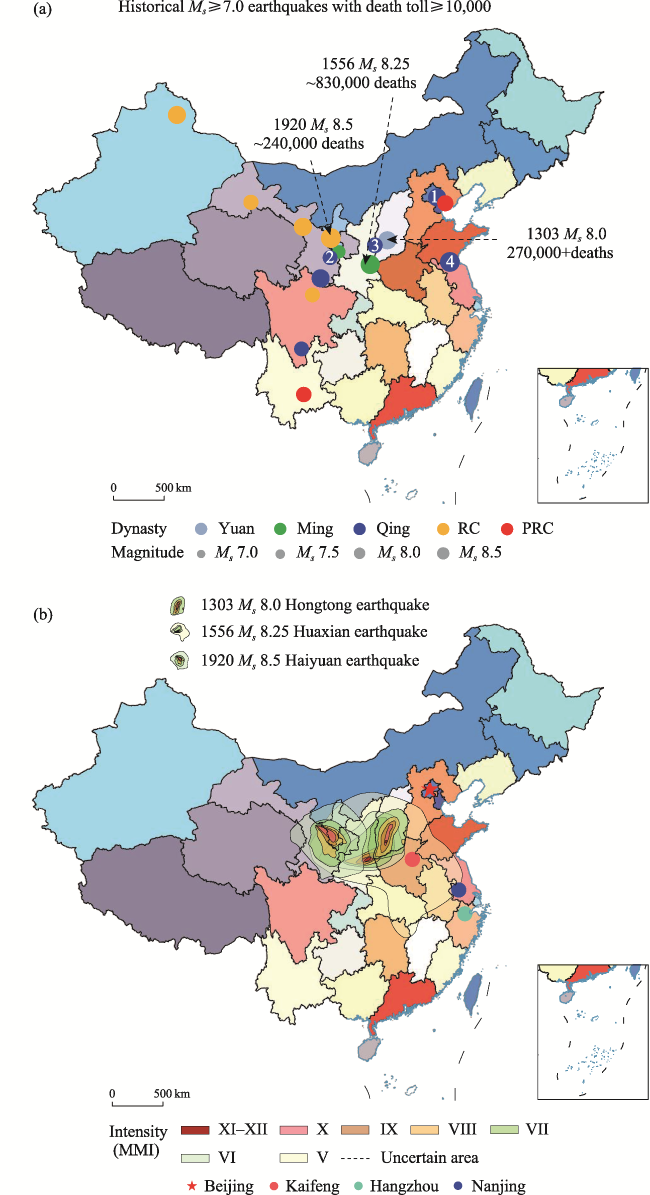
Figure 4 Distributions of major earthquake disasters in China from 1000-2000 AD. (a) Distribution of historical Ms ≥ 7.0 earthquakes with death toll ≥ 10,000 in different dynasties of China from 1000-2000 AD. Numbers 1-4 in blue circles represent the four earthquake disasters that occurred in the period of Kangxi emperor. (b) Seismic intensity maps of the 1303 Ms 8.0 Hongtong earthquake (United Group, 2003), the 1556 Ms 8.25 Huaxian earthquake (Yuan and Feng, 2010) and the 1920 Ms 8.5 Haiyuan earthquake (LIS et al., 1980).
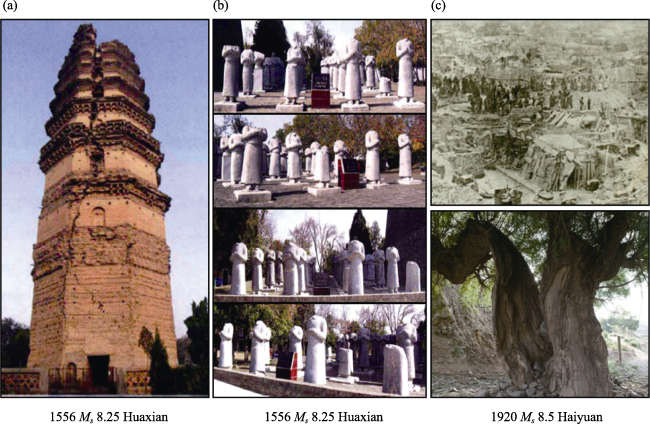
Figure S2 (a) The Anyi Pagoda in Shanxi Province was split from the top to the seventh floor in the 1556 Huaxian earthquake (Yuan and Feng, 2010). (b) The 61 stone statues of vassals were damaged by the 1556 Huaxian earthquake (Yuan and Feng, 2010). (c) The post-earthquake scenes of Haiyuan County (upper: EANHAR et al., 2010) and the living willow damaged by the 1920 Haiyuan earthquake (lower: Taken in September, 2021).

4 Impacts of climatic change and seismic activity on Chinese history

Simultaneous occurrence of extreme climatic events and failures of cultures and dynasties was considered as the evidence for possible impacts of centennial-scale climatic changes on social development (e.g., Hodell et al., 2001; Li et al., 2021). However, it seems to be simplistic to ascribe the complex twists and turns of Chinese dynastic history only to those long-term climatic changes (e.g., Zhang et al., 2010; Degroot et al., 2021), as mentioned in the “1. Introduction” part. This study focuses mainly on the decadal-scale (emperor-scale) impacts of climatic changes and seismic activities on Chinese dynasty alternation in the recent millennium. The following discussions are based on case studies of climatic anomalies and seismic events within the Chinese dynasties from Southern Song to the RC, especially within the Ming dynasty.

4.1 The Southern Song dynasty

After the demise of the Northern Song dynasty (960-1127 AD), the Southern Song dynasty (1127-1276 AD) moved the capital to today’s Hangzhou (Zhejiang Province) (Figures 2a, 2b and 4b). The territory generally included today’s central eastern China, South China and southeastern China (Figure S1). In the period of Kuo Zhao emperor (1194-1224 AD), Tuozhou Han general launched the Kaixi Northern Expedition in 1206-1207 AD, in order to restore the lost northern China and rejuvenate the previous Song dynasty (Li, 2000). Improper tactics was suggested as an important factor leading to the failure of this war (Li, 2000). Intriguingly, a significant drought event occurred around 1200s AD in central eastern China including the capital region of Southern Song, which was in sharp contrast to the wet climate in semi-arid areas of northern China (Figures 1d, 1e, 2a and S1) (Man, 2009). Historical documents show that this drought event (in the capital region) lasted from 1193-1221 AD, and significantly decreased the food production of Southern Song before, during, and after the war (Qiu, 2008). At that time, the decree of reclaiming the lake and returning farmland to the lake was abolished by the Kaixi government, in order to increase the food production and supplies (Qiu, 2008 and references therein). The insufficient food supplies for the military defense contributed to the failure of the war (Li, 2000; Yu, 2010), and the perennial food shortages had increased the famine, frequent fiscal crisis and social contradictions which pushed the society beyond its resilience threshold (e.g., Wei et al., 2014), and therefore contributed to the acceleration of the demise of the Southern Song dynasty.

4.2 The Yuan dynasty

The Yuan dynasty (1271-1368 AD) established its capital in today’s Beijing. Its territory extended from the Sea of Japan and the East China Sea in the east to the Black Sea and the Mediterranean in the west, and from Siberia in the north to the Persian Gulf in the south (Wang, 2011 and references therein). It had a population of ~100 million, which were mainly distributed in the central, eastern and southern China (Li, 2007). The Yuan dynasty experienced a rapid climatic transition from the MWP to the LIA (Figure 1a) (Ge et al., 2013). The average temperature dropped ~0.75℃ during that time (Figure 1a), potentially resulting in reduction of grain production by more than 7.5%, assuming a grain reduction rate of ~10%/℃ under the current farming conditions (Zhang, 1982). The semi-arid areas in northern China (including the capital region) became drier at the end of the Yuan dynasty (Figures 1c and 1d) (Chu et al., 2009; Man, 2009). Results of statistical analyses showed a correlation coefficient of 0.71 between poor harvest and drought index in North China (Xiao and Yan, 2019). The drought events led to a greater decline in food production and to the significant increases in the famine (the occurrence of cannibalism), relief expenditure and population exile (He, 2008; Wei et al., 2014). These factors partly triggered the long-lasting peasant uprisings and separation at the end of the Yuan dynasty from 1354-1368 AD (Yin et al., 2016), which accelerated the dynasty collapse.
In addition, the 1303 Ms 8.0 Hongtong earthquake caused more than 270,000 casualties in North China (Figures 1i, 4a and 4b), and the death toll accounted for ~60% of the total population in the epicentral areas (Su et al., 2003). The epicentral areas were located in the Chinese Loess Plateau (Figures 3 and 4b) (Lou, 1996) which is one of the most important agricultural areas (wheat zone) of China (Zhang, 1982; Pei and Zhang, 2014; Wei et al., 2014) and the most severe erosion regions in the world (Wang et al., 2022). This great earthquake triggered extensive landslides, altered the physical and chemical processes at the surface soils, and damaged the hydrological pathways in the agricultural areas, leading to hundreds of thousands of victims to live in exile and suffer from prolonged hunger and cold (United Group, 2003), and thus be devastating to the stability of society and economy (Zhang et al., 2007; Ulus and Ellenblum, 2021). The catastrophic earthquake disaster superimposed on the rapid drying climate in North China may have amplified the negative effects of natural hazards on the destruction of social structure, and therefore shortened the rule of the Yuan dynasty.

4.3 The Ming dynasty

The Ming dynasty (1368-1644 AD) maintained its capital in today’s Beijing, but its territory underwent great changes especially in today’s northwestern, northeastern and southwestern China. It experienced a cold climate within the LIA (Figure 1a). The cold climate together with the prolonged drought events in North China and northeastern China (Figures 1c and 1d) significantly reduced the food production (Xiao et al., 2015). The collected grain on military farms in the middle and late 15th century was only ~2 million shi per year, less than 10% of that in the early 15th century (Figure 5a) (Han and Yang, 2021). Severe food shortages caused an average of ~450,000 people per decade with a total of ~2500,000 people to live in exile, leading to a population loss of ~11% in northern China during the middle and late 15th century (Cao, 1997). Meanwhile, military supplies for border defense relied more heavily on the taxes collected from farmers due to the decline of military farm (Han and Yang, 2021). During the period of Zhengde emperor (1491-1521 AD), the rice price in border regions increased to more than 0.8 liang/shi in the 1500s AD, which was more than 25 times of that in the late 1450s AD (Figure 5b) (Peng, 1958; Han and Yang, 2021). In contrast, the silver amount supplied to the border regions only increased by less than 4 times over the same period (Figure 5c) (Peng, 1958; Han and Yang, 2021). During the Jiajing emperor (1521-1567 AD), silver taxation was adopted which led to a transition from a planned economy to a commercial market economy (Han and Yang, 2021 and the references therein). Continuously rising food prices and inflation directly threatened the survival of soldiers as well as farmers, leading to the financial crises and the frequent occurrence of cannibalism and peasant uprisings (Xiao et al., 2015; Liu et al., 2018; Han and Yang, 2021).
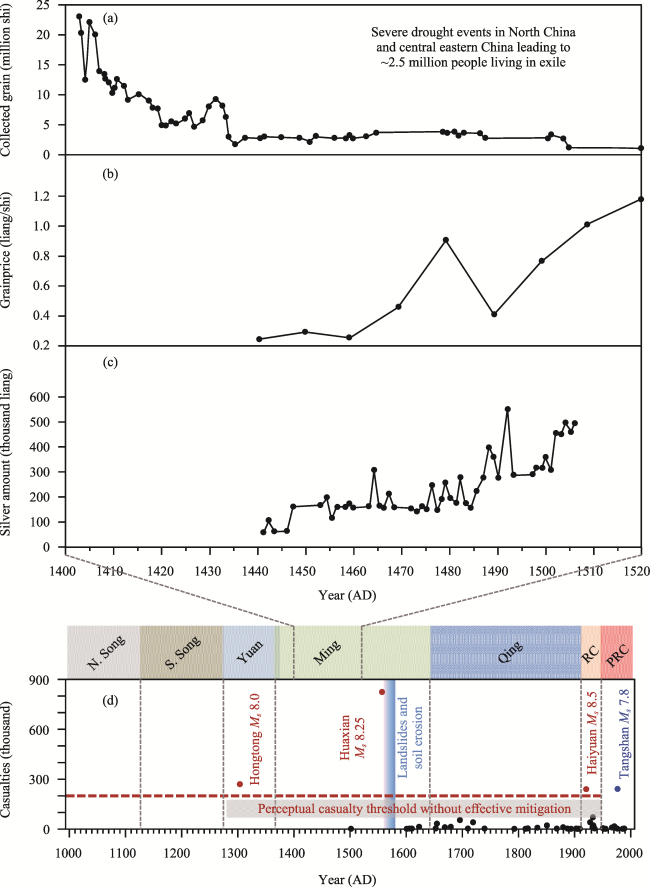
Figure 5 Social response to extreme climatic events and catastrophic earthquakes in China from 1000-2000 AD. (a) Amount of collected grain on military farms, (b) average grain price in border regions, and (c) silver amount supplied to the border regions from 1400-1520 AD. Data in (a), (b) and (c) are from Han and Yang (2021). (d) Casualties caused by historical Ms ≥ 7.0 earthquakes in China from 1000-2000 AD. Available data are from China Earthquake Administration (CEA, 1999a, 1999b). Red dots represent earthquakes occurred in the densely populated, agricultural areas of China without effective mitigation measures. Blue dot represents earthquake occurred in the urban area with immediate mitigation measures.
More seriously, a catastrophic earthquake, the 1556 Ms 8.25 Huaxian earthquake, caused ~830,000 casualties and millions of victims to live in exile (Figures 4a and 5d; Table 1) (Lou, 1996; Yuan and Feng, 2010). Its impacts extended to the most of the agricultural areas in North China (~900,000 km2) which covered almost the entire Chinese Loess Plateau (Figures 3 and 4b), with a severe disaster area of ~280,000 km2 (HCLCCC, 1992). The earthquake-induced casualties reached ~30%, and the resultant people living in exile reached the same order of magnitude of those extreme climatic events-induced refugees, respectively (Cao, 1997; Yuan and Feng, 2010). However, Jiajing emperor did not even know this earthquake disaster until 45 days later (Yuan and Feng, 2010). Then, only a few officials led by Shouyu Zou were assigned to the earthquake area to worship the gods, but Shouyu Zou died of disease during the relief period (Yuan and Feng, 2010). Millions of victims did not receive any assistance at all immediately after the earthquake (Yuan and Feng, 2010). Two and a half months later after the earthquake, the Jiajing government appropriated 105,000 liang silver for the disaster relief; however, it was far from enough for the millions of victims (each victim’s family received only less than half a liter of rice on average) (Yuan and Feng, 2010), which could inevitably lead to victim’s protest against the Jiajing’s government. In addition, the extreme flood events in North China around 1560s and 1570s AD (Figure 1d) (Man, 2009; Zhao et al., 2021) significantly increased secondary geological hazards related to the earthquake (e.g., extensive landslides and soil erosion), which caused more casualties and significantly reduced the agricultural production (Wang, 2006). Furthermore, great plague spread induced by the casualties caused tens of thousands of deaths, and widespread psychological panic among the survivors significantly increased the social instability (e.g., frequent occurrence of murder, robbery and arson) (Yuan and Feng, 2010). Meanwhile, the central eastern China suffered from frequent flood events in the 1560s-1610s AD (Figure 1e) (Man, 2009; Zhao et al., 2021), which swept away fields, crops and shelters, and caused thousands of people to die of drowning and a wide spread of plague (Hu et al., 2021). These factors potentially increased the fiscal and social crises, and accelerated the collapse of the Ming dynasty (Figure 6).
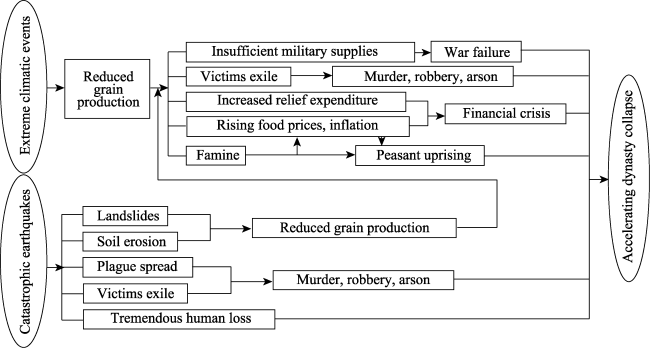
Figure 6 Theoretical model showing extreme climatic events and catastrophic earthquakes without effective mitigation measures led to the acceleration of the demise of Chinese dynasties in the recent millennium.

4.4 The late Qing dynasty and the RC

The late Qing dynasty (1840-1911 AD) and the RC (1912-1949 AD) experienced frequent wars (Ye et al., 2004; Lin and Peng, 2021). Although the 1920 Ms 8.5 Haiyuan earthquake caused ~240,000 casualties (Figures 4a and 5d; Table 1) with a severe disaster area of more than 150,000 km2 (Lou, 1996) and a landslide area of ~218.78 km2 (Xu et al., 2018), the government did not make great efforts to mitigate the disaster but withheld the relief funds to the war expenditure, leading to the helpless of millions of victims who suffered from severe cold, hunger and homeless (Shang and Zhang, 2012). In order to express the dissatisfaction, the victims insisted on publishing articles in People’s Daily to urge the government to provide relief until the third month after the earthquake (Yu et al., 2002). In addition to the earthquake disaster, the frequent drought events in North China and central eastern China in the 1930s and 1940s AD (Figures 1d and 1e) caused more than two millions of people to die of famine (e.g., Dong et al., 2014; Jiang, 2014). The collected grain in Henan Province decreased by ~60% in the early 1940s AD, resulting in ~75% food shortages for the victims (Jiang, 2014 and references therein). The food price soared from 100 yuan for a cow in 1937 AD to 100 yuan for less than a grain of rice in 1949 AD (Zeng, 2016). The severe famine and inflation led to the fiscal crisis and land-right disputes, significantly increasing the social instability (e.g., Su, 2009).

5 Effects of immediate mitigation measures on natural hazards

Nevertheless, catastrophic earthquake disasters alone can hardly determine the Chinese dynasties if effective mitigation measures were immediately put forward. In other words, there were complicated relationships between earthquake disasters and the Chinese dynasty alternation throughout the recent millennium (Figures 1i and 5d). For instance, in the early Qing dynasty, an Ms 8.0 earthquake attacked the Sanhe County near the capital of Beijing in 1679 AD, and caused more than 12,677 casualties and affected more than 200 counties and cities (Figure 1i; Table 1) (Hou and Jiang, 2013). Kangxi emperor made self-criticisms, investigated the disaster and granted financial relief (average 2 liang silver for each adult death) immediately after the earthquake (Hou and Jiang, 2013). Then, he exempted the tax on the victims and helped them rebuild their homes, and the victims also helped each other to mitigate the disaster (Hou and Jiang, 2013). Due to the effective relief efforts, people were more supportive to their government, which in turn helped the nation survive the four earthquake disasters during the reign of Kangxi emperor (Figures 1i and 4a; Table 1) (e.g., Ma and Zhong, 2009). In the period of PRC, the 1976 Ms 7.8 Tangshan earthquake occurred in the urban area of Tangshan, Hebei and caused ~242,000 people to death (Figure 5d; Table 1) (Lou, 1996). The government, army and people from all over China participated in the disaster relief immediately after the earthquake (within 24 hours), provided sufficient water (increasing from 3 kg per victim per day for the first three days after the earthquake to 20 kg per victim per day on the tenth day), food (450 g rations for each earthquake victim), clothing (more than 400,000 clothes) and temporary residence (shelters) for the victims, and prevented the plague spread (more than 100,000 soldiers and ~20,000 emergency medical workers were dispatched to the earthquake zone within 4 days after the earthquake) (Yu et al., 2002). The social impact of this event was effectively controlled within the capacity of resilient energy systems.

6 Possible thresholds of climatic and seismic events for social instability

It is difficult to establish a quantitative threshold of earthquake-induced casualties for social transformations (Figure 5d), because the resilient energy systems, the political and institutional adaptations, the social structures and the science and technology used to mitigate the disasters have been changing throughout the history (Chen, 2015; Degroot et al., 2021). However, within a historical perspective, catastrophic earthquake disasters in the densely populated, agricultural areas of China (with casualties exceeding 200,000 and secondly long-lasting hazards including extensive landslides and soil erosion) were demonstrated to have intensified the societal fragility and instigated the social unrest, amplifying or causing dramatic social changes, without immediate and effective mitigation measures (Figures 5d and 6). On the other hand, decadal-scale (prolonged) extreme climatic events could significantly reduce the food production, increase the food crisis which had the potential to exceed the perceptual resilience thresholds and ultimately result in the social decline of the Chinese dynasties in the recent millennium (Figures 5a-5c and 6) (e.g., Degroot et al., 2021; Ellenblum, 2021; Ulus and Ellenblum, 2021). Hence, policymakers and people need to unite against geological hazards and create a stable and safe society.

7 Conclusions

Based on close examination of the time series of historical seismic records and paleoclimatic records within the history of Chinese dynasty alternation from 1000-2000 AD, we find that extreme climatic events and catastrophic earthquake disasters were external factors leading to the social instability. A significant and prolonged (decadal-scale) cooling and drying climate in semi-arid China, as well as frequent flood events in humid China could cause the reduction of food production, which would result in widespread famine and exile, increases in the food prices, decreases in the military supplies and the collapse of financial system, eventually leading to the social upheavals. In addition, catastrophic seismic events in the densely populated, agricultural areas of China (North China) and the resulting secondary long-lasting geological hazards could cause hundreds of thousands of casualties and millions of victims to live in exile and suffer from cold and hunger, which would directly threaten the social stability without immediate mitigation measures. Therefore, catastrophic seismic activities and extreme climatic events could have great effects on the Chinese dynasty alternation.
Comprehensive studies on the occurrence regularities of extreme climatic events and catastrophic seismic activities and their possible driving forces in the future will provide scientific basis for better prevention and mitigation of natural disasters. Since catastrophic earthquake events in the historical records are relatively few, and recurrence intervals of these destructive earthquakes typically exceed the temporal span of historical records, paleoseismic studies from geological archives (e.g., archaeological sites, lake sediments, tree rings, stalagmites and trenches) are urgently needed to extend the paleoseismic history, and to establish a better relationship between earthquake disasters and social disruption.

We thank Prof. Jule Xiao from the Institute of Geology and Geophysics, Chinese Academy of Sciences (Beijing, China) and Prof. Xingqi Liu from the Capital Normal University (Beijing, China) for improving the English language of this manuscript.

[1]
Büntgen U, Myglan V S, Ljungqvist F C, et al, 2016. Cooling and societal change during the Late Antique Little Ice Age from 536 to around 660 AD. Nature Geoscience, 9: 231-236.

DOI

[2]
Cao S J, 1997. The Chinese Immigration History. Volume V:The Ming Dynasty. Fuzhou: Fujian People’s Publishing House. (in Chinese)

[3]
Chen F H, Chen J H, Holmes J, et al, 2010. Moisture changes over the last millennium in arid Central Asia: A review, synthesis and comparison with monsoon region. Quaternary Science Reviews, 29(7/8): 1055-1068.

DOI

[4]
Chen F H, Li X, Wu S H, et al, 2022. Disciplinary structure of geographic science in China. Journal of Geographical Sciences, 32(9): 1637-1641.

DOI

[5]
Chen F H, Welker F, Shen C C, et al, 2019a. A late Middle Pleistocene Denisovan mandible from the Tibetan Plateau. Nature, 569(7756): 409-412.

DOI

[6]
Chen H F, Liu Y C, Chiang C W, et al, 2018. China’s historical record when searching for tropical cyclones corresponding to Intertropical Convergence Zone (ITCZ) shifts over the past 2 kyr. Climate of the Past, 15(1): 279-289.

DOI

[7]
Chen J H, Chen F H, Feng S, et al, 2015. Hydroclimatic changes in China and surroundings during the Medieval Climate Anomaly and Little Ice Age: Spatial patterns and possible mechanisms. Quaternary Science Reviews, 107: 98-111.

DOI

[8]
Chen J H, Liu J B, Zhang X J, et al, 2019b. Unstable Little Ice Age climate revealed by high-resolution proxy records from northwestern China. Climate Dynamics, 53: 1517-1526.

DOI

[9]
Chen J Y, Xu C H, Liu H B, 2000. A study of the cataclysm flood in Yangtze River in 1998 and its cause. Journal of the CUN (Natural Sciences Edition), 9(2): 134-143. (in Chinese)

[10]
Chen Q, 2015. Climate shocks, state capacity and peasant uprisings in North China during 25-1911 CE. Economica, 82(326): 295-318.

DOI

[11]
Cheng Y Q, Zhang P Y, 2005. Regional patterns changes of Chinese grain production and response of commodity grain base in Northeast China. Scientia Geographica Sinica, 25(5): 513-520. (in Chinese)

DOI

[12]
China Earthquake Administration (CEA), 1999a. Historical Strong Earthquake Catalog of China (2300 BC-1911 AD). Beijing: Earthquake Publishing House. (in Chinese)

[13]
China Earthquake Administration (CEA), 1999b. Recent Earthquake Catalog of China (1912-1990, Ms ≥ 4.7). Beijing: Chinese Sciences and Technology Press. (in Chinese)

[14]
Chu G Q, Liu J Q, Sun Q, et al, 2002. The ‘Mediaeval Warm Period’ drought recorded in Lake Huguangyan, tropical South China. The Holocene, 12(5): 511-516.

DOI

[15]
Chu G Q, Sun Q, Wang X H, et al, 2009. A 1600 year multiproxy record of paleoclimatic change from varved sediments in Lake Xiaolongwan, northeastern China. Journal of Geophysical Research, 114(D22): D22108.

DOI

[16]
Cui A N, Ma C M, Zhao L, et al, 2018. Pollen records of the Little Ice Age humidity flip in the middle Yangtze River catchment. Quaternary Science Reviews, 193: 43-53.

DOI

[17]
Cui P, Lin Y M, Chen C, 2012. Destruction of vegetation due to geo-hazards and its environmental impacts in the Wenchuan earthquake areas. Ecological Engineering, 44: 61-69.

DOI

[18]
Degroot D, Anchukaitis K, Bauch M, et al, 2021. Towards a rigorous understanding of societal responses to climate change. Nature, 591: 539-550.

DOI

[19]
deMenocal P B, 2001. Cultural responses to climate change during the late Holocene. Science, 292(5517): 667-673.

DOI

[20]
Deng Q D, 2011. Learning and progress through scientific practices: Commemorating the 90th anniversary of the tragic Haiyuan Earthquake, striving to advance our abilities of earthquake prediction and seismic hazard reduction. Seismology and Geology, 33(1): 1-14. (in Chinese)

[21]
Dong A X, Li Y H, Zhang Y, 2014. Reasons of serious drought in eight cities or provinces of northern China in 1942. Scientia Geographica Sinica, 34(2): 205-210. (in Chinese)

[22]
Dong G H, Yang Y S, Han J Y, et al, 2017. Exploring the history of cultural exchange in prehistoric Eurasia from the perspectives of crop diffusion and consumption. Science China Earth Science, 60(6): 1110-1123.

DOI

[23]
Earthquake Agency of Ningxia Hui Autonomous Region (EANHAR), Haiyuan County Committee of the Communist Party of China, Haiyuan County People’s Government, 2010. Haiyuan Earthquake·1920. Yinchuan: Sunshine Press of the Yellow River Publishing & Media Group Company Limited. (in Chinese)

[24]
Ellenblum R, 2021. Fragility. New Jersey: Princeton University Press.

[25]
Fan J W, Jiang H C, Shi W, et al, 2020a. A 450-year lacustrine record of recurrent seismic activities around the Fuyun fault, Altay Mountains, Northwest China. Quaternary International, 558: 75-88.

DOI

[26]
Fan J W, Wei X T, Shi W, et al, 2020b. Response of tree rings to earthquakes during the past 350 years at Jiuzhaigou in the eastern Tibet. Science of the Total Environment, 731: 138714.

DOI

[27]
Fan J W, Xiao J L, Wen R L, et al, 2016. Droughts in the East Asian summer monsoon margin during the last 6 kyrs: Link to the North Atlantic cooling events. Quaternary Science Reviews, 151: 88-99.

DOI

[28]
Fan J W, Xu H Y, Shi W, et al, 2022. A -28-kyr continuous lacustrine paleoseismic record of the intraplate, slow-slipping Fuyun Fault in northwest China. Frontiers in Earth Science, 10: 828801.

DOI

[29]
Fang X Q, Xiao L B, Su Y, et al, 2017. Social impacts of climate change on the history of China. Journal of Palaeogeography, 19(4): 729-736. (in Chinese)

[30]
Fang X Q, Zheng J Y, Ge Q S, 2014. Historical climate change impact-response processes under the framework of food security in China. Scientia Geographica Sinica, 34(11): 1291-1298. (in Chinese)

[31]
Feng S N, Liu X Q, Shi F, et al, 2022. Humidity changes and possible forcing mechanisms over the last millennium in arid Central Asia. Climate of the Past, 18: 975-988.

DOI

[32]
Ge Q, Hao Z, Zheng J, et al, 2013. Temperature changes over the past 2000 yr in China and comparison with the Northern Hemisphere. Climate of the Past, 9: 1153-1160.

DOI

[33]
Ge Q S, Zheng J Y, Hao Z X, et al, 2010. Temperature variation through 2000 years in China: An uncertainty analysis of reconstruction and regional difference. Geophysical Research Letters, 37(3): L03703.

[34]
Geophysical Institute of Academy of Science of China, Macroseismic Survey Group of Seismological Team of Shanxi Province, China (United Group), 2003. Survey report on September 17, 1303 Hongzhaoxian, Shanxi, Earthquake. Earthquake Research in Shanxi, 3: 23-30. (in Chinese)

[35]
Guo L C, Xiong S F, Ding Z L, et al, 2018. Role of the mid-Holocene environmental transition in the decline of late Neolithic cultures in the deserts of NE China. Quaternary Science Reviews, 190: 98-113.

DOI

[36]
Han J F, Yang Y D, 2021. The socioeconomic effects of extreme drought events in northern China on the Ming dynasty in the late fifteenth century. Climatic Change, 164(3): 1-17.

DOI

[37]
He F Q, 2008. General History of Disasters in China ( The Yuan Dynasty). Zhengzhou: Zhengzhou University Press. (in Chinese)

[38]
Hodell D A, Brenner M, Curtis J H, et al, 2001. Solar forcing of drought frequency in the Maya Lowlands. Science, 292(5520): 1367-1370.

DOI

[39]
Hou Y, Jiang D L, 2013. On Kangxi’s disaster relief measures from historical documents: A case study of the Gyeonggi earthquake in the 18th year of Kangxi. Agricultural Archaeology, 1: 98-101. (in Chinese)

[40]
Hu H J, Meng M J, Li B B, 2021. Flood hazard and disaster chain of Taihu Lake basin in Ming and Qing dynasties: A case study of Suzhou. Agricultural Archaeology, 4: 113-119. (in Chinese)

[41]
Huaxian County Local Chronicles Compilation Committee (HCLCCC), 1992. Annals of Huaxian County. Xi’an: Shaanxi People’s Publishing House. (in Chinese)

[42]
Jiang P, 2014. Disaster of the populace: Henan’s drought from 1942-1943. Journal of Henan University (Social Science), 54(3): 44-55. (in Chinese)

[43]
Jin Z D, Hilton R G, West A J, et al, 2021. The role of earthquake-induced landslides in erosion and weathering from active mountain ranges: Progress and perspectives. Science China Earth Sciences, 64(12): 2069-2082.

DOI

[44]
Jongman B, Hochrainer-Stigler S, Feyen L, et al, 2014. Increasing stress on disaster-risk finance due to large floods. Nature Climate Change, 4(4): 264-268.

DOI

[45]
Lan J H, Xu H, Lang Y C, et al, 2020. Dramatic weakening of the East Asian summer monsoon in northern China during the transition from the Medieval Warm Period to the Little Ice Age. Geology, 48(4): 307-312.

DOI

[46]
Lanzhou Institute of Seismology (LIS), State Seismological Bureau, Earthquake Team of Ningxia Hui Autonomous Region, 1980. The 1920 Haiyuan Great Earthquake. Beijing: Earthquake Publishing House. (in Chinese)

[47]
Lee H F, Zhang D D, Pei Q, et al, 2017. Quantitative analysis of the impact of droughts and floods on internal wars in China over the last 500 years. Science China Earth Sciences, 60: 2078-2088.

DOI

[48]
Lei G L, Zhu Y, Jiang X Y, et al, 2014. Climate variations over the past 1400 years inferred from an α-cellulose δ13C record from Xianshan peat in Southeast China. Scientia Geographica Sinica, 34(8): 1018-1024. (in Chinese)

[49]
León J A, Ordaz M, Haddad E, et al, 2022. Risk caused by the propagation of earthquake losses through the economy. Nature Communications, 13(1): 2908.

DOI PMID

[50]
Li C Y, 2000. On Han Tuo-zhou and Kaixi Northern Expedition. Journal of Anqing Teachers College (Social Science Edition), 19(4): 55-64. (in Chinese)

[51]
Li H, Xu D K, Shen C M, et al, 2021. Multi-centennial climate cycles and their impact on the Tubo Dynasty in the southern Tibetan Plateau. Palaeogeography, Palaeoclimatology, Palaeoecology, 578: 110584.

[52]
Li S, 2007. A review of recent 30 years’ researches on population in Yuan dynasty. Yindu Journal, 3: 43-48. (in Chinese)

[53]
Lin G P, Peng W Y, 2021. Putian General History. Beijing: Social Sciences Academic Press. (in Chinese)

[54]
Liu Q, Li G, Kong D Y, et al, 2018. Climate, disasters, wars and the collapse of the Ming Dynasty. Environmental Earth Sciences, 77: 44.

DOI

[55]
Lou B T, 1996. A Comprehensive Compilation of Historic and Recent Earthquakes Disaster Status in China. Beijing: Seismological Press. (in Chinese)

[56]
Ma Y X, Zhong P Y, 2009. Summarization of the Tancheng earthquake with 81/2 in 1668. Recent Developments in World Seismology, 2(362): 9-18. (in Chinese)

[57]
Man Z M, 2009. Research on Climate Change during Historical Times in China. Jinan: Shandong Education Press. (in Chinese)

[58]
Mao X W, Zhang H C, Qiao S Y, et al, 2021. The deep population history of northern East Asia from the Late Pleistocene to the Holocene. Cell, 184(12): 3256-3266.

DOI PMID

[59]
Molnar P, Tapponnier P, 1975. Cenozoic tectonics of Asia: Effects of a continental collision. Science, 189(4201): 419-426.

DOI

[60]
Pei Q, Zhang D D, 2014. Long-term relationship between climate change and nomadic migration in historical China. Ecology and Society, 19(2): 68.

[61]
Peng X W, 1958. The Chinese Monetary History. Shanghai: Shanghai People’s Publishing House. (in Chinese)

[62]
Qiu Y F, 2008. General History of Disasters in China ( The Song Dynasty). Zhengzhou: Zhengzhou University Press. (in Chinese)

[63]
Ren J J, Xu X W, Zhang S M, et al, 2018. Surface rupture of the 1933 M7.5 Diexi earthquake in eastern Tibet: Implications for seismogenic tectonics. Geophysical Journal International, 212(3): 1627-1644.

DOI

[64]
Salazar D, Easton G, Goff J, et al, 2022. Did a 3800-year-old Mw -9.5 earthquake trigger major social disruption in the Atacama Desert? Science Advances, 8(14): eabm2996.

[65]
Schellart W P, Chen Z, Strak V, et al, 2019. Pacific subduction control on Asian continental deformation including Tibetan extension and eastward extrusion tectonics. Nature Communications, 10(1): 4480.

DOI PMID

[66]
Selvaraj K, Wei K Y, Liu K K, et al, 2012. Late Holocene monsoon climate of northeastern Taiwan inferred from elemental (C, N) and isotopic (δ13C, δ15N) data in lake sediments. Quaternary Science Reviews, 37: 48-60.

DOI

[67]
Shang J F, Zhang L K, 2012. The study of earthquake disasters and earthquake relief in Gansu during the Republic of China: Based on the Haiyuan earthquake in 1920. Qinghai Journal of Ethnology, 23(1): 144-148. (in Chinese)

[68]
Su X L, 2009. Influence of Henan drought in 1942 on land-right change. Academic Forum of Nandu (Journal of the Humanities and Social Sciences), 29(4): 39-40. (in Chinese)

[69]
Su Z Z, Yuan Z M, Zhao J Q, 2003. A review on studies concerned with the 1303 Hongtong, Shanxi, Earthquake of M8. Earthquake Research in Shanxi, 3: 4-9. (in Chinese)

[70]
Sullivan K M, Hossain S M M, 2010. Earthquake mortality in Pakistan. Disasters, 34(1): 176-183.

DOI PMID

[71]
Tan L C, Cai Y J, Cheng H, et al, 2018. High resolution monsoon precipitation changes on southeastern Tibetan Plateau over the past 2300 years. Quaternary Science Reviews, 195: 122-132.

DOI

[72]
Tao J, Zhu J T, Zhang Y J, et al, 2022. Divergent effects of climate change on cropland ecosystem water use efficiency at different elevations in southwestern China. Journal of Geographical Sciences, 32(8): 1601-1614.

DOI

[73]
Ulus T, Ellenblum R, 2021. How long and how strong must a climatic anomaly be in order to evoke a social transformation? Historical and contemporaneous case studies. Humanities & Social Sciences Communications, 8: 252.

[74]
Wang M, Shen Z K, 2020. Present-day crustal deformation of continental China derived from GPS and its tectonic implications. Journal of Geophysical Research: Solid Earth, 125(2): e2019JB018774.

[75]
Wang R D, 2006. Huaxian, Shaanxi strong earthquake infrequent secondary disaster chain caused by the earthquake in the World-Talk from engineering ground condition. Earthquake Research in Shanxi, (2): 4-18. (in Chinese)

[76]
Wang X, 2011. On the formation and development of the territory of the Yuan dynasty. The Silk Road, (6): 30-31. (in Chinese)

[77]
Wang X Q, Liu F G, Zhang X B, et al, 2022. Asynchronized erosion effects due to climate and human activities on the central Loess Plateau of China during the Anthropocene and its implication for future soil and water management. Earth Surface Processes and Landforms, 47(5): 1238-1251.

DOI

[78]
Wei X T, Jiang H C, Xu H Y, et al, 2021. Response of sedimentary and pollen records to the 1933 Diexi earthquake on the eastern Tibetan Plateau. Ecological Indicators, 129: 107887.

DOI

[79]
Wei Z D, Fang X Q, Su Y, 2014. Climate change and fiscal balance in China over the past two millennia. The Holocene, 24(12): 1771-1784.

DOI

[80]
Winsemius H C, Aerts J C J H, van Beek L P H, et al, 2016. Global drivers of future river flood risk. Nature Climate Change, 6(4): 381-385.

DOI

[81]
Wu Q L, Zhao Z J, Liu L, et al, 2016. Outburst flood at 1920 BCE supports historicity of China’s great flood and the Xia Dynasty. Science, 353(6299): 579-582.

DOI

[82]
Xiao J L, Zhang S R, Fan J W, et al, 2019. The 4.2 ka event and its resulting cultural interruption in the Daihai Lake basin at the East Asian summer monsoon margin. Quaternary International, 527: 87-93.

DOI

[83]
Xiao L B, Fang X Q, Zheng J Y, et al, 2015. Famine, migration and war: Comparison of climate change impacts and social responses in North China between the late Ming and late Qing dynasties. The Holocene, 25(6): 900-910.

DOI

[84]
Xiao L B, Yan J H, 2019. Reconstruction of poor/bumper autumn harvest index series based on historical chorography and its relationship with climate change in North China from 1736 to 1911. Acta Geographica Sinica, 74(9): 1777-1788. (in Chinese)

DOI

[85]
Xiao S Y, Li T Y, Chen C J, et al, 2021. Pattern of precipitation changes in southern China during the Little Ice Age. Geological Review, 67(1): 56-68. (in Chinese)

[86]
Xie S C, Evershed R P, Huang X Y, et al, 2013. Concordant monsoon-driven postglacial hydrological changes in peat and stalagmite records and their impacts on prehistoric cultures in central China. Geology, 41(8): 827-830.

DOI

[87]
Xu C, Tian Y Y, Ma S Y, et al, 2018. Inventory and spatial distribution of landslides in IX-XI high intensity areas of 1920 Haiyuan (China) M8.5 earthquake. Journal of Engineering Geology, 26(5): 1188-1195. (in Chinese)

[88]
Xu X W, Deng Q D, 1996. Nonlinear characteristics of paleoseismicity in China. Journal of Geophysical Research, 101(B3): 6209-6231.

DOI

[89]
Xu X W, Han Z J, Yang X P, et al, 2016. Seismotectonic Map of China and Its Adjacent Area. Beijing: Seismological Press. (in Chinese)

[90]
Yancheva G, Nowaczyk N R, Mingram J, et al, 2007. Influence of the intertropical convergence zone on the East Asian monsoon. Nature, 445: 74-77.

DOI

[91]
Yang B, Qin C, Bräuning A, et al, 2021. Long-term decrease in Asian monsoon rainfall and abrupt climate change events over the past 6,700 years. Proceedings of the National Academy of Sciences of the United States of America, 118(30): e2102007118.

[92]
Ye Y, Fang X Q, Ge Q S, et al, 2004. Response and adaptation to climate change indicated by the relationship between revolt and drought-flood in Shandong Province during middle and late Qing Dynasty. Scientia Geographica Sinica, 24(6): 680-686. (in Chinese)

DOI

[93]
Yin J, Su Y, Fang X Q, 2016. Climate change and social vicissitudes in China over the past two millennia. Quaternary Research, 86(2): 133-143.

DOI

[94]
Yu A H, 2010. A study of geopolitical relations in the Southern Song Dynasty[D]. Kunming: Yunnan University. (in Chinese)

[95]
Yu S, Su Y P, Liu T S, et al, 2002. Rescue, Recovery and Reconstruction during the Aftermath of the Tangshan Earthquake. Beijing: Science and Technology of China Press. (in Chinese)

[96]
Yuan T H, Feng X J, 2010. The 1556 Huaxian Great Earthquake. Beijing: Earthquake Publishing House. (in Chinese)

[97]
Zeng X L, Liu Y, Song H M, et al, 2022. Tree-ring-based drought variability in northern China over the past three centuries. Journal of Geographical Sciences, 32(2): 214-224.

DOI

[98]
Zeng Y H, 2016. Inflation in the Republic of China viewed from the change of stamp duty ticket denomination. China Taxation, 6: 44-45. (in Chinese)

[99]
Zhang D D, Brecke P, Lee H F, et al, 2007. Global climate change, war, and population decline in recent human history. Proceedings of the National Academy of Sciences of the United States of America, 104(49): 19214-19219.

DOI PMID

[100]
Zhang D E, Li H C, Ku T L, et al, 2010. On linking climate to Chinese dynastic change: Spatial and temporal variations of monsoonal rain. Chinese Science Bulletin, 55(1): 77-83.

DOI

[101]
Zhang H W, Cheng H, Sinha A, et al, 2021a. Collapse of the Liangzhu and other Neolithic cultures in the lower Yangtze region in response to climate change. Science Advances, 7(48): eabi9275.

[102]
Zhang J C, 1982. Possible impacts of climatic variation on agricultural in China. Geographical Research, 1(2): 8-15. (in Chinese)

[103]
Zhang P Z, Shen Z K, Wang M, et al, 2004. Continuous deformation of the Tibetan Plateau from global positioning system data. Geology, 32(9): 809-812.

DOI

[104]
Zhang S D, Zhang D D, Pei Q, 2021b. Spatiotemporal shifts of population and war under climate change in imperial China. Climatic Change, 165(1): 1-19.

DOI

[105]
Zhang S Q, Jiang H C, Fan J W, et al, 2021c. Accumulation of a last deglacial gravel layer at Diexi, eastern Tibetan Plateau and its possible seismic significance. Frontiers in Earth Science, 9: 797732.

DOI

[106]
Zhang X L, Xu B Q, Günther F, et al, 2017. Rapid northward shift of the Indian Monsoon on the Tibetan Plateau at the end of the Little Ice Age. Journal of Geophysical Research: Atmospheres, 122(17): 9262-9279.

DOI

[107]
Zhao J Y, Cheng H, Yang Y, et al, 2021. Role of the summer monsoon variability in the collapse of the Ming Dynasty: Evidences from speleothem records. Geophysical Research Letters, 48(11): e2021GL093071.

[108]
Zheng J Y, Fang X Q, Wu S H, 2018. Recent progress of climate change research in physical geography studies from China. Progress in Geography, 37(1): 16-27. (in Chinese)

DOI

[109]
Zhou X J, Zhao P, Liu G, et al, 2011. Characteristics of decadal-centennial-scale changes in East Asian summer monsoon circulation and precipitation during the Medieval Warm Period and Little Ice Age and in the present day. Chinese Science Bulletin, 56(28/29): 3003-3011.

DOI

[110]
China Earthquake Administration (CEA), 1999a. Historical Strong Earthquake Catalog of China (2300 BC-1911 AD). Beijing: Earthquake Publishing House. (in Chinese)

[111]
China Earthquake Administration (CEA), 1999b. Recent Earthquake Catalog of China (1912-1990, Ms ≥ 4.7). Beijing: Chinese Sciences and Technology Press. (in Chinese)

[112]
Earthquake Agency of Ningxia Hui Autonomous Region (EANHAR), Haiyuan County Committee of the Communist Party of China, Haiyuan County People’s Government, 2010. Haiyuan Earthquake·1920. Yinchuan: Sunshine Press of the Yellow River Publishing & Media Group Company Limited. (in Chinese)

[113]
Yuan T H, Feng X J, 2010. The 1556 Huaxian Great Earthquake. Beijing: Earthquake Publishing House. (in Chinese)

Outlines

/