
Journal of Geographical Sciences >
Spatio-temporal accuracy evaluation of MSWEP daily precipitation over the Huaihe River Basin, China: A comparison study with representative satellite- and reanalysis-based products
|
Li Lingjie (1992-), Engineer and PhD Candidate, specialized in hydrology and water resources. E-mail: ljli@nhri.cn |
Received date: 2021-07-31
Accepted date: 2021-12-27
Online published: 2022-11-25
Supported by
National Key R&D Program of China(2021YFC3000104)
National Natural Science Foundation of China(52009081)
National Natural Science Foundation of China(51479118)
Special Funded Project for Basic Scientific Research Operation Expenses of the Central Public Welfare Scientific Research Institutes of China(Y519006)
Multi-source weighted-ensemble precipitation (MSWEP) is one of the most popular merged global precipitation products with long-term spanning and high spatial resolution. While various studies have acknowledged its ability to accurately estimate precipitation in terms of temporal dynamics, its performance regarding spatial pattern and extreme rainfall is overlooked. To fill this knowledge gap, the daily precipitation of two versions of MSWEP (MSWEP V2.1 & V2.2) are compared with that of three representative satellite- and reanalysis-based products, namely the Tropical Rainfall Measuring Mission (TRMM 3B42 V7), the climate prediction center morphing technique satellite-gauge merged product (CMORPH BLD), and the fifth-generation reanalysis product of the European Centre for Medium Range Weather Forecasts (ERA5). The comparison is made according to the dense daily rainfall observations from 539 rain gauges over the Huaihe River Basin in China during 2006-2015. The results show that MSWEP V2.1, MSWEP V2.2 and CMORPH BLD have better performance on temporal accuracy of precipitation estimation, followed by ERA5 and TRMM 3B42 V7. MSWEPs yield the most even spatial distribution across the basin since it takes full advantage of the multi datasets. As the weighted-ensemble method is independently carried out on each grid in MSWEPs, the spatial distribution of local precipitation is changed by different source data, which results in that MSWEPs perform worse than CMORPH BLD in terms of the representation of precipitation spatial pattern. In addition, the capability of MSWEPs to describe the spatial structure in the rainy season is lower than that in the dry season. Strong precipitation (≥100 mm/d) events are better represented in TRMM 3B42 V7 products than in MSWEPs. Finally, based on the comparison results, we suggest to improve the merging algorithm of MSWEP by considering the precipitation spatial self-correlation and adjusting the merging weights based on the performance of the source datasets under different precipitation intensities.
Key words: MSWEP; temporal accuracy; spatial pattern; extreme precipitation; Huaihe River Basin
LI Lingjie , WANG Yintang , WANG Leizhi , HU Qingfang , ZHU Zhenduo , LI Liping , LI Chengxi . Spatio-temporal accuracy evaluation of MSWEP daily precipitation over the Huaihe River Basin, China: A comparison study with representative satellite- and reanalysis-based products[J]. Journal of Geographical Sciences, 2022 , 32(11) : 2271 -2290 . DOI: 10.1007/s11442-022-2047-9
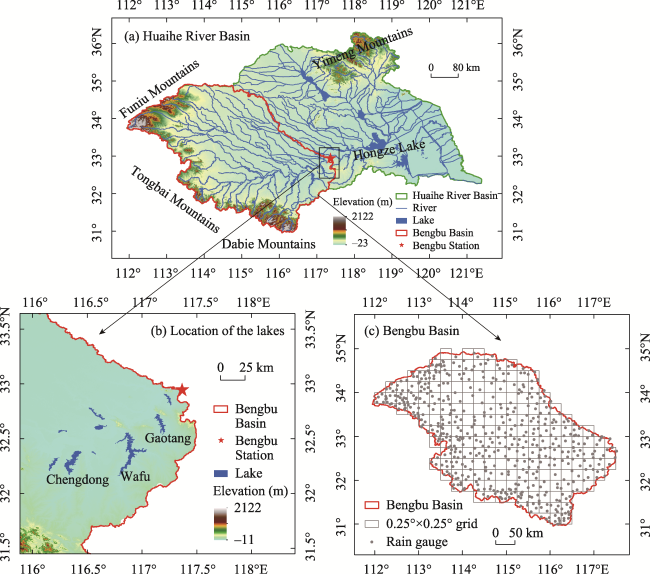
Figure 1 Geographical locations of (a) the Bengbu Basin, (b) lakes and (c) rain gauge stations |
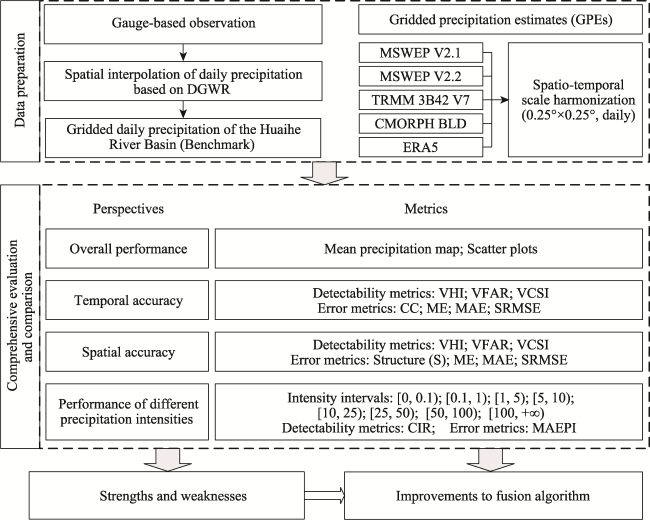
Figure 2 The framework of the research method |
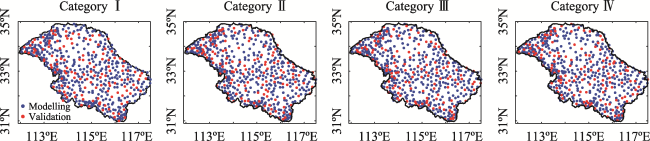
Figure 3 Spatial distributions of gauge station networks in the Bengbu Basin for the cross-validation of double geographically weighted regression (DGWR) |
Table 1 Accuracies of the DGWR-based precipitation estimates using four categories of gauge networks |
| Gauge networks | Modeling gauges | Validation gauges | ||||||
|---|---|---|---|---|---|---|---|---|
| CIR | MAE (mm/d) | SRMSE | CC | CIR | MAE (mm/d) | SRMSE | CC | |
| Category I | 0.87 | 1.1 | 1.36 | 0.85 | 0.84 | 1.6 | 1.77 | 0.76 |
| Category II | 0.87 | 1.1 | 1.33 | 0.85 | 0.85 | 1.7 | 1.67 | 0.77 |
| Category III | 0.87 | 1.1 | 1.35 | 0.85 | 0.85 | 1.6 | 1.61 | 0.78 |
| Category IV | 0.87 | 1.1 | 1.35 | 0.86 | 0.85 | 1.7 | 1.65 | 0.77 |
Note: The threshold value is set as 0.1 mm/d. |
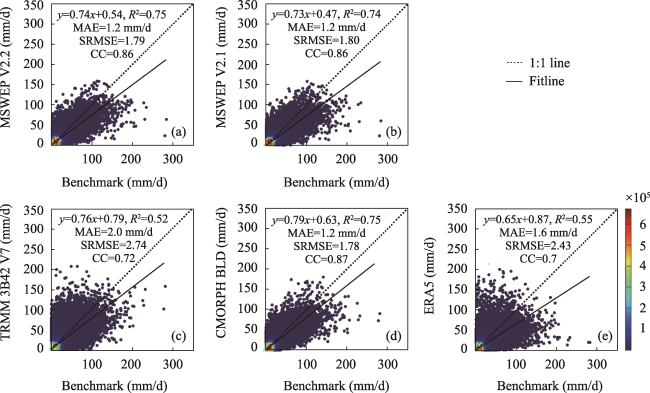
Figure 4 Scatter plots of daily precipitation of the five gridded precipitation estimates in the Bengbu Basin versus the benchmark dataset at 0.25°×0.25° grids |
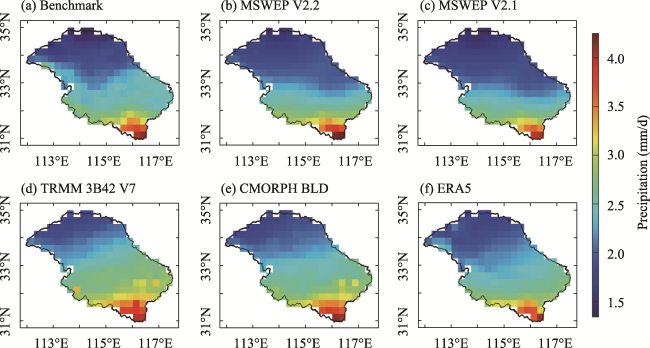
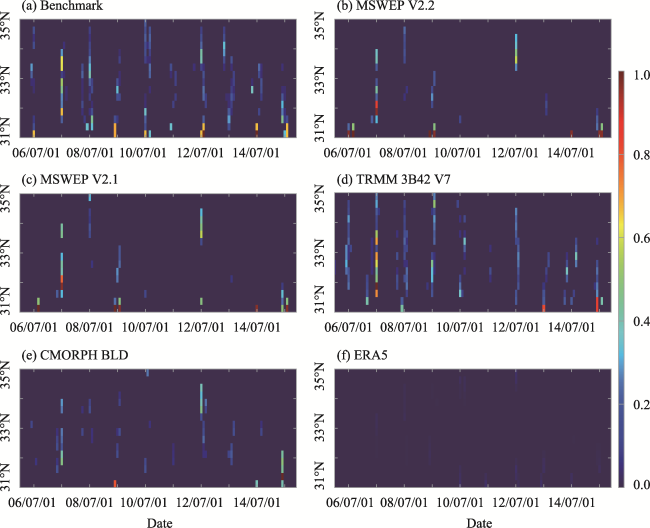
Figure 5 Spatial distributions of daily mean precipitation of the benchmark dataset and the five gridded precipitation estimates in the Bengbu Basin from 2006 to 2015 |
Table 2 Mean values of the temporal accuracy indexes of the five gridded precipitation estimates compared to the benchmark over the Bengbu Basin during 2006-2015 |
| Indexes | MSWEP V2.2 | MSWEP V2.1 | TRMM 3B42 V7 | CMORPH BLD | ERA5 |
|---|---|---|---|---|---|
| VHI | 0.99 | 0.98 | 0.91 | 1.00 | 0.99 |
| VFAR | 0.07 | 0.06 | 0.12 | 0.07 | 0.09 |
| VCSI | 0.92 | 0.92 | 0.81 | 0.93 | 0.91 |
| CC | 0.87 | 0.87 | 0.72 | 0.87 | 0.75 |
| ME (mm/d) | 0.0 | -0.1 | 0.3 | 0.2 | 0.1 |
| MAE (mm/d) | 1.2 | 1.2 | 2.0 | 1.2 | 1.6 |
| SRMSE | 1.79 | 1.80 | 2.77 | 1.80 | 2.45 |
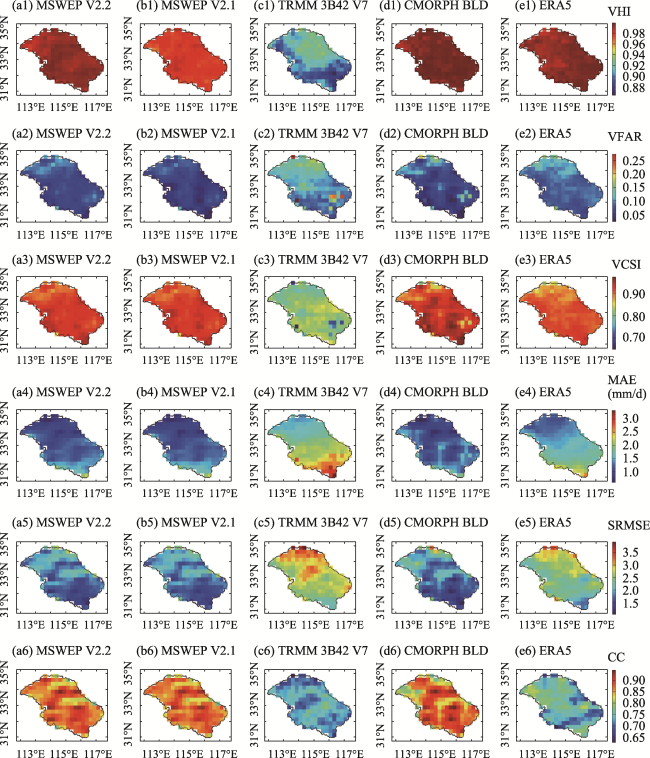
Figure 6 Spatial patterns of temporal accuracy indexes for the five gridded precipitation estimates in the Bengbu Basin compared to the benchmark at 0.25°×0.25° grids |
Table 3 Mean values of the spatial accuracy metrics of the five gridded precipitation estimates compared to the benchmark dataset over the Bengbu Basin from 2006 to 2015 |
| Metrics | MSWEP V2.2 | MSWEP V2.1 | TRMM 3B42 V7 | CMORPH BLD | ERA5 |
|---|---|---|---|---|---|
| VHI | 0.93 | 0.87 | 0.77 | 0.96 | 0.94 |
| VFAR | 0.18 | 0.15 | 0.18 | 0.16 | 0.21 |
| VCSI | 0.79 | 0.75 | 0.66 | 0.82 | 0.76 |
| S | 0.41 | 0.44 | 0.37 | 0.49 | 0.29 |
| ME (mm/d) | -0.2 | -0.3 | 0.3 | 0.3 | 0.1 |
| MAE (mm/d) | 2.5 | 2.6 | 4.3 | 2.5 | 3.4 |
| SRMSE | 2.62 | 2.50 | 6.54 | 2.84 | 2.90 |
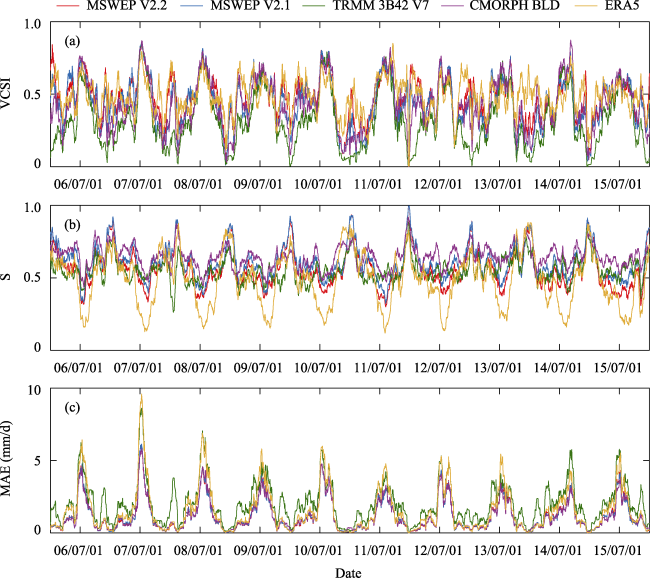
Figure 7 Temporal variations of spatial accuracy indexes of the five gridded precipitation estimates in the Bengbu Basin versus the benchmark dataset |
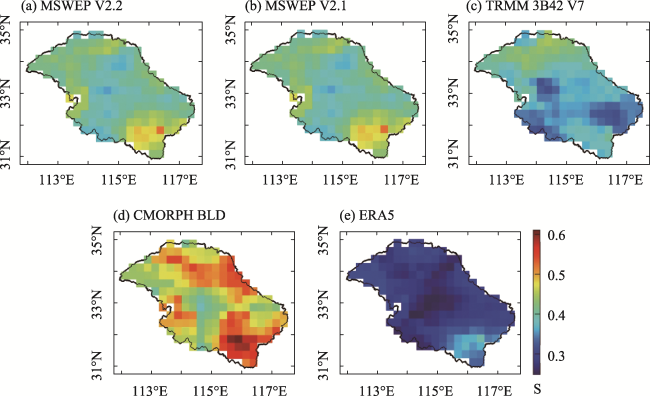
Figure 8 Spatial variations of the structure indexes of the five gridded precipitation estimates in the Bengbu Basin versus the benchmark dataset at 0.25°×0.25° grids |
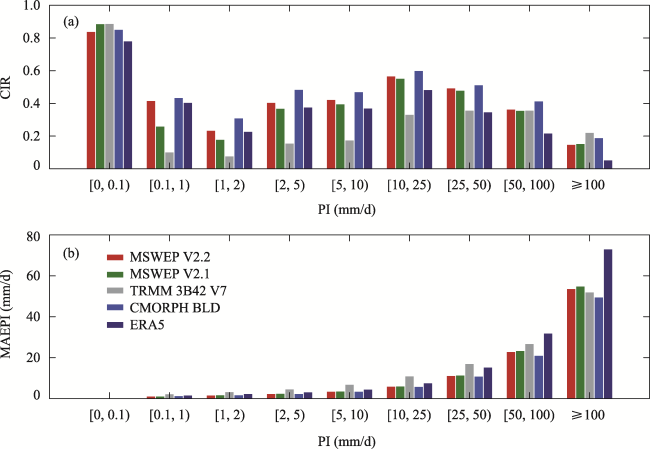
Figure 9 Correct identification ratios (CIRs) and mean absolute errors (MAEPIs) of the five gridded precipitation estimates in the Bengbu Basin under different precipitation intensities |
Figure 10 Latitudinal variations of the CIRs of all the gridded precipitation estimates for extreme precipitation events (≥100 mm/d) in all months over the Bengbu Basin from 2016 to 2015 |
| [1] |
|
| [2] |
|
| [3] |
|
| [4] |
|
| [5] |
|
| [6] |
|
| [7] |
|
| [8] |
|
| [9] |
|
| [10] |
|
| [11] |
|
| [12] |
|
| [13] |
|
| [14] |
|
| [15] |
|
| [16] |
|
| [17] |
|
| [18] |
|
| [19] |
|
| [20] |
|
| [21] |
|
| [22] |
|
| [23] |
|
| [24] |
|
| [25] |
|
| [26] |
|
| [27] |
|
| [28] |
|
| [29] |
|
| [30] |
|
| [31] |
|
| [32] |
|
| [33] |
|
| [34] |
|
| [35] |
|
| [36] |
|
| [37] |
|
| [38] |
|
| [39] |
|
| [40] |
|
/
| 〈 |
|
〉 |