
Journal of Geographical Sciences >
Urban construction land demand prediction and spatial pattern simulation under carbon peak and neutrality goals: A case study of Guangzhou, China
|
Hu Xintao (1997‒), PhD Candidate, specialized in econometric and policy evaluation research. E-mail: hxt_wel@163.com |
Received date: 2021-11-03
Accepted date: 2022-03-14
Online published: 2022-11-25
Supported by
National Natural Science Foundation of China(41971233)
Urban construction land has relatively high human activity and high carbon emissions. Research on urban construction land prediction under carbon peak and neutrality goals (hereafter “dual carbon” goals) is important for territorial spatial planning. This study analyzed quantitative relationships between carbon emissions and urban construction land, and then modified the construction land demand prediction model. Thereafter, an integrated model for urban construction land demand prediction and spatial pattern simulation under “dual carbon” goals was developed, where urban construction land suitability was modified based on carbon source and sink capacity of different land-use types. Using Guangzhou as a case study, the integrated model was validated and applied to simulate the spatiotemporal dynamics of its urban construction land during 2030-2060 under baseline development and “dual carbon” goals scenarios. The simulation results showed that Guangzhou’s urban construction land expanded rapidly until 2030, with the spatial pattern not showing an intensive development trend. Guangzhou’s urban construction land expansion slowed during 2030-2060, with an average annual growth rate of 0.2%, and a centralized spatial pattern trend. Under the “dual carbon” goal scenario, Guangzhou’s urban construction land evolved into a polycentric development pattern in 2030. Compared with the baseline development scenario, urban construction land expansion in Guangzhou during 2030-2060 is slower, with an average annual growth rate of only 0.1%, and the polycentric development pattern of urban construction land was more prominent. Furthermore, land maintenance and growth, that is, a carbon sink, is more obvious under the “dual carbon” goals scenario, with the forest land area nearly 10.6% higher than that under the baseline development scenario. The study of urban construction land demand prediction and spatial pattern simulation under “dual carbon” goals provides a scientific decision-making support tool for territorial spatial planning, aiding in quantifying territorial spatial planning.
HU Xintao , LI Zhihui , CAI Yumei , WU Feng . Urban construction land demand prediction and spatial pattern simulation under carbon peak and neutrality goals: A case study of Guangzhou, China[J]. Journal of Geographical Sciences, 2022 , 32(11) : 2251 -2270 . DOI: 10.1007/s11442-022-2046-x
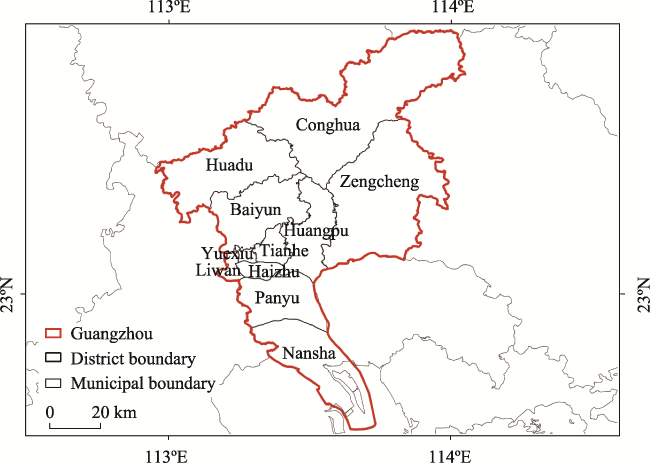
Figure 1 Geographical location of Guangzhou |
Table 1 Descriptive statistics of the indicators |
| Variables | Min | Max | Mean | Variance |
|---|---|---|---|---|
| Urban construction land area (km2) | 735 | 1300 | 1017 | 31,200 |
| Resident population density (person/km2) | 1227 | 2005 | 1639 | 62,289 |
| GDP per capita (yuan/person) | 54,627 | 153,373 | 104,038 | 1,079,426,922 |
| Energy consumption per unit of GDP (million tons/billion dollars) | 27 | 78 | 44 | 256 |
| Proportion of added value of the tertiary industry in GDP (%) | 58 | 70 | 63 | 16 |
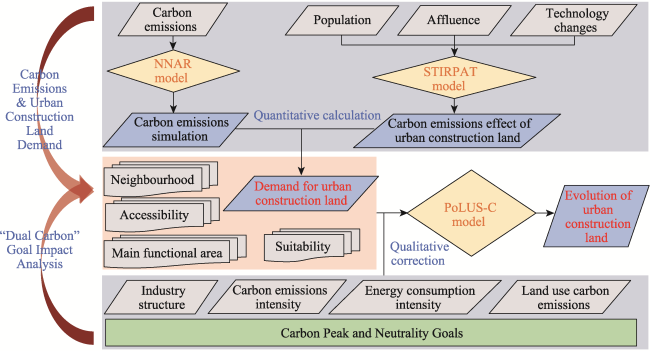
Figure 2 Framework for the integrated model for future urban construction land demand prediction and spatial pattern simulation under the “dual carbon” goals scenario |
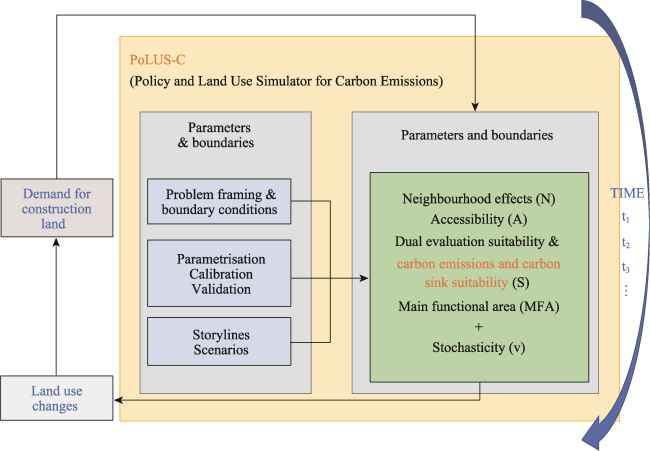
Figure 3 PoLUS-C model framework |
Table 2 Standardized regression coefficients and significance tests of the STIRPAT model |
| Variables | Estimate | Std. Error | t value | Pr (>|t|) |
|---|---|---|---|---|
| Urban construction land area (km2) | 0.14 | 0.03 | 5.96 | 0.00005*** |
| Resident population density (person/km2) | 0.16 | 0.04 | 5.07 | 0.0002*** |
| GDP per capita (yuan/person) | 0.16 | 0.04 | 5.25 | 0.0001*** |
| Energy consumption per unit GDP (million tons/billion dollars) | -0.15 | 0.04 | -5.34 | 0.0001*** |
| Proportion of added value of the tertiary industry in GDP (%) | 0.14 | 0.03 | 4.45 | 0.0007*** |
| One-period-lagged carbon emissions (million tons) | 0.14 | 0.03 | 4.41 | 0.0007*** |
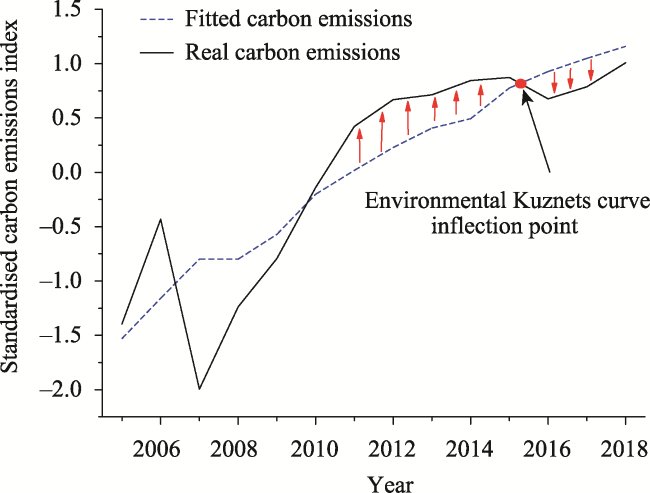
Figure 4 Fitted results for standardized carbon emissions in Guangzhou during 2005-2018 |
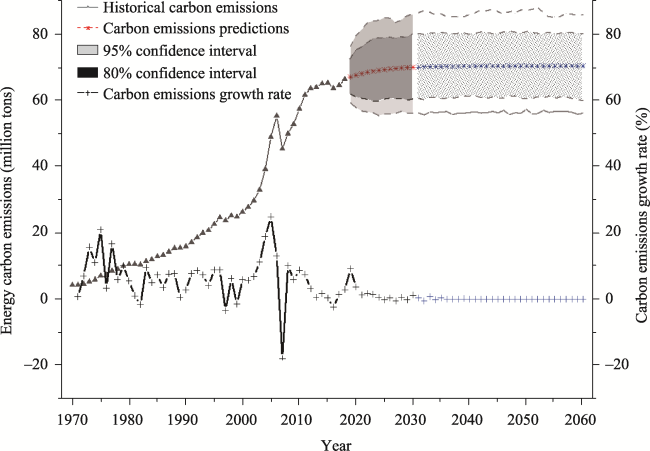
Figure 5 Predicted results of urban carbon emissions in Guangzhou (red dotted line is the predicted results of urban carbon emissions during 2019-2030, the blue line is the predicted results of urban carbon emissions during 2030-2060, 80%, and 95% prediction intervals are calculated by bootstrap method) |
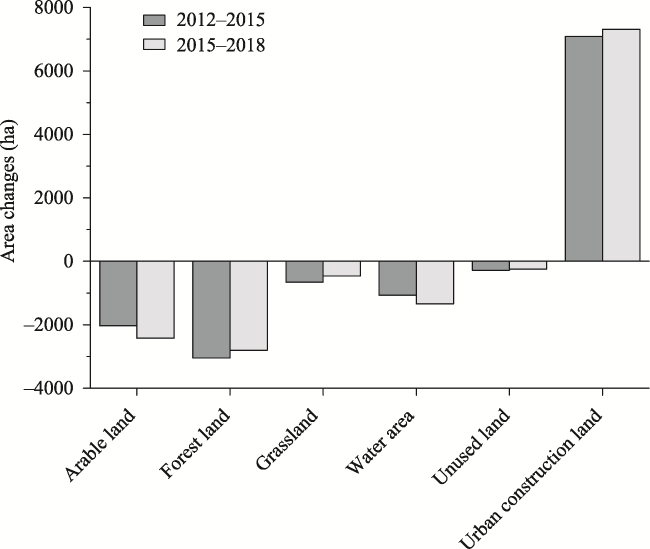
Figure 6 Area changes of different land-use types in Guangzhou during 2012-2018 |
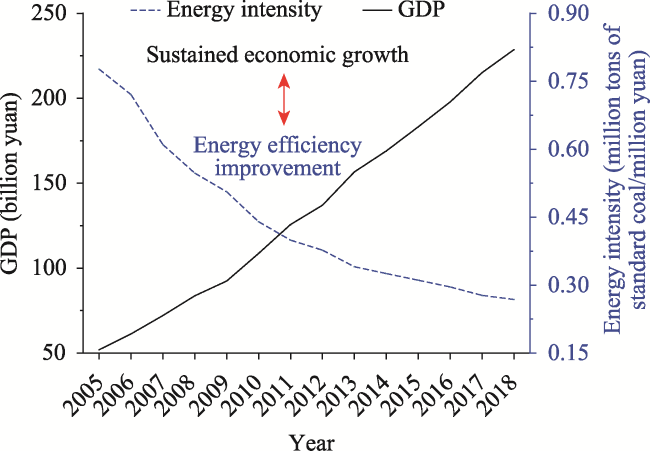
Figure 7 Change in energy consumption intensity in Guangzhou |
Table 3 Parameter schemes for urban construction land demand prediction and spatial pattern simulation in Guangzhou (the unit for urban construction land demand ha, other parameters are the weighting between modules affecting the evolution of urban construction land spatial pattern) |
| Parameter type | Baseline development scenario | “Dual carbon” scenario | |||
|---|---|---|---|---|---|
| 2030 | 2060 | 2030 | 2060 | ||
| Urban construction land demand (ha) | 287,420 | 304,665 | 265,990 | 273,969 | |
| Neighborhood | 20 | 20 | 20 | 20 | |
| Accessibility | Main roads | 5 | 5 | 5 | 5 |
| Railroad | 10 | 10 | 10 | 10 | |
| Highway | 5 | 5 | 5 | 5 | |
| Suitability | DES | 20 | 20 | 10 | 7 |
| CECSS | / | / | 10 | 14 | |
| MFA | 20 | 20 | 20 | 20 | |
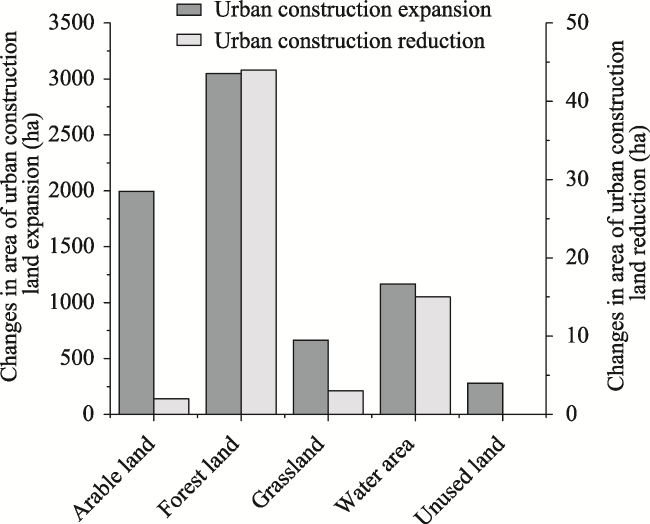
Figure 8 Urban construction land expansion and reduction in Guangzhou during 2012-2015 |
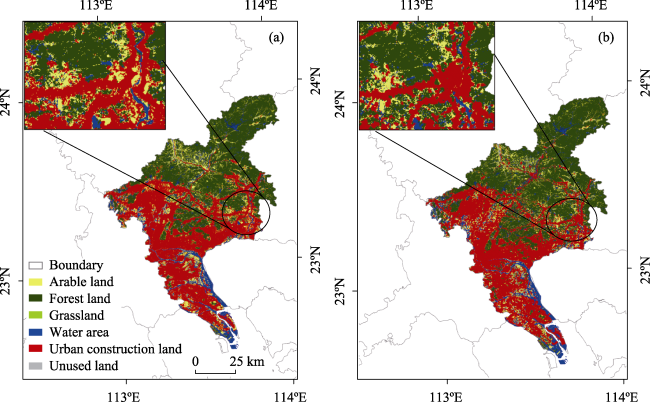
Figure 9 Simulation results of the urban construction land spatial pattern in Guangzhou in 2030 (a. Baseline development scenario; b. “Dual carbon” goals scenario) |
Table 4 Comparison of simulation results by land-use type under different scenarios in Guangzhou in 2030 |
| Land-use type | Area (ha) | |||
|---|---|---|---|---|
| Baseline development scenario | Area changes compared to 2018 | “Dual carbon” goals scenario | Area changes compared to 2018 | |
| Arable land | 81,169 | -1233 | 70,578 | ‒11,824 |
| Forest land | 297,947 | -59,360 | 328,294 | -29,013 |
| Grassland | 672 | -1955 | 921 | -1706 |
| Water area | 58,624 | -36,582 | 59,975 | -35,231 |
| Unused land | 471 | -1209 | 546 | -1134 |
| Urban construction land | 287,421 | 100,298 | 265,990 | 78,867 |
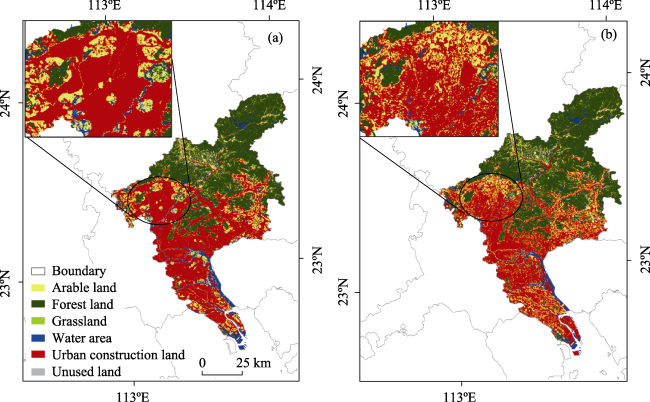
Figure 10 Simulation results of the urban construction land spatial pattern in Guangzhou in 2060 (a. Baseline development scenario; b. “Dual carbon” goals scenario) |
Table 5 Comparison of simulation results by land-use type under different scenarios in Guangzhou in 2060 |
| Land-use type | Area (ha) | |||
|---|---|---|---|---|
| Baseline development scenario | Area changes compared to 2030 | “Dual carbon” scenario | Area changes compared to 2030 | |
| Arable land | 102,780 | 21,611 | 113,925 | 43,347 |
| Forest land | 274,086 | -23,861 | 303,310 | -24,984 |
| Grassland | 450 | -222 | 334 | -587 |
| Water area | 43,984 | -14,640 | 34,500 | -25,475 |
| Unused land | 339 | -132 | 265 | -281 |
| Urban construction land | 304,665 | 17,244 | 273,970 | 7980 |
| [1] |
|
| [2] |
|
| [3] |
|
| [4] |
|
| [5] |
|
| [6] |
|
| [7] |
|
| [8] |
|
| [9] |
|
| [10] |
|
| [11] |
|
| [12] |
|
| [13] |
|
| [14] |
|
| [15] |
|
| [16] |
|
| [17] |
|
| [18] |
|
| [19] |
|
| [20] |
|
| [21] |
|
| [22] |
|
| [23] |
|
| [24] |
|
| [25] |
|
| [26] |
|
| [27] |
|
| [28] |
|
| [29] |
|
| [30] |
|
| [31] |
|
| [32] |
|
| [33] |
|
| [34] |
|
| [35] |
|
| [36] |
|
| [37] |
|
| [38] |
|
| [39] |
|
| [40] |
|
| [41] |
|
| [42] |
|
| [43] |
|
| [44] |
|
/
| 〈 |
|
〉 |