Research Articles

Assessment of the socioeconomic development levels of six economic corridors in the Belt and Road region

  • YOU Zhen , 1 ,
  • SHI Hui 1, 2 ,
  • FENG Zhiming , 1, 3, * ,
  • XIAO Chiwei 1
Expand
  • 1. Institute of Geographic Sciences and Natural Resources Research, CAS, Beijing 100101, China
  • 2. Department of Geography, University of California Santa Barbara, California 93106, USA
  • 3. Key Laboratory of Carrying Capacity Assessment for Resource and Environment, Ministry of Natural Resources, Beijing 101149, China
*Feng Zhiming, Professor, E-mail:

You Zhen, PhD, E-mail:

Received date: 2021-12-10

  Accepted date: 2022-06-02

  Online published: 2022-11-25

Supported by

The Strategic Priority Research Program of the Chinese Academy of Sciences(XDA20010203)

The Second Tibetan Plateau Scientific Expedition and Research Program(2019QZKK1006)

National Natural Science Foundation of China(42130508)

The Chinese Academy of Sciences(ZDRW-XH-2021-3)

Abstract

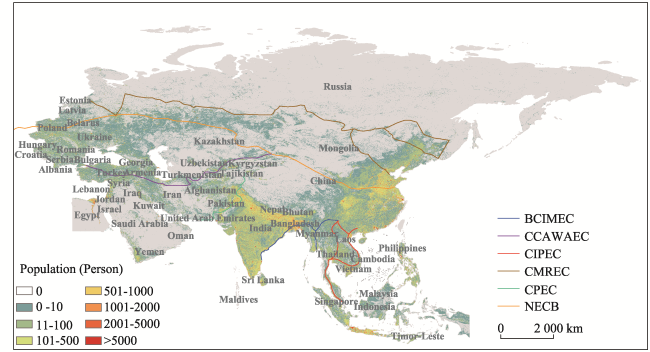
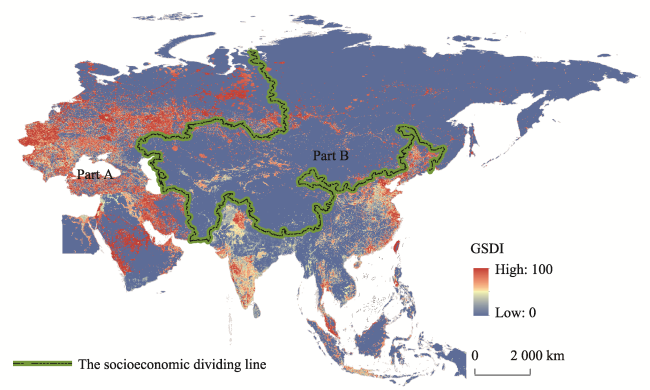
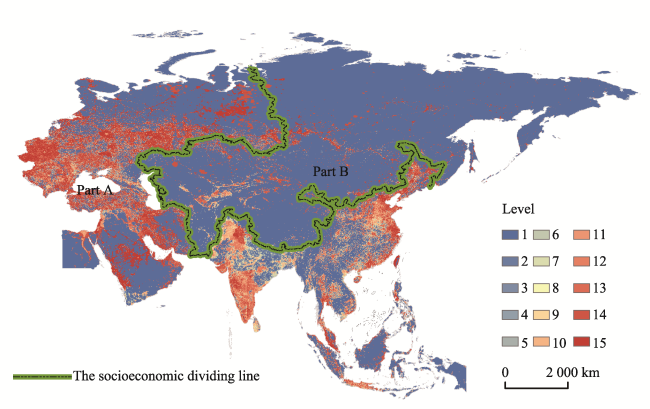
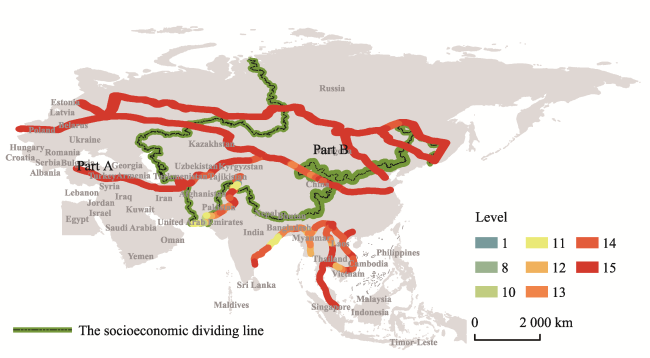
Recent years have witnessed rapid and widespread economic growth in regions involved in China’s Belt and Road Initiative (BRI), mainly due to the construction of six economic corridors. This paper aims to quantify the levels of six economic corridors according to the socioeconomic development levels in the BRI regions. Here, a gridded socioeconomic development index was first created, and a dividing line was drawn to reveal the distribution characteristics of socioeconomic development in the BRI regions. A classification method was then applied to identify local development levels. Finally, we created an economic corridor development index (ECDI) to evaluate the progress of six economic corridors. The results reveal spatial heterogeneity within the socioeconomic groups of BRI regions, which can be roughly divided into offshore (or Part A, 50.54%) and inland (or Part B, 49.46%) areas. Although both parts comprise roughly the same area, over 95% of the population is located in offshore regions. The China-Mongolia-Russia Economic Corridor has the highest development index due to a stable political environment and long-running cooperation. The China-Pakistan Economic Corridor suffers from the lowest ECDI but with strong development potential. Our methods can provide critical reference and practice for the future evaluation of the level of regional development. The results of this study can offer policymakers some insight into reducing socioeconomic inequality in the BRI regions.

Cite this article

YOU Zhen , SHI Hui , FENG Zhiming , XIAO Chiwei . Assessment of the socioeconomic development levels of six economic corridors in the Belt and Road region[J]. Journal of Geographical Sciences, 2022 , 32(11) : 2189 -2204 . DOI: 10.1007/s11442-022-2043-0

1 Introduction

The assessment of social and economic development levels is a foundational task of sustainable development research. In 2013, Chinese President Xi Jinping proposed the Belt and Road Initiative (BRI) with the principles of “openness and inclusiveness” and “wide negotiation, joint development, and sharing benefits,” expecting to further strengthen the economic collaboration among the BRI countries, which have attracted worldwide attention (Shrestha, 2017; Han et al., 2018; Liu et al., 2018; Song et al., 2018; Taewoo et al., 2018; Shi et al., 2019; Liu et al., 2020; Calabrese and Cao, 2021; Carrai, 2021), particularly in the establishment of six economic corridors, namely, the Bangladesh-China-India-Myanmar Economic Corridor (BCIMEC), the China-Central Asia-West Asia Economic Corridor (CCAWAEC), the China-Indochina Peninsula Economic Corridor (CIPEC), the China-Mongolia-Russia Economic Corridor (CMREC), China-Pakistan Economic Corridor (CPEC), and the New Eurasian Continental Bridge (NECB). These economic corridors represent the critical frame of the BRI, which have made significant contributions to local trade, tourism development, and cultural exchange, and provide a clear direction for future investments, cross-border cooperation, and the construction of transportation links (Battamo et al., 2021; Zhao et al., 2022). Global ongoing initiatives like the 2030 United Nations identified 17 sustainable development goals (Fischer, 2021) which are closely compatible with the principles of the BRI. Within this context, determining effective ways to scientifically evaluate the level of regional socioeconomic development and to reasonably gauge the condition of economic corridors along the BRI regions is of great significance (Lélé, 1991; Harrison, 1997; Solar et al., 2016; Fan et al., 2021; Schindler et al., 2021).
The gross domestic product (GDP) per capita and gross national product per capita are the earliest and most commonly used indicators of regional economic status and standard of living (UN, 1954; Yang, 2000; Le Gallo and Ertur, 2003; Arkhangel'skii, 2009; Mujtaba et al., 2013). However, neither indicator can adequately reflect the social welfare of citizens (Castaneda, 1999; Mazumdar, 2003). Therefore, many scholars began to improve upon the GDP indicator by adding social indicators. For instance, Daly and Cobb (1989) proposed an index of sustainable economic welfare. It spans income inequalities, household labor, and damage to natural capital, providing corrections to the GDP. Then Castaneda (1999) applied sustainable economic welfare to Chile and found a close relationship between economic growth and the depletion of natural resources. In particular, the United Nations Development Programme (UNDP) creatively proposed the Human Development Index (HDI) in 1990, which measures income, education, and life expectancy. Although the HDI has been accepted by many scholars, policymakers, and development agencies (Sanusi, 2008; Eren et al., 2014), it has also faced criticisms: some have suggested that it does not perform well in measuring development due to the poor data quality and other limitations of available data (Srinavasan, 1994; Spangenberg, 2016), while others have criticized technical aspects of the HDI (Gormely, 1995; Noorbakhsh, 1998; Tofallis, 2013). Chaaban et al. (2016) proposed a Composite Global Well-Being Index to address these deficiencies, including socioeconomic indicators and survey data. Since this index considers ten well-being aspects (e.g., safety and security, health, and education), it is less sensitive to income fluctuation than the HDI. More importantly, You et al. (2020) formulated a socioeconomic development index based on 17 sub-indices covering human development, transportation accessibility, and urbanization. They concluded that the HDI performs well in reflecting the developmental status in regions with low levels of socioeconomic development in the BRI regions. At the same time, urbanization and transportation accessibility accurately expresses the developmental phase of high socioeconomic development level regions. However, since most studies focus on the level of socioeconomic development based on the statistical data of administrative units, there are some challenges that include limitations on data quality and availability and lack of adequate spatial distribution information. These drawbacks can be effectively resolved with raster data having spatial attributes characterized by massive and multi-source datasets.
Research that focuses on the BRI regions or economic corridors has been increasing, including international relations (Shrestha, 2017), environment (Zhang et al., 2017; Ascensão et al., 2018), trade (Taewoo et al., 2018), health (Tang et al., 2017), transportation (Shi et al., 2019), urbanization (Liu et al., 2018), and other issues. For instance, Li et al. (2017) explored the spatial and temporal city development of the BRI regions by using the DMSP/OLS nighttime light data from 1993 to 2012. The results suggest that nighttime light increased in most countries along the BRI, and the distribution of urban land has become more concentrated. Liu et al. (2018) studied the changes in population and urbanization in BRI counties from 1950 to 2050 through spatial auto-correlation analysis and hierarchical cluster analysis. The mean center of the population was displaced from northwest to southeast before 2000 but has been on a southern path since then. Between 2015 and 2030, Thailand, China, Laos, and Albania will be urban population hotspots, and urban coldspots will include Kuwait, Cyprus, Qatar, and Estonia. Subsequently, Shi et al. (2019) developed a transportation accessibility index to probe the relationship between accessibility and population distribution. The link between accessibility and population dispersion is positive. However, their relationship tends to be weaker with increasing socioeconomic development. Regarding research on economic corridors, Karim and Islam (2018) discoursed the prospects and challenges of the BCIMEC, while Ali et al. (2018) shared their ideas about the development of the CPEC, which mainly include four positive points: (1) it can enhance the relationship between Pakistan and neighboring nations thereby improving trade relations; (2) Pakistan may be able to significantly benefit from transit fees; (3) most backward regions can be developed; (4) the living quality of less-developed areas can be improved. Considering most existing studies related to economic corridors are not from political or economic perspectives, Battamo et al. (2021) considered geographical factors. They mapped the socio-ecological resilience of BRI economic corridors pertaining to river basins. Their results showed striking social and environmental differences among corridors. For example, the Bangladesh-India-Myanmar and China-Pakistan corridors were characterized by relatively low resilience. As most BRI routes currently struggle with resource limits, the socioeconomic growth of those corridors may be impeded in some way. Also, Rippa (2020) also gave some perspective on the economic corridor between China and Pakistan, and Bian et al. (2021) developed a mountain green cover index along the BRI economic corridors. However, research addressing the assessment of regional socioeconomic development and quantification of the developmental state of the six economic corridors remains surprisingly lacking.
This study comprehensively applies big earth data and interdisciplinary knowledge such as geographic information, remote sensing, economics, and statistics to achieve data fusion. Specifically, we use a raster dataset with a 10 km2 resolution as the basic unit and produce a gridded index of human development, transportation, and urbanization. Based on this output, we simulate a BRI socioeconomic dividing line. To measure the developmental phases of economic corridors, we propose a new classification method using a coefficient of variation (CV) to identify local development levels in the BRI regions by identifying 15 sub-levels to create an economic corridor development index (ECDI) based on the classification results. Our results can provide insight for the future assessment of developmental conditions of economic corridors, and the results can be used to design targeted strategies to alleviate the socioeconomic disparity in BRI regions.

2 Study area

There is no specific list of BRI countries or regions, for it is open to all interested countries. Generally, there is a commonly used group of 65 countries (Zhang et al., 2019), including six economic corridors, i.e., the Bangladesh-China-India-Myanmar Economic Corridor (BCIMEC), the China-Central Asia-West Asia Economic Corridor (CCAWAEC), the China-Indochina Peninsula Economic Corridor (CIPEC), the China-Mongolia-Russia Economic Corridor (CMREC), the China-Pakistan Economic Corridor (CPEC), and the New Eurasian Continental Bridge (NECB) (Figure 1). According to World Bank statistics, the contribution of those 65 countries to global GDP is around 30%, and their GDP per capita increased by 132% from 2015 to 2020 (Liu, 2019), significantly exceeding the global GDP per capita rise. In 2013, the BCIMEC proposed to bring benefits to Bangladesh, China, India, and Myanmar while also spurring prosperity in South, Southeast, and East Asia. The CCAWAEC starts in Xinjiang, China, and extends through Central Asia to the Persian Gulf, Mediterranean Sea, and the Arabian Peninsula. The CIPEC connects China to the Indochina Peninsula, passing through Vietnam, Laos, Cambodia, Thailand, Myanmar, and Malaysia to strengthen China’s ties with the Association of Southeast Asian Nations. The CMREC has two main traffic arteries: (1) from the Beijing-Tianjin-Hebei region of China to Hohhot and then to Mongolia and Russia, and (2) from the Chinese cities of Dalian, Shenyang, Changchun, Harbin, and Manzhouli to Chita, Russia. At the same time, the CPEC links the Silk Road Economic Belt in the north and the 21st Century Maritime Silk Road in the south, from Kashi, China, to Gwadar, Pakistan. The NECB is an international passageway connecting the Pacific and the Atlantic. It extends from the coastal cities of Lianyungang and Rizhao, China to Rotterdam, Holland, and Antwerp, Belgium.
Figure 1 Spatial distribution of population and locations of six economic corridors in the BRI regions
Figure 1 shows the spatial distribution of the population and locations of six economic corridors (i.e, the BCIMEC, CCAWAEC, CIPEC, CMREC, CPEC, and NECB) in the BRI region. As the Maldives lacks transportation data, only 64 countries are included in the upcoming analysis.

3 Methodology

3.1 Gridded socioeconomic development index (GSDI)

According to sustainable development theory, location theory, critical minimum affect theory, and the big-push theory (Pearce and Atkinson, 1993; Isard, 1954; Rosenstein, 1961), we suggest that regional socioeconomic development condition concerns not only income but also residential living standards, local transportation and infrastructure conditions, and modernization processes (You et al., 2020). Therefore, our proposed GSDI integrates indicators such as the Human Development Index (HDI), a Global Transportation Accessibility Index (GTAI), and an Urban Modernization Index (UMI). However, since the length ratio method is sensitive to some extreme values (You et al., 2020), we establish a three-dimensional model based on volume ratio to calculate GSDI. The workflow is depicted in Figure 2, which also illustrates that the GSDI value is the normalized ratio of the volume of the red cube to the importance of the ideal (black) cube, then multiplied by 100.
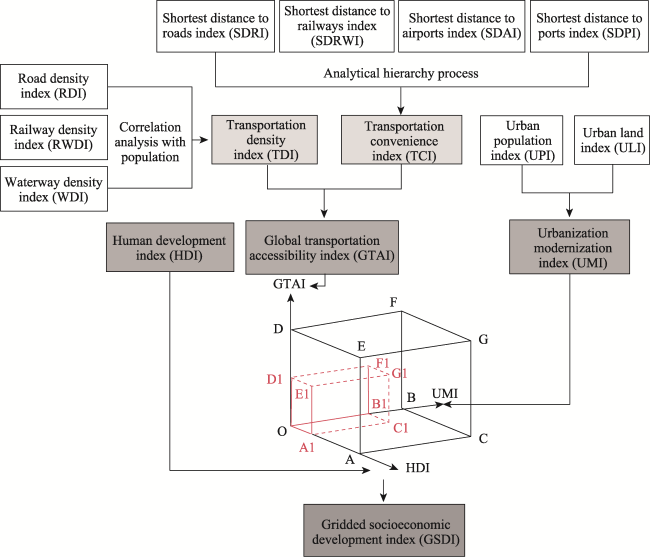
Figure 2 Schematic of the GSDI model

3.1.1 GSDI dimension 1: Human Development Index (HDI)

The HDI has been widely used to evaluate the socioeconomic development levels of countries (Singariya, 2014; Wong et al., 2017). It comprises three sub-indices: life expectancy, education index, and GNI per capita (UNDP, 1990). Because the UNDP usually reports country-level HDI, which is not beneficial to spatial analysis, Kummu et al. (2018) established a 10 km2 resolution gridded global dataset for the HDI based on sub-national data from the UNDP Human Development Report. Since only a few countries were missing data, an almost complete global dataset based on the old calculation in 2009 was applied. The entire dataset spans 25 years, from 1990 to 2015, and the 2015 dataset of the gridded HDI was used in this study.

3.1.2 GSDI dimension 2: Global Transportation Accessibility Index (GTAI)

Feng et al. (2009) and Shi et al. (2019) reported that traffic conditions are an essential consideration when evaluating a region’s infrastructure level, while Feng et al. (2009) also regarded infrastructure development as a critical indicator for assessing the local socioeconomic situation. This study aggregates seven variables to generate the GTAI (see Figure 2).
Specifically, the GTAI includes two main sub-indices that are assigned the same weights. Firstly, the transportation density index, consisting of the aggregation of the road density (RDI), railway density (RWDI), and waterway density (WDI). Since various transportation modes may contribute differently to accessibility in different countries, correlation analysis was performed to probe the connection between the population and three transportation den-sity variables for each country (RDI, RWDI, and WDI). The weights were based on the Pearson correlation coefficient (see Section 3.2 in Shi et al. (2019)). Secondly, the transportation convenience index is a combination of normalized shortest distances from each grid cell to roads (SDRI), railways (SDRWI), airports (SDAI), and ports (SDPI). The process is given below:
After discussion with experts and regional investigations, the SDRI, SDRWI, SDAI, and SDPI were variables impacting transportation accessibility. Hence, we created a matrix of pairwise comparisons for those four indicators and then computed its eigenvector, maximum eigenvalue, and consistency ratio. Additional details are given in Shi et al. (2019).

3.1.3 GSDI dimension 3: Urban Modernization Index (UMI)

Urbanization is widely used for measuring the modernization process, typically combining two elements, i.e., urban land and urban population. Although we could easily acquire land cover data for 2015 from the European Space Agency and calculate the urban land rate using ArcGIS 10.X, several steps are required to obtain the gridded urban population rate. First, we collected the reported urban population for each country from the World Bank. Next, considering the close relationship between urban activities and nighttime lights (Amaral et al., 2006; Savory et al., 2017), we downloaded DMSP/OLS Nighttime Lights (NTL) data from the Earth Observation Group. We then conducted a correlation analysis to test the connection between NTL and the urban population.
Since China has a large area with uneven development, we chose it as a pilot site to test this correlation. Specifically, we extracted county-level urban population data from the 2010 census in China, calculated the sum of digital number (DN) values for each county based on the NTL data for the same year, and used correlation analysis to test their association. The result shows a strong positive relationship between DN values and the urban population, with a correlation coefficient of 0.87. This justifies using NTL data as a proxy for the gridded urban population. The formula can be expressed as follows:
\[U{{P}_{i}}=\frac{D{{N}_{i}}}{\sum\nolimits_{i=1}^{n}{D{{N}_{i}}}}\times TU{{P}_{j}}\] i=1, 2,..., n; j=1, 2,..., 65
where UPi is the urban population of grid cell i, DNi represents the DN value of grid cell i, TUPj is the total urban population of country j, and n is the number of grid cells in that country. Although the DMSP/OLS NTL data were last updated in 2013, it is safe to assume that the urban population distribution has changed little over the following 2 years. Therefore, we used NTL data from 2013 and World Bank urban population statistics from 2015 to obtain gridded urban population data. After that, LandScan population data for 2015 were used to calculate the urban population rate.

3.2 Economic corridor development index (ECDI)

To quantify the development state of economic corridors, we built an ECDI based on the GSDI using a CV-based classification approach (see Figure 3). The CV measures the dispersion of a probability or frequency distribution, which is widely used to determine the degree of data dispersion (Brown, 1998; Reed et al., 2002). It is computed as the standard deviation divided by the mean, generally expressed as a percentage (Abdi, 2010). The formulas can be defined as follows:
$CV=\frac{STD}{\overline{x}}\times 100%\]$,
$STD=\sqrt{\frac{1}{n-1}\sum\nolimits_{i=1}^{n}{{{({{x}_{i}}-\bar{x})}^{2}}}}$,
where CV denotes the coefficient of variation, STD is the standard deviation, {x1, x2, …, xn} are the GSDI values of the selected pixels, $\bar{x}$ indicates the mean GSDI value of these pixels, and n is the number of selected pixels. If the CV value is larger than 15%, the data may be abnormal and have a high degree of dispersion (Runlong, 2010).
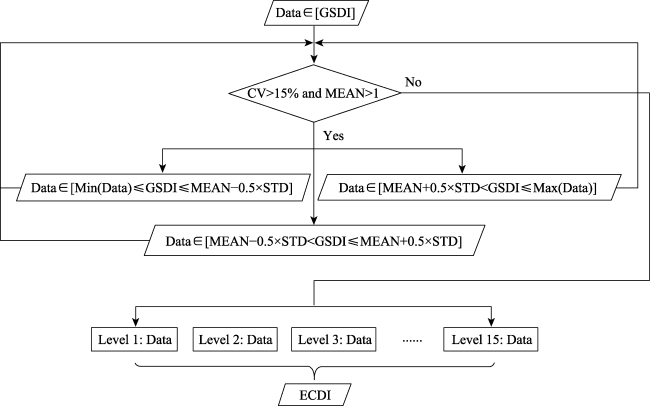
Figure 3 Flow chart of the establishment of the ECDI using a CV-based classification method
In light of this, we developed a classification method to determine socioeconomic development levels in the BRI regions. Since a mean value close to zero would result in an inflated CV value, we included the mean and CV values together (see Figure 3). If the CV value is larger than 15% and the mean value is larger than 1, the data will be regarded as dispersed and then divided into three groups. The data in the first group are less than or equal to the MEAN - (0.5 × STD), the data in the second group are between MEAN - (0.5 × STD) and MEAN + (0.5 × STD), and the data in the third group are larger than MEAN + (0.5 × STD). The dispersion of data in each group will then be determined by CV and mean values again until their data meet the above conditions (15 levels are generated for this study). Table 1 contains statistics for each of the 15 levels of socioeconomic development.
Table 1 Statistics on 15 levels of socioeconomic development
Level Mean STD CV (%) Level Mean STD CV (%)
1 0.00 0.01 898.08 9 9.09 0.50 5.49
2 0.93 0.46 49.73 10 13.00 1.79 13.81
3 2.01 0.15 7.35 11 19.10 1.70 8.92
4 2.48 0.12 4.81 12 24.43 1.42 5.81
5 2.96 0.16 5.33 13 30.14 1.68 5.58
6 4.21 0.57 13.48 14 39.43 2.98 7.55
7 6.01 0.48 7.92 15 48.98 4.98 10.16
8 7.53 0.39 5.22
To accurately evaluate the development status of six economic corridors, we first converted line representations (layers) of economic corridors into point layers with an interval of 5 km between every two points, then created a 100-km buffer for each point, within which the highest SDI level value was captured to represent the development level of local economic corridors. Finally, the ECDI was created to quantify the development levels of six economic corridors using the following equation:
$ECD{{I}_{n}}=\sum\limits_{i=1}^{j}{({{p}_{i}}}\times \text{ }i)$,
where ECDIn denotes the ECDI of nth economic corridor, j is the number of development levels, equal to 15 in this study. pi represents the corresponding percentage of points at each ith level.

4 Results

4.1 Spatial distribution of socioeconomic development in the BRI regions

Figure 4 shows the distribution of GSDI in the BRI regions. On the whole, socioeconomic development is uneven in these areas. Specifically, regions with relatively high socioeconomic development are chiefly located in western Russia (e.g., Moscow and Saint Petersburg), Central and Eastern Europe (e.g., France, Germany, and Italy), and eastern China (e.g., the Beijing-Tianjin-Hebei region, Yangtze River Delta, and the Pearl River Delta). Residents in these areas are more likely to receive education, have access to medical care, earn high salaries, and enjoy high accessibility and modernization (Shi et al., 2018). By contrast, citizens living in underdeveloped countries (e.g., Yemen, Oman, and Laos—grossly consistent with the UN Least Developed Countries), Central Asia, and the Far East generally experience low living standards, inadequate transportation facilities, and slow urbanization.
Figure 4 Spatial distribution of socioeconomic development levels in the BRI regions
To further explore the distribution characteristics of GSDI, we drew a socioeconomic dividing line based on the first-level and second-level administrative boundaries of BRI countries. The BRI regions can be roughly divided into two parts, i.e., offshore (or Part A) and inland (Part B). The Part A areas are mainly located in western Russia, Central and Eastern Europe, West Asia and the Middle East, Southeast Asia, South Asia, and eastern China (Figure 4), all characterized by a humid and warm climate; the areas in Part B are mainly located in eastern Russia, Central Asia, Mongolia, and western China, which tend to be dry and cold. Although Part A and Part B are similar in size (around 25 million km2), their population and mean GSDI are dramatically different (Table 2). Specifically, 95.14% of people in BRI countries live in Part A, or offshore areas, with a population density of 164.75 person/km2, while only 4.86% live in Part B or inland regions. Moreover, the mean GSDI of Part A is about seven times that of Part B.
Table 2 Land and population statistics of the offshore (Part A) and inland (Part B) parts on either side of the socioeconomic dividing line
Land Population GSDI
Area (million km2) Proportion (%) Number (million) Proportion (%) Density (person/km2) Mean
Part A 25.54 50.54 4207.78 95.14 164.75 14.22
Part B 25.00 49.46 214.79 4.86 8.59 2.08

4.2 Classification of socioeconomic development in the BRI regions

For in-depth analysis of the distribution characteristics of GSDI and accurate assessment of the developmental status of economic corridors, we applied a classification method based on the CV to identify regional socioeconomic development levels in BRI countries (Figure 5). Moreover, Table 3 compares the natural conditions and population density under different socioeconomic levels.
Figure 5 Spatial distribution of 15 levels of GSDI in the BRI regions
Table 3 Statistics for different socioeconomic development regions
Category and Level GSDI DEM (m) Annual mean temperature
(℃)
Land Population
Proportion
(%)
Proportion
(%)
Density
(person/km2)
Low socioeconomic development regions 1 0.00 860.52 3.94 72.76 9.90 12
Total 0.00 860.52 3.94 72.76 9.90 12
Middle-low socioeconomic development regions 2 0.93 447.45 18.77 1.00 5.30 464
3 2.01 473.86 18.39 0.28 1.33 418
4 2.48 459.90 18.16 0.22 1.05 415
5 2.96 477.07 17.64 0.27 1.20 392
Total 1.60 457.57 18.47 1.77 8.88 439
Middle socioeconomic development regions 6 4.21 475.62 17.57 0.93 4.54 429
7 6.01 447.86 17.40 0.71 3.94 484
8 7.53 459.65 16.94 0.57 3.54 542
9 9.09 453.30 16.88 0.70 4.13 514
Total 6.48 460.35 17.24 2.91 16.15 485
Middle-high socioeconomic development regions 10 13.00 436.97 16.71 2.54 18.70 644
11 19.10 418.53 16.52 2.19 14.24 568
12 24.43 427.70 16.35 1.69 8.93 463
Total 18.09 428.24 16.55 6.42 41.87 570
High socioeconomic development regions 13 30.14 510.93 15.79 2.11 6.93 288
14 39.43 463.35 10.61 7.18 9.42 115
15 48.98 439.14 10.67 6.85 6.84 87
Total 42.27 460.27 11.40 16.14 23.19 126
(1) Low socioeconomic development regions are mainly located inside the socioeconomic dividing line (Part B), including eastern Russia, Central Asia, Mongolia, and western China. Their GSDI values range from 0 to 0.23, and they all fall within one level. Even though these regions occupy more than 70% of the total BRI area, they are home to less than one in ten people, thus having the lowest population density among all categories (12 person/km2). This is mostly because much of their land is alpine and characterized by harsh natural conditions (with a mean elevation of 860.52 m and annual mean temperature of less than 4 ℃), making them unsuitable for human habitation (You et al., 2020).
(2) Middle-low socioeconomic development regions are mainly located in eastern India and central China, with GSDI values between 0.23 and 3.23. These regions (with a mean elevation of 457.57 m and annual mean temperature less than 18.5 ℃) are barely influenced by the natural environment. They account for 1.77% and 8.88% of the BRI area and population, respectively, and include four levels. Specifically, the second level, whose mean value of GSDI is 0.93, accounts for the largest area and population, with a high population density of 464 person/km2. In comparison, regions in the third, fourth, and fifth levels are much smaller and have lower population densities. Most regions with relatively low GSDI in this category are located in densely populated parts of India or China.
(3) Middle socioeconomic development regions cover an area of 1.47 million km2, scattered across eastern Russia, northern India, and central and eastern China. Their GSDI values range from 4.21 to 8.23 and have a relatively high mean population density of 485 person/km2. These regions can be subdivided into four levels. Unlike in the middle-low socioeconomic development regions, a positive relationship is observed between socioeconomic development status and population density at all four levels, consistent with the common knowledge that high economic development regions are more likely to attract population.
(4) Middle-high socioeconomic development regions are scattered across eastern Russia, Central and Eastern Europe, India, and eastern China, with a mean GSDI value of 18.09 (about three times that of middle socioeconomic development regions) and a mean population density of 570 person/km2. There are three levels within this category. The mean population density peaks at 644 person/km2 in the 10th level but is smaller in the 11th and 12th levels. This pattern is mostly due to central and eastern European regions having relatively high socioeconomic development but smaller populations than China and India.
(5) High socioeconomic development regions have the second largest area (8.16 million km2). They are chiefly distributed in western Russia, Central and Eastern Europe, New Delhi, and eastern China (particularly the Beijing-Tianjin-Hebei region, Yangtze River Delta, and Pearl River Delta). Even though their GSDI values are high, the mean population density in these regions is only 126 person/km2, less than a quarter of the mean value for middle-high socioeconomic development regions. The 15th level, which contains regions with the highest socioeconomic levels, has a mean population density of 87 person/km2. Most regions in this category are located in western Russia and Central and Eastern Europe, which are generally sparsely populated.

4.3 Evaluation of the development levels of six economic corridors

The progression of economic corridors in BRI regions has been mapped in Figure 6, and the corresponding proportion of each level of corridors and the ECDI are presented in Table 4. The development index is the sum of the products of levels (from 1 to 15) and corresponding percentages.
Figure 6 Spatial distribution of development levels of six economic corridors
Table 4 Percentage of each development level for six economic corridors
Economic corridors Percentage of each development level based on the GSDI (%) ECDI
1 8 10 11 12 13 14 15
BCIMEC 0.00 0.00 0.69 10.65 14.35 31.94 35.88 6.48 13.11
CCAWAEC 0.00 0.00 0.00 0.00 0.00 0.00 14.30 85.70 14.86
CIPEC 0.00 0.00 0.00 0.46 5.47 2.13 35.26 56.69 14.42
CMREC 0.00 0.00 0.00 0.00 0.00 0.00 2.06 97.94 14.98
CPEC 1.77 0.29 5.31 18.88 8.26 17.40 28.32 19.76 12.83
NECB 0.00 0.00 0.00 0.00 0.00 2.06 9.36 88.58 14.87
Total 0.10 0.02 0.36 1.92 2.14 4.08 13.10 78.29 14.61
On the whole, about 78.29% of regions along six economic corridors are well-developed, with a whole development index of 14.61. The CMREC, NECB, and CCAWAEC have the highest development indexes (Figure 6), 14.98, 14.87, and 14.86, respectively, although a small part of the NECB is marked by yellow or orange due to the backward areas in the northwestern region of China. This is chiefly due to the stable political atmosphere among China, Mongolia, and Russia, the construction of the NECB beginning in 1992, and the deepening of bilateral relations among the CCAWAEC countries. Nevertheless, we can also observe that the BCIMEC and the CPEC are relatively underdeveloped compared to other economic corridors.
The CPEC is the corridor with the lowest development index (12.83), within which about 1.77% belonged to the 1st level (around Kashmir), and only 19.76% were classified as 15th level (Table 3). This is chiefly because the geopolitical environment is unstable along the CPEC, and various international, regional, ethnic, religious, and other factors are intertwined, which may trigger interference activities, hence affecting the construction of corridors. In addition, the border areas between China and Pakistan exist under poor natural conditions, increasing the construction difficulty and resulting in high infrastructure costs.
For the BCIMEC, only 6.48% of the parts are divided into the highest level (15th), and 25.69% belong to middle-high socioeconomic development regions, mainly located in the southeastern part of India (Figure 6). This is mainly attributed to fairly inadequate transportation infrastructure and intense competition between Bangladesh, India, and Myanmar. The conflicts of their interests appear to slow down the BCIMEC development somehow, as evidenced by a development index of only 13.11.
In addition, the establishment of the CIPEC was proposed in 2015, later than that of other economic corridors, which partially explains why the development index of CIPEC (14.42) is lower than CMREC, NECB, or CCAWAEC. Furthermore, mainland Southeast Asia Peninsula is a “broken zone” of the world. The disagreement of political systems, economic development interests, and ethnic customs in these countries may hinder the local import or export trades. At the same time, it is a battlefield for geopolitical and economic powers from outside the region. From a spatial perspective, the CIPEC in parts of Laos, Cambodia, and Vietnam is less developed than in Thailand. Therefore, it makes sense that Thailand has a prosperous tourism industry compared to the other three countries, which grossly stimulates local economic development.

5 Conclusion

This study proposes an innovative method to quantify the socioeconomic development status and the progress of economic corridors. Compared with existing measurement methods of vector data, our approach is interdisciplinary and integrates multi-source data, including statistical data, geographic data, and remotely-sensed data. Using raster data overcomes the limitation of administrative boundaries, thereby presenting results at a finer level of detail. This approach allows us to offer specific policy suggestions for better BRI investment and construction.
The BRI socioeconomic dividing line illustrates the spatial heterogeneity of GSDI distribution in the BRI regions. It separates the BRI regions into two parts of roughly equivalent area that house hugely different shares of the population, with less than 5% living in the inland areas (Part B) and more than 95% living in the offshore regions (Part A). This finding also reflects the significance and reliability of this dividing line, which might provide some information for future BRI-related policies.
To quantitatively evaluate the development situation of six economic corridors, we further developed a CV-based classification method. The classification results suggest that nearly three-quarters of the total BRI area have low socioeconomic development. These areas are mainly located in eastern Russia, Central Asia, Mongolia, and western China, where many of these regions suffer from high elevation and low temperatures. Meanwhile, over 16% of the total BRI area has high socioeconomic development, characterized by high living standards, extensive urbanization, and excellent infrastructure. These regions tend to be distributed in European countries and eastern China. Only about 10% of the total BRI area is classified in the middle-low, middle, or middle-high levels of socioeconomic development, implying severe polarization among the BRI regions. Our classification results are broadly similar to the spatial distribution of tourism industries, urbanization, and developmental levels from previous research efforts (Suocheng et al., 2015; Liu et al., 2018; You et al., 2020).
Regarding the development status of economic corridors, the CMREC, NECB, and CCAWAEC are more developed, which is partly explained by a stable political environment, long-running cooperation, or a favorable trading atmosphere. Nonetheless, it is worth noting that some nodes of BCIMEC, CPEC, and CIPEC still need investment in infrastructure. In comparison, the BCIMEC is less developed, potentially because China is challenged with cultural exchanges, and infrastructure construction has been slow. Given this inference, the governments involved should seek to strengthen political trust, build border economic zones, further develop the textile and garment industries, and give full consideration to the advantages of their large populations. Furthermore, the CPEC seems underdeveloped, but it has strong development potential because mutual political trust is high. We recommend strengthening the connection between western China and Pakistan within this context by constructing roads, railways, ports, and especially energy infrastructure. Last but not least, although some nodes of CIPEC (like Laos, Cambodia, and Vietnam) are lesser developed, those regions are covered by the China-Association of Southeast Asian Nations Free Trade Area and demonstrate strong potential. Under this circumstance, it is most important to standardize trade rules, to leverage the China-Laos Railway, to ensure the continuation of the Rubber-Rice Pact for the promotion of the rubber and rice industries, and strengthen investments in transportation, water irrigation, water, and power supply facilities in those countries as they are holding different standards towards imports and exports and suffering from poor infrastructure.
Considering the large scale of our study, gridded data with a 10 km2 resolution were used to determine regional socioeconomic development levels in the BRI regions. Since our index was constructed using raster data, its resolution can be adjusted to satisfy research requirements in the future. For instance, higher-resolution data could be used to examine one economic corridor in the future, such as the BCIMEC or the CIPEC.
[1]
Abdi H, 2010. Coefficient of variation. Encyclopedia of Research Design, 1: 169-171.

[2]
Ali T, Ali W, Ali M, et al. 2018. China-Pak Economic Corridor (CPEC): Economic transformation-challenges and opportunities for the local residents. Journal of South Asian Studies, 4(1): 17-30.

[3]
Amaral S, Monteiro A M, Câmara G, et al. 2006. DMSP/OLS night-time light imagery for urban population estimates in the Brazilian Amazon. International Journal of Remote Sensing, 27(5): 855-870.

DOI

[4]
Arkhangel'skii Y S, 2009. Vertical balanced forecasting of the Ukrainian economy’s GDP. Studies on Russian Economic Development, 20(2): 198-205.

DOI

[5]
Ascensão F, Fahrig L, Clevenger A P, et al. 2018. Environmental challenges for the Belt and Road Initiative. Nature Sustainability, 1(5): 206-209.

DOI

[6]
Battamo A Y, Varis O, Sun P, et al. 2021. Mapping socio-ecological resilience along the seven economic corridors of the Belt and Road Initiative. Journal of Cleaner Production, 309: 127341.

DOI

[7]
Bian J, Li A, Nan X, et al. 2021. Dataset of the mountain green cover index (SDG15. 4.2) over the economic corridors of the Belt and Road Initiative for 2010-2019. Big Earth Data,1-13.

[8]
Brown C E, 2012. Applied Multivariate Statistics in Geohydrology and Related Sciences. Springer Science & Business Media.

[9]
Bryant C, White L G, 2019. Managing Development in the Third World. Routledge.

[10]
Calabrese L, Cao Y, 2021. Managing the Belt and Road: Agency and development in Cambodia and Myanmar. World Development, 141: 105297.

DOI

[11]
Carrai M A, 2021. Adaptive governance along Chinese-financed BRI railroad megaprojects in East Africa. World Development, 141: 105388.

DOI

[12]
Castaneda B E, 1999. An index of sustainable economic welfare (ISEW) for Chile. Ecological Economics, 28(2): 231-244.

DOI

[13]
Chaaban J, Irani A, Khoury A, 2016. The composite global well-being index (CGWBI): A new multi-dimensional measure of human development. Social Indicators Research, 129(1): 465-487.

DOI

[14]
Daly H, Cobb J, 1989. For The Common Good. Boston, MA: Beacon Press, 534pp.

[15]
Li D R, Yu H, Li X, 2017. The spatial-temporal pattern analysis of city development in countries along the Belt and Road Initiative based on nighttime light data. Geomatics & Information Science of Wuhan University, 42(6): 711-720. (in Chinese)

[16]
Eren M, Celik A K, Kubat A, 2014. Determinants of the levels of development based on the human development index: A comparison of regression models for limited dependent variables. Review European Studies, 6 (1): 11-20.

[17]
Fan Z, Li S, Fang H, 2021. Explicating the mechanisms of land cover change in the New Eurasian Continental Bridge Economic Corridor region in the 21st century. Journal of Geographical Sciences, 31(10): 1403-1418.

DOI

[18]
Feng Z M, Liu D, Yang Y Z, 2009. Evaluation of transportation ability of China: From county to province level. Geographical Research, 28(2): 419-429.

DOI

[19]
Fischer J, 2021. Making the UN decade on ecosystem restoration a social-ecological endeavour. Trends in Ecology & Evolution, 36(1): 20-28.

DOI

[20]
Gormely P J, 1995. The Human Development Index in 1994: Impact of income on country rank. Journal of Economic and Social Measurement, 21(4): 253-267.

DOI

[21]
Han M, Yao Q, Liu W, et al. 2018. Tracking embodied carbon flows in the Belt and Road regions. Journal of Geographical Sciences, 28(9): 1263-1274.

DOI

[22]
Harrison P, 1997. Population and sustainable development: Five years after Rio. New York, United Nations Population Fund UNFPA, 26(4): 435-438.

[23]
Shi H, He Q, Zhang W, 2018. Spatial factor analysis for aerosol optical depth in metropolises in China with regard to spatial heterogeneity. Atmosphere, 9(4): 156.

DOI

[24]
Shi H, You Z, Feng Z, et al. 2019. Numerical simulation and spatial distribution of transportation accessibility in the regions involved in the belt and road initiative. Sustainability, 11(22): 6187.

DOI

[25]
Isard W, 1954. Location theory and trade theory: Short-run analysis. The Quarterly Journal of Economics, 305-320.

[26]
Karim M A, Islam F, 2018. Bangladesh-China-India-Myanmar (BCIM) Economic Corridor: Challenges and Prospects.

[27]
Kummu M, Taka M, Guillaume J H, 2018. Gridded global datasets for gross domestic product and Human Development Index over 1990-2015. Scientific Data, 5(1): 1-15.

DOI

[28]
Le G J, Ertur C, 2003. Exploratory spatial data analysis of the distribution of regional per capita GDP in Europe, 1980-1995. Papers in Regional Science, 82(2): 175-201.

DOI

[29]
Lélé S M, 1991. Sustainable development: A critical review. World Development, 19(6): 607-621.

DOI

[30]
Liu H, Fang C, Miao Y, et al. 2018. Spatio-temporal evolution of population and urbanization in the countries along the Belt and Road 1950-2050. Journal of Geographical Sciences, 28(7): 919-936.

DOI

[31]
Liu W, Zhang Y, Xiong W, 2020. Financing the Belt and Road Initiative. Eurasian Geography and Economics, 61(2): 137-145.

DOI

[32]
Liu W D, 2019. Joint Construction of Green Silk Roads. Beijing: The Commercial Press, 34-167.

[33]
Liu Z, Wang T, Sonn J W, et al. 2018. The structure and evolution of trade relations between countries along the Belt and Road. Journal of Geographical Sciences, 28(9): 1233-1248.

DOI

[34]
Mazumdar K, 2003. A new approach to human development index. Review of Social Economy, 61(4): 535-549.

DOI

[35]
Mujtaba B G, Williamson P, Cavico F J, et al. 2013. Managing the link between bribery and wealth based on corruption perception index (CPI) and gross national product (GNP) per capita. Journal of Management Policy and Practice, 14(3): 100-115.

[36]
Noorbakhsh F, 1998. A modified human development index. World Development, 26(3): 517-528.

DOI

[37]
Pearce D W, Atkinson G D, 1993. Capital theory and the measurement of sustainable development: An indicator of “weak” sustainability. Ecological Economics, 8(2): 103-108.

DOI

[38]
Reed G F, Lynn F, Meade B D, 2002. Use of coefficient of variation in assessing variability of quantitative assays. Clinical and Vaccine Immunology, 9(6): 1235-1239.

DOI

[39]
Rippa A, 2020. Mapping the margins of China’s global ambitions: Economic corridors, Silk Roads, and the end of proximity in the borderlands. Eurasian Geography and Economics, 61(1): 55-76.

DOI

[40]
Rosenstein R P N, 1961. Notes on the theory of the ‘big push’. In: Economic Development for Latin America. London: Palgrave Macmillan, 57-81.

[41]
Runlong H, 2010. Statistical Analysis of Data:Principles and Applications of SPSS. Beijing: Higher Education Press.

[42]
Sanusi Y A, 2008. Application of human development index to measurement of deprivations among urban households in Minna, Nigeria. Habitat International, 32(3): 384-398.

DOI

[43]
Savory D J, Andrade P R, Gething P W, et al. 2017. Intercalibration and Gaussian process modeling of nighttime lights imagery for measuring urbanization trends in Africa 2000-2013. Remote Sensing, 9(7): 713.

DOI

[44]
Schindler S, Bayirbağ M K, Gao B, 2021. Incorporating the Istanbul-Ankara high-speed railway into the Belt and Road Initiative: Negotiation, institutional alignment and regional development. Journal of Geographical Sciences, 31(5): 747-762.

DOI

[45]
Shrestha M B, 2017. Cooperation on finance between china and Nepal: Belt and road initiatives and investment opportunities in Nepal. The Journal of Finance and Data Science, 3(1-4): 31-37.

DOI

[46]
Singariya M R, 2014. Socioeconomic determinants of human development index in India. Management and Administrative Sciences Review, 3(1): 69-84.

[47]
Solár J, Janiga M, Markuljaková K, 2016. The socioeconomic and environmental effects of sustainable development in the Eastern Carpathians, and protecting its environment. Polish Journal of Environmental Studies, 25(1): 291-300.

DOI

[48]
Song Z, Che S, Yang Y, 2018. The trade network of the Belt and Road Initiative and its topological relationship to the global trade network. Journal of Geographical Sciences, 28(9): 1249-1262.

DOI

[49]
Spangenberg J H, 2016. The Corporate Human Development Index (CHDI): A tool for corporate social sustainability management and reporting. Journal of Cleaner Production, 134: 414-424.

DOI

[50]
Srinivasan T N, 1994. Human development: A new paradigm or reinvention of the wheel? The American Economic Review, 84(2): 238-243.

[51]
Taewoo L P, Sungwoo L, Zhihua H, et al. 2018. Promoting Korean international trade in the east sea economic rim in the context of the belt and road initiative. Journal of Korea Trade, 22(3): 212-227.

DOI

[52]
Tofallis C, 2013. An automatic-democratic approach to weight setting for the new human development index. Journal of Population Economics, 26(4): 1325-1345.

DOI

[53]
UNDP,1990. Human Development Report 1990, Published for the United Nations Development Programme ( UNDP). New York and Oxford: Oxford University Press.

[54]
United Nations (UN), 1954. Report on International Definition and Measurement of Standards and Levels of Living. New York: United Nations.

[55]
Wong M, Jiang J Y, Liang M, et al. 2017. Global temporal patterns of pancreatic cancer and association with socioeconomic development. Scientific Reports, 7(1): 1-9.

DOI

[56]
Yang H Y, 2000. A note on the causal relationship between energy and GDP in Taiwan. Energy Economics, 22(3): 309-317.

DOI

[57]
You Z, Shi H, Feng Z, et al. 2020. Creation and validation of a socioeconomic development index: A case study on the countries in the Belt and Road Initiative. Journal of Cleaner Production, 258: 120634.

DOI

[58]
Zhang C, Xiao C, Liu H, 2019. Spatial big data analysis of political risks along the Belt and Road. Sustainability, 11(8): 2216.

DOI

[59]
Zhang N, Liu Z, Zheng X, et al. 2017. Carbon footprint of China’s Belt and Road. Science, 357(6356): 1107.

DOI

[60]
Zhao J, Sun G, Webster C, 2022. Does China-Pakistan Economic Corridor improve connectivity in Pakistan? A protocol assessing the planned transport network infrastructure. Journal of Transport Geography, 100: 103327.

DOI

Outlines

/