Research Articles

Urbanization under globalization: How does the Belt and Road Initiative affect urbanization levels in participating countries

  • MA Haitao
Expand
  • Key Laboratory of Regional Sustainable Development Modeling, Institute of Geographic Sciences and Natural Resources Research, CAS, Beijing 100101, China

Ma Haitao (1979-), PhD and Associate Professor, specialized in urban geography and planning. E-mail:

Received date: 2022-05-06

  Accepted date: 2022-09-26

  Online published: 2022-11-25

Supported by

The Third Xinjiang Scientific Expedition Program(2021xjkk0905)

Strategic Priority Research Program of the CAS, Pan-Third Pole Environment Study for a Green Silk Road(XDA20040402)

Abstract

China’s Belt and Road Initiative (BRI) presents the world with a new era of inclusive globalization, which will shape urbanization patterns globally. This study considered the launch of BRI as a quasi-experiment, where we evaluated the BRI’s impact on urbanization by way of difference-in-differences (DID) and propensity score matching (PSM) methods. The results showed that the BRI exerted a significantly negative effect on urbanization in its first three years. Its positive effect emerged from the fifth year onwards, indicating that the BRI’s positive effect on urbanization required a period of practical experience. Heterogeneous analysis and placebo test were also conducted to verify the robustness of the model. The effects in low-income countries were revealed to have been much greater than in high-income countries, meaning the BRI had been conducive to promote local urban growth in underdeveloped economies. Finally, the geographical detector model was introduced to discuss the influencing mechanism of urbanization in BRI and non-BRI countries, showing external factors were the prominent driving forces in BRI countries, whereas internal drivers played an important role in non-BRI countries. Our findings indicated that the implementation of the BRI contributed to building global economic growth and supporting a shared future.

Cite this article

MA Haitao . Urbanization under globalization: How does the Belt and Road Initiative affect urbanization levels in participating countries[J]. Journal of Geographical Sciences, 2022 , 32(11) : 2170 -2188 . DOI: 10.1007/s11442-022-2042-1

1 Introduction

As the primary processes influencing the physical environment and human activities in recent decades, globalization and urbanization have attracted widespread attention from scholars and policymakers (Lambin and Meyfroidt, 2011). Globalization is normally considered as a major driving force of urbanization (Pacione, 2009; Dijkstra et al., 2021). This may be attributed to the fact that FDI and international trades brought by globalization flow into the secondary and tertiary industries, which promotes the structural transition from agricultural to industrial production (Wu, 2003). Consequently, a large number of rural surplus labors migrate to cities due to the desire for urban life, such as better education and medical services. Besides, it is universally acknowledged that globalization would lead to specialization in production to make full use of comparative advantages of each country (Bougheas et al., 2000; Chen and Wu, 2017). Some firms, especially labor-intensive firms, gradually relocate their industries to reduce costs, thus fostering the development of urbanization in the recipient countries.
Historically, the globalization process can be divided into several stages—for instance, it could be posed that “Globalization 1.0” was characterized by imperial conquest for raw materials and “Globalization 2.0” was characterized by multinational corporations’ search for markets and labor. And “Globalization 3.0” might be located which would strive towards the creation of balanced development around the world (Friedman, 2005). Though the globalization is periodized, it is clear that the globalization process has historically been inherently uneven and leveraged by Western countries, especially the United States. Further, the dominance of certain countries has generated a range of economic and political inequalities at regional levels (Sun et al., 2020; Razzaq et al., 2021). Despite the considerable economic growth caused by globalization, developing countries face various problems like the erosion of sovereignty and income inequality, as they remain at the lower end of industrial and value chains (Gollin et al., 2016; Ma and Sun, 2020; Munck, 2021). Many underdeveloped regions are trapped by environment pollution, and the gap between developing and developed countries continues to widen. The United States has been retreated from the Trans-Pacific Partnership in last few decades, and Brexit revealed a big step back from Western-dominated globalization. Inequalities among countries and retreats of Western countries cast a gloom over global governance. Therefore, it is essential for seeking a new sustainable development model.
Differ from the Western countries’ retreats, China as a larger developing country and a major economy in the world, has gradually stepped to the front of global governance while obtaining considerable benefits from globalization. The Belt and Road Initiative (BRI) proposed by China in late 2013 aims to establish commercial and cultural links with other countries and regions, which marks a new inclusive phase in globalization (Liu and Dunford, 2016). The implementation of BRI indicates China has taken responsibility for revitalizing global economic growth to counter the challenges of globalization. More than 60 countries locate at the Silk Road, covering 39% of global land area and accommodating 62% of the world’s population, while accounting for one-third of the global GDP (Lindberg and Biddulph, 2021). Infrastructure acts as a bridge between different regions that is capable for reducing barriers and promoting exchange (Huntington, 1993; Anastasiadou, 2019; Chen and Lin, 2020). Many countries along BRI are underdeveloped with poor logistical infrastructure, which has become a major limitation in trades and economic development. For this reason, there exists a strong demand for international channels in these areas, which in turn would bring employment opportunities, productivity growth, technology innovation, international trade, and economic development to them (Li et al., 2019; Sidaway et al., 2020; Razzaq et al., 2021). The BRI project involves the infrastructure construction, including logistics systems, highways, railway tracks, harbors, airports, and gas pipelines in order to establish trade corridors and strengthen investment facilitation along the route. All these activities are expected to greatly reduce costs of time and distance among countries, and exert profound influences on international cooperation and economic development by boosting FDI and export, which contributes to the pace of urbanization (Tian and Li, 2019).
According to “The World Cities Report” published by UN-Habitat (2020), 56.2% of the world’s population was urban population, and it is expected to increase to 60.4% by 2030. The report suggests the global urbanization process will continue at least in near future. Urbanization will not, however, be equally distributed: highly-urbanized regions are likely to witness a slowing urban growth while 96% of urban expansion in the world will be in Asia and Africa (Ghaffarpasand et al., 2021; Keleg et al., 2021). The BRI connects China, Central Asia, and West Asia, to Eastern Europe and African countries, covering a wide range of less developed countries who expect to be further urbanized. It is believed that the implementation of the BRI opens up a new globalization and urbanization path (Liu et al., 2018). The driving mechanism of the BRI can be interpreted from the following two aspects. The first is throng physical transport network. The expansion of infrastructures and the advancements of transportation technology have considerably reduced the travel costs of cross-border movements. Chen and Lin (2020) have shown the proliferation of transport networks has contributed about 27% increase in transnational investment from 2000 to 2012. They further predict the BRI would increase by 3% and 1% in BRI and non-BRI countries respectively via transportation spillovers. The second driver is virtual financial networks, mainly represented by trade and investment networks. According to Pan and Chong (2022), China’s FDI has promoted transnational economic activities in the BRI region through social network analysis. The outward FDI from China can be regarded as the source of knowledge and technology for the recipient countries, assuming cross-border investment complemented local labor to stimulate productivity growth (Gozgor and Kablamaci, 2015).
With the implementation of the BRI, a rich body of literature now exists in relation to the initiative. Studies have addressed the significance of the BRI from a range of perspectives, including those of bilateral trade (Yang and Lin, 2021), infrastructure construction (Li et al., 2018), energy consumption (Hussain et al., 2021), carbon emission (Bompard et al., 2022), and environmental efficiency (Hafeez et al., 2019). Besides, some scholars focused on economic effects after the launch of BRI (Enderwick, 2018; Cheng and Ge, 2020). Few studies have, however, paid attention to the impact of specific policies or agreements on urbanization, particularly not through the use of quantitative methods. The West’s retreats from globalization resulted in serious threats to international economic growth. China, as a large developing country, is responsible for global governance. It is imperative to measure the growing influence of globalization led by China. Whilst the BRI doubtless brings new opportunities for the countries involved in the project, it is unclear whether the BRI speeds up the pace of urbanization or slows it down. Previous studies mainly focus on the virtual financial connectivity of global production networks (Contractor et al., 2020), which ignores the physical links via transportation. The influences of China’s infrastructure-led globalization deserve more attention. To fill this gap in the existing knowledge, this paper investigates whether the BRI has increased urbanization levels in the countries of the BRI region, analyzing the driving mechanisms behind this effect.
The research design and main contributions of this study can be summarized as follows: First, the DID model was employed in order to estimate the BRI’s effect on urbanization levels, by comparing the differences before and after the implementation of the initiative. The difference-in-differences (DID) model is widely used to identify the “policy effect” by eliminating the effects of other unobservable factors, in order to solve endogenous problems. To further avoid sample selection bias, Heckman et al. (1997) combined the propensity score matching (PSM) with DID method to identify the interference of confounding factors. Therefore, the PSM-DID model was also employed to obtain the net effect of BRI on urbanization. Second, a heterogeneity analysis was performed to explore the varied influences of the BRI on urbanization. We divided the countries making up the study area according to their income level. Third, after examining the initiative’s effect, a placebo test was used to check the model robustness. This excluded the impact of other confounding factors on urbanization, thus proving the accuracy of estimation results. Our findings provide support for administrators working with the policy applications of urbanization, by revealing the differences among various countries.
We organize the remainder of the paper as follows. Section 2 describes the study area. A detailed description of the study’s methodology and the data used are also formulated in this section. Section 3 presents the empirical results of the study. The driving mechanism of urbanization is discussed in Section 4. Section 5 provides a summary of main conclusions and prospects of the research detailed in the paper.

2 Materials and methods

2.1 Study area

The term “Belt and Road” lies at the center of China’s new thinking about “open development”: “Belt” refers to the “Silk Road Economic Belt” and the “Road” refers to the “21st-Century Maritime Silk Road.” The overland route traced by the Belt and Road leads from China, via Central Asia, Russia, or West Asia, to the European countries of the West. The maritime route connects China’s coastal ports to the Mediterranean Sea and the Indian Ocean’s coast, through the South China Sea (Kong et al., 2021). The Belt and Road Initiative (BRI) is an open and inclusive initiative, which gives all countries who are interested in this project an opportunity to take participate. With the acknowledgment of the project’s achievements, the number of the countries participating in the BRI continues to grow. Referring to relevant studies, this paper focuses on the countries along the route at the very beginning of the initiative (these are herein referred to as “BRI countries”) (Liu et al., 2020; Muhammad et al., 2020; Fang et al., 2021; Jiang et al., 2021; Luo et al., 2022). The other countries of the world (i.e., non-BRI countries) formed the control group of the study. Due to the unavailability of some regions’ data, a total of 138 countries—58 countries along the route and 80 countries not affected by the BRI—were ultimately acquired in this study, and the list of countries is shown in Table 1.
Table 1 List of selected countries and their classifications of different income groups
Income groups Countries
Low-income Burkina-Faso, Ethiopia, Gambia, Madagascar, Mozambique, Rwanda, Sudan, Syria*, Uganda
Lower
middle-income
Algeria, Angola, Bangladesh*, Belize, Bhutan*, Bolivia, Cambodia*, Cape Verde, Djibouti, Egypt*, El Salvador, Ghana, Haiti, Honduras, India*, Indonesia*, Iran*, Ivory Coast, Kenya, Kyrgyzstan*, Laos*, Mongolia*, Morocco, Nepal*, Nicaragua, Nigeria, Pakistan*, Papua New Guinea, Philippines*, Sri Lanka*, Swaziland, Tajikistan*, Tanzania, Tunisia, Ukraine*,
Uzbekistan*, Vietnam*, Zambia, Zimbabwe
Upper
middle-income
Argentina, Albania*, Armenia*, Azerbaijan*, Belarus*, Bosnia and Herzegovina*, Botswana, Brazil, Bulgaria*, China*, Colombia, Costa Rica, Dominica, Ecuador, Georgia*, Guatemala, Guyana, Iraq*, Jamaica, Jordan*, Kazakhstan*, Lebanon*, Malaysia*, Mauritius, Mexico, Moldova*, Montenegro, Namibia, North Macedonia*, Panama, Paraguay, Peru, Romania*, Russia*, Serbia*, South Africa, Thailand*, Tonga, Turkey*
High-income Cyprus*, Czech Republic*, Denmark, Estonia*, Finland, France, Germany, Greece*, Hungary*, Iceland, Ireland, Israel*, Italy, Japan, Korea, Latvia*, Lithuania*, Luxembourg, Malta,
Netherlands, New Zealand, Norway, Oman*, Poland*, Portugal, Saudi Arabia*, Seychelles, Singapore*, Slovakia*, Slovenia*, Spain, Sweden, Switzerland, United Arab Emirates*,
United Kingdom, United States, Uruguay

Note: * means countries along the route at the very beginning of the initiative, that is, the BRI countries in this study.

2.2 Methods

2.2.1 Difference-in-differences

The implementation of the Belt and Road can be treated as a quasi-natural experiment (Jiang et al., 2021). The basic principle of DID is to calculate changes before and after an event (the BRI in this study) and to compare differences between a treatment group (BRI countries here) and a control group (non-BRI countries here) in a manner that can effectively eliminate the endogeneity caused by the presence of unobservable variables (Bardaka et al., 2019; Lin et al., 2021). The baseline model can be specified as:
${{y}_{it}}=\alpha +\gamma \cdot {{G}_{i}}+\delta \cdot {{D}_{t}}+\beta \cdot {{G}_{i}}\cdot {{D}_{t}}+\theta \cdot {{X}_{it}}+{{\varepsilon }_{it}}$
where yit refers to the outcome of the explained variable (urbanization level) of country i at time t. α is the regression constant. Dt is a dummy variable that indicates whether country i is along the BRI route. If a country belongs to the treatment group, its value is 1; otherwise, it belongs to the control group and its dummy variable equals 0. Dt is the dummy variable representing the time taken for policy implementation. Therefore, the dummy variable Dt equals 1 after the implementation of the BRI, and is 0 before the BRI. The coefficient of the interaction term Gi·Dt is a DID estimator, representing the effect of the BRI on urbanization. Xit is a vector of control variables and εit is a random error term.

2.2.2 Propensity score matching

The effects of a policy can be intricately interrelated, so estimating those effects can be difficult. Because it is difficult to generate results in the absence of policy implementation, the assumption of counterfactual results is risky (Hirota and Yunoue, 2017; Dai et al., 2020). Moreover, the characteristics of nonparticipants and participants might be different, which can lead to sample selection biases. The propensity score matching (PSM) method, proposed by Rosenbaum and Rubin (1983), is widely used to eliminate this limitation. The basic principle of the method is to find individuals in the control group who are as similar as possible to individuals in the treatment group in terms of their propensity scores, thereby ensuring the most appropriate comparison countries for counterfactual experiments are selected. The average treatment effect is evaluated by means of Eq. (2).
$AT{{T}_{PSM}}=\frac{1}{{{N}_{1}}}\underset{i=1}{\overset{{{N}_{1}}}{\mathop \sum }}\,\left\{ {{Y}_{i1}}-\underset{j=1}{\overset{{{N}_{0}}}{\mathop \sum }}\,W\left( i,j \right){{Y}_{j0}} \right\}$
where N1 and N0 denote the number of samples in the treatment and control group respectively. Yi1 represents the outcome variable of the treatment group, and Yj0 represents the outcome variable of the control group. W(i, j) is a weight assigned to the control group based on the propensity score.
PSM can reduce sample selection biases, but it cannot capture the bias caused by unobserved variables in the sample, which may in turn lead to endogenous problems. To further address this difficulty, Heckman et al. (1997) introduced the PSM-DID method to consider unobserved heterogeneity. The average effect of the BRI on urbanization is evaluated as follows:
$AT{{T}_{PSM-DID}}=\frac{1}{{{N}_{1}}}\underset{i=1}{\overset{{{N}_{1}}}{\mathop \sum }}\,\left\{ \left( Y_{i1}^{t1}-Y_{i1}^{t0} \right)-\underset{j=1}{\overset{{{N}_{0}}}{\mathop \sum }}\,W\left( i,j \right)\left( Y_{j0}^{t1}-Y_{j0}^{t0} \right) \right\}$
where $Y_{i1}^{t1}$ and $Y_{i1}^{t0}$ represent the outcome variable of the treatment group before and after the policy implementation respectively. $Y_{j0}^{t1}$ and $Y_{j0}^{t0}$ denote the outcome variable of the control group before and after the policy implementation respectively.

2.2.3 Geographical detector

The geographical detector is a relatively new technique to provide a global estimation for the pattern of spatially stratified heterogeneity; it does this by comparing the spatial heterogeneity of strata with its factors (Wang et al., 2010; Polykretis and Alexakis, 2021). This method can reveal the interpretive force of driving factors behind a phenomenon, without assuming the distribution. In this study, the factor detector and the interaction detector modules were employed in order to investigate the spatial driving factors of urbanization and their interaction effects.
(1) The factor detection module can be used to explore the interpretation degree of each explanatory variable with respect to the explained variable. The explanatory power of the driving factors is represented by the q-statistic.
$q=1-\frac{\mathop{\sum }_{h=1}^{L}{{N}_{h}}{{\sigma }_{h}}^{2}}{N{{\sigma }^{2}}}$
where q denotes the driving force of a given factor, with the value ranging from 0 to 1. The larger the q values, the stronger the explanatory power of driving factors and vice versa. h=1, 2, …, L is the classification of the independent variable. Nh and N are the number of units in subsample h and full sample. σ2h and σ2 are the variances of subsample h and full sample.
(2) The interaction detection module can identify the interactions of two explanatory variables (X1 and X2). By comparing the explanatory power of the two variables $\left( {{X}_{1}}\cap {{X}_{2}} \right)$ with the q value of each variable, this method can be used to identify the interactive influence between different factors. The type of interaction is normally defined in terms of the five categories shown in Table 2.
Table 2 Interaction types between two explanatory variables
Type Description Interaction
1 $q\left( {{X}_{1}}\cap {{X}_{2}} \right)<min\left( q\left( {{X}_{1}} \right),q\left( {{X}_{2}} \right) \right)$ Weaken, Nonlinear
2 $min\left( q\left( {{X}_{1}} \right),q\left( {{X}_{2}} \right) \right)<q\left( {{X}_{1}}\cap {{X}_{2}} \right)<max\left( q\left( {{X}_{1}} \right),q\left( {{X}_{2}} \right) \right)$ Weaken, Univariate
3 $max\left( q\left( {{X}_{1}} \right),q\left( {{X}_{2}} \right) \right)<q\left( {{X}_{1}}\cap {{X}_{2}} \right)<q\left( {{X}_{1}} \right)+q\left( {{X}_{2}} \right)$ Enhanced, Bivariate
4 $q\left( {{X}_{1}}\cap {{X}_{2}} \right)=q\left( {{X}_{1}} \right)+q\left( {{X}_{2}} \right)$ Independent
5 $q\left( {{X}_{1}}\cap {{X}_{2}} \right)>q\left( {{X}_{1}} \right)+q\left( {{X}_{2}} \right)$ Enhanced, Nonlinear

2.3 Data source and preprocessing

This study used a quasi-experimental method to explain the effects of BRI on urbanization. In 2015, the State Council of the People’s Republic of China issued the “Vision and Actions on Jointly Building the Silk Road Economic Belt and the 21st-Century Maritime Silk Road”. It is the first official Chinese government document on the BRI, which marks the entry of the BRI into the comprehensive promotion stage (Liu and Dunford, 2016; Kong et al., 2021). The sample period was selected as 2010-2020, wherein the years prior to 2015 were marked as pre-initiative years, while 2015 and after were treated as post-initiative years. An ex-ante parallel trend test could therefore be conducted to verify the impact of the initiative. The data for urbanization and its driving factors were collected from the World Bank (https://datacatalog.worldbank.org) and the United Nations (https://unstats.un.org) databases.

2.3.1 Explained variable

Urbanization was selected as the main explained variable that was used to investigate the BRI’s effects. The degree of urbanization is usually estimated by the proportion of urban population to total population (Fang and Yu, 2017; Dijkstra et al., 2021;). Urbanization reflects the process of population agglomeration in cities, which is strongly correlated with economic and social development.

2.3.2 Control variables

Economic development and urbanization levels vary markedly between countries; acknowledging this issue, we selected a number of relative indicators in order to, as far as possible, weaken the multicollinearity among countries. It is acknowledged that urbanization is a continuing and dynamic process because of the interaction of multi-internal driving factors (Hsieh, 2014; Ma and Sun, 2020). In the context of globalization and economic connections, the pace of urbanization in a region is also determined by talent, material, and capital flows outside the countries (Gollin et al., 2016). Inward and outward forces work mutually during the process of urbanization. That is to say, when the external forces are insufficient, the forces of internal factors would also be weak, and the pace of urbanization will be at standstill. Based on the existing literature and data availability, six variables operated in two dimensions were addressed in this study.
(1) External driving factors. Population, cargo, and capital flows are considered to constitute the extrinsic drivers that influence urbanization. Population is one of the most basic elements of urbanization, and we used the number of international inbound tourists to measure the population flow. With the pursuit of a good spirit, people with great intelligence and wealth from other regions would travel to new places. The development of tourist industry provides a large number of non-agricultural employment opportunities for domestic population, which in turn exerts effects on rural residents to urbanize for a higher salary and better life. The scale of goods and service exports was selected to represent the cargo flow. International trade commodities stimulate local markets and promote domestic goods and services to overseas markets, thus boosting economic development and driving urbanization. Because foreign direct investment flows are considered as an essential source of knowledge and innovative technology, capital flow was expressed by the net inflows of foreign direct investment. Cross-border investment is a vital factor in the context of globalization. Advanced equipment and sufficient capital embodied in outward FDI significantly promote the urbanization process. The relative indicators of cargo flow and capital flow were adapted by calculating their proportion in relation to GDP.
(2) Internal driving factors. Government, market, and technology are considered to be intrinsic drivers that influence urbanization. Government revenue and expenditure activities deeply impact the country’s economic development. The increasing fixed capital formation from government contributes to the construction of urban industry and infrastructure whilst accelerating urbanization. The proportion of gross fixed capital formation to GDP was adopted in this study so that it can represent the government factor. Market plays a decisive role in urban construction, and has big influence on national economic development and social stability. Because GDP might be affected by market shocks which are in turn generated by structural changes, GDP per capita was selected to provide a measure of the market factor. Finally, because technology supports creative activities, it can reflect a region’s scientific strength and core competitiveness. We used the number of patent applications per million people to express the technology factor.
The descriptive statistical results of the control variables are displayed in Table 3. Considering the great difference in the value of each variable, logarithmic processing was performed on the variables to eliminate the heteroskedasticity of the estimation model.
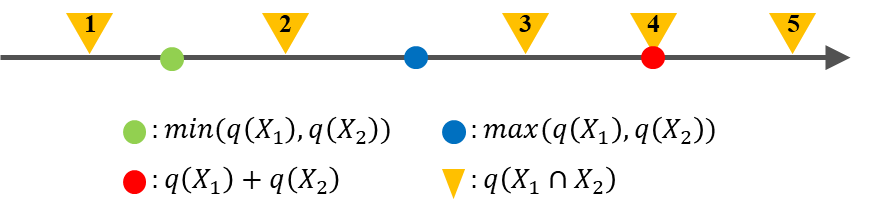
Table 3 Descriptive statistics of the control variables
Dimension Variable Definition Code Reference Mean Std. Dev.
External
drivers
Population flow International in-bound
tourists
x11 Bjarnason et al. (2021); Muhammad et al. (2020) 1.39E+7 2.99E+7
Cargo flow Exports of goods and
services (% of GDP)
x12 Inostroza and Zepp (2021); Yang and Hu (2019) 45.708 33.938
Capital flow Net inflows of foreign direct investment (% of GDP) x13 Contractor et al. (2020); Razzaq et al. (2021) 6.132 14.577
Internal
drivers
Government factor Gross fixed capital
formation (% of GDP)
x21 Arvin et al. (2021);
Li et al. (2018)
23.328 7.135
Market factor GDP per capita x22 Fu et al. (2020);
Wang and Li (2021)
16,629 20,993
Technology factor Patent applications
per million people
x23 Gyedu et al. (2021);
Smith and Thomas (2017)
202.567 512.237

3 Results

3.1 Impact of BRI on urbanization

3.1.1 Overall effects

The coefficients of dummy variable Gi were found to be negative and remained so when the control variables were added, demonstrating that the average urbanization level in the experimental group was lower than in the control group at the start of the implementation (Table 4). The coefficients of dummy variable Dt in models (1) and (2) were found to be positive and statistically significant at the 1% level, indicating that the urbanization level in all countries displayed an upward trend over time. The coefficient of interaction Gi·Dt is the key variable in the model: it reflects the net effect of the initiative. Compared with the non-BRI countries, urbanization in the countries along the BRI regions was significantly negative, regardless of whether the control variables were added. This indicates the implementation of BRI slowed the pace of urbanization in the host countries.
Table 4 Estimated results of urbanization based on DID and PSM-DID
Variable DID PSM-DID
Model (1) Model (2) Model (3) Model (4)
Gi -1.353 -1.784 -1.366 -1.790
(-0.36) (-0.69) (-0.36) (-0.69)
Dt 1.745*** 1.400*** 1.778*** 1.420***
(23.50) (16.62) (24.68) (17.17)
${{G}_{i}}\cdot {{D}_{t}}$ -0.194* -0.298*** -0.394*** -0.454***
(-1.69) (-2.60) (-3.48) (-3.98)
$lnx11$ 1.185*** 1.213***
(8.90) (9.15)
$lnx12$ -0.671*** -0.696***
(-3.29) (-3.38)
$lnx13$ -0.075* -0.066
(-1.73) (-1.56)
$lnx21$ -0.699*** -0.697***
(-3.57) (-3.55)
$lnx22$ 0.947*** 0.639***
(4.64) (3.10)
$lnx23$ 0.395*** 0.296***
(4.97) (3.76)
Intercept 61.486*** 38.722*** 61.475*** 41.499***
(25.07) (13.12) (25.31) (14.04)
Observations 1518 1518 1456 1456

Note: lnx11, lnx12, lnx13, lnx21, lnx22, and lnx23 are the logarithms of x11, x12, x13, x21, x22, and x23 respectively. t statistics in parentheses. * p < 0.1, ** p < 0.05, *** p < 0.01. Models (1) and (2) show the estimation results based on ordinary DID. Models (3) and (4) show the estimation results based on PSM-DID. Control variables for regression were not added in models (1) and (3); models (2) and (4) present the estimation results when control variables were added.

The critical prerequisite for the DID model is that the treatment and control group must satisfy the common trend hypothesis—that is, if the BRI were not to be implemented, no systematic difference in urbanization between the two groups should present itself. The PSM-DID method is therefore employed in order to analyze the robustness of estimation. We chose the k-nearest neighbor matching method without replacement to select the matching sample. According to the results (Table 5), out of a total of 1518 observations, only 13 and 49 of the control and treatment group were shown to be off support, without a significant loss of information.
Table 5 The samples selection of PSM
Region Off support On support Total
Non-BRI countries 13 867 880
BRI countries 49 589 638
Total 62 1456 1518
The balance test can also be conducted to analyze differences between two groups before and after the process of matching. The results of the balance test conducted in this study are listed in Table 6. The biases of each item were found to be substantially diminished after matching, and the absolute values of standard deviations in matched samples were less than 10%. From the p-value of the t-test, no significant difference was found between the two groups for each variable, indicating the data was balanced.
Table 6 Balancing test of variables
Variable Mean % bias Reduction
in % bias
T-test
Treated Control t-value $p>\left| t \right|$
$lnx11$ Unmatched 15.47 14.879 35.7 6.85 0.000
Matched 15.329 15.227 6.1 82.8 1.04 0.300
$lnx12$ Unmatched 3.741 3.521 34.8 6.69 0.000
Matched 3.693 3.641 8.4 75.9 1.59 0.112
$lnx13$ Unmatched 1.125 1.012 9.6 1.84 0.066
Matched 1.080 1.048 2.7 71.7 0.47 0.635
$lnx21$ Unmatched 3.145 3.076 22.6 4.35 0.000
Matched 3.132 3.134 -0.6 97.5 -0.10 0.919
$lnx22$ Unmatched 8.868 8.989 -9.3 -1.76 0.079
Matched 8.868 8.752 8.9 4.1 1.58 0.114
$lnx23$ Unmatched 3.797 3.527 13.6 2.53 0.011
Matched 3.661 3.654 0.3 97.5 0.06 0.950
The remaining 1456 observations in the common support range were inputted into the PSM-DID in order to estimate the net effect of BRI on urbanization. From the regression results obtained using the matched samples in Table 4, the coefficients of interaction Gi·Dt remained significantly negative at the level of 1% after matching, which is generally consistent with the estimation results by ordinary DID models. The minor changes in the regression coefficients between the DID and PSM-DID models indicate the robustness of the impact of BRI on urbanization.

3.1.2 Dynamic effects

The overall trend shows the urbanization level to be in a state of decrease throughout the 6-year post-initiative period. It is not clear when this negative effect emerges. To assess the dynamic relationship between the BRI and urbanization, we employed multi-period DID modeling, replacing the interaction Gi·Dt with a set of variables to represent the outcome after the initiative declared six years. The results of the dynamic effect of the initiative are presented in Table 7.
Table 7 The dynamic effect of BRI on urbanization
Variable DID PSM-DID
Model (5) Model (6) Model (7) Model (8)
Gi -1.353 -1.713 -1.381 -1.741
(-0.36) (-0.66) (-0.36) (-0.67)
Dt 1.745*** 1.458*** 1.778*** 1.473***
(24.14) (17.42) (25.29) (17.90)
Gi·Dt 2015 -0.934*** -0.816*** -1.075*** -0.940***
(-5.50) (-4.72) (-6.32) (-5.39)
2016 -0.644*** -0.554*** -0.813*** -0.699***
(-3.80) (-3.23) (-4.81) (-4.06)
2017 -0.351** -0.400** -0.548*** -0.555***
(-2.07) (-2.34) (-3.24) (-3.23)
2018 -0.051 -0.261 -0.275 -0.427**
(-0.30) (-1.50) (-1.63) (-2.46)
2019 0.254 -0.016 0.004 -0.193
(1.50) (-0.09) (0.02) (-1.10)
2020 0.565*** 0.324* 0.335** 0.130
(3.33) (1.88) (1.99) (0.75)
Intercept 61.486*** 42.364*** 61.475*** 44.681***
(25.07) (13.99) (25.11) (14.75)
Control variable No Yes No Yes
Observations 1518 1518 1456 1456

Note: t statistics in parentheses. * p < 0.1, ** p < 0.05, *** p < 0.01. Models (5) and (6) show the estimation results based on ordinary DID. Models (7) and (8) show the estimation results based on PSM-DID. Control variables were not added for regression in models (5) and (7), and models (6) and (8) present the estimated result of adding control variables.

The regression coefficients of the DID and PSM-DID models did not change significantly when the control variables were added. The level of urbanization in the BRI countries is shown to have dropped significantly when the initiative was launched, and this negative effect lasted for the first three years. Thereafter, the BRI does not seem to have significant impacts. There is a transition period in 2018 and 2019 for China’s FDI to fully benefit the local countries. The positive effect of the initiative occurs gradually over time, suggesting the negative effect of the BRI on urbanization will not continue in the long run. It should be noted that the interaction Gi·Dt is positive after 2019. The improvement of urbanization in BRI countries becomes statistically significant from the fifth year of the initiative onwards. This means the BRI appears to promote the urbanization level in participating countries, but the effects have a five-year lag.
The reason for this phenomenon is that China’s foreign direct investment (FDI) outflows to BRI partner countries were at the most priority in infrastructure construction and renovation, including the Karot Hydropower Project in Pakistan, Jakarta-Bandung High-Speed Rail in Indonesia, the China-Laos railway, and the Central Asia-China natural gas pipeline (Dunford and Liu, 2019; Tritto, 2021). These large scale infrastructure facilities mainly locate in suburbs, absorbing a huge amount of outward-moving surplus labor, thus decreasing the urbanization level in these countries. About three years after, China transformed its investments and shifted towards constructing modern facilities and high-tech industrial zones, such as Gwadar Port in Pakistan and Great Stone Industrial Park in Belarus, thereby promoting economic development and population urbanization in participating countries (Liu et al., 2021). Another reason for the identified pattern lies in a learning curve for Chinese enterprises and companies in understanding how to take advantage of their investments in reasonable ways (Nugent and Lu, 2021).

3.2 The heterogeneity analysis

The BRI’s effects were found to exhibit significant disparities in terms of individual factor endowments and economic levels. A heterogeneity analysis for different income-level groups was therefore extremely necessary. According to the world development indicators classification in the World Bank database, all sample countries were divided into four income groups including low-income, lower middle-income, upper middle-income, and high-income countries (Table 1). The results for each sub-sample are shown in Figure 1.
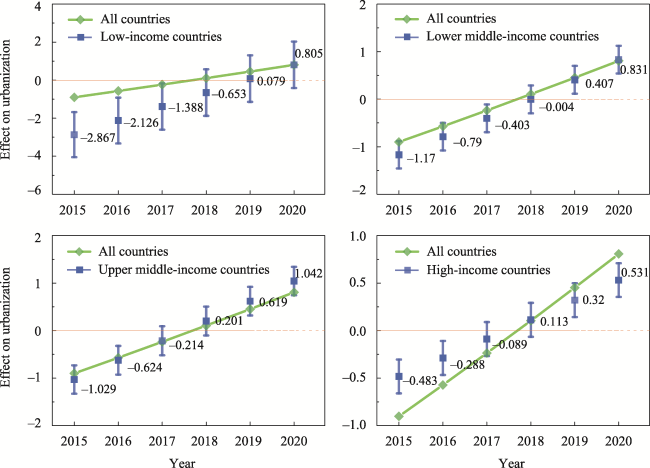
Figure 1 Results of heterogeneity analysis of income level

Note: The coefficients of dynamic effects from 2015 to 2020 in low-income, lower middle-income, upper middle-income, and high-income countries and their 95% confidence intervals are plotted. The average effects of all countries involved in the initiative are also depicted using a red line.

In the four subsamples, the BRI’s effects were unanimously shown to be negative in the first years of the initiative with a gradually decline in urbanization levels, which is consistent with the average treatment effects of all countries. The positive effects for low-income and lower middle-income countries emerged in 2019, while for other subsamples occurred in 2018. The effects of the BRI vary among different income levels. For the low-income countries, as opposed to the control group, the negative effects of the BRI on urbanization in the first three years were of a magnitude of 2.867, 2.126, and 1.388, which is more significant than the net effect in any subsample at any time. In 2020, the effect of the BRI was positive for low-income countries, with a value of 0.805, which is larger than the impact of the BRI on the high-income subsample. The significant upward trend indicates that low-income countries tended to be strongly influenced by the initiative. In comparison, it can be intuitively seen that the net effect for the high-income countries, ranging from -0.483 to 0.531, presents only a slight change from 2015 to 2020. One possible explanation for this is that the high-income countries involved in the initiative have relatively well-developed industries, so the degree of influence is much smaller than in low-income ones. It can thus be concluded that the lower income level they are, the greater net effect they would have.

3.3 Placebo test

We further performed a placebo test to verify the robustness of estimation results. The data before the launch of the BRI was used. We redefined the start time of the initiative with four hypothetical years (namely, 2014, 2013, 2012, and 2011). Other settings were identical to the previous section. Table 8 presents the results of the placebo test based on the ordinary DID model. The coefficients of interaction term Gi·Dt were insignificant in all models, meaning that the samples in the treatment and control groups basically satisfied the common trend assumption between 2010 and 2014 in the absence of the BRI. This finding suggests that the impact witnessed between 2015 and 2020 was indeed brought about by the launch of the BRI, rather than other confounding factors.
Table 8 Regression results of the parallel trends test
Variable Model (9) Model (10) Model (11) Model (12)
Gi -1.325 -1.296 -1.266 -1.237
(-0.35) (-0.34) (-0.33) (-0.32)
Dt 0.796*** 0.799*** 0.803*** 0.805***
(10.09) (13.38) (13.46) (10.23)
Gi·Dt -0.138 -0.141 -0.145 -0.145
(-1.13) (-1.53) (-1.58) (-1.20)
Intercept 61.327*** 61.167*** 61.005*** 60.842***
(24.85) (24.79) (24.72) (24.65)
Observations 690 690 690 690

Note: t statistics in parentheses. * p < 0.1, ** p < 0.05, *** p < 0.01. Models (9), (10), (11), and (12) are the placebo test results when the BRI was implemented in 2014, 2013, 2012, and 2011, respectively.

4 Discussion

The BRI is designed to build a new platform for inclusive globalization (Liu and Dunford, 2016). The principles of the BRI are mutual consultation, joint development, and benefit sharing, with hope of win-win outcomes through concerted efforts. Over the past years, China has built a connective network supported by expressways, high-speed railways, and ports in BRI participating countries. It brought increased convenience in terms of living conditions and various development opportunities for participated regions and their people (Chen et al., 2019; Sidaway et al., 2020). Despite the negative effect appears to have characterized the initial years following the introduction of the initiative—which can be attributed to a learning curve for Chinese firms to fully understand how to make their investment effectively—the impact of the BRI is shown to be significantly positive in long term. Previous studies have also shown the implementation effect of policy often needs a period wherein practical experience can emerge (Nugent and Lu, 2021; Wu et al., 2021), after which a greater number of countries and international organizations may decide to take part in a given initiative. A comprehensive understanding of economic effects of the initiative may, given these fluctuations, eliminate fears of environmental pollution issues and debt traps: sources of concern that can lead to sluggish technical progress and even impede economic development (Enderwick, 2018; Lindberg and Biddulph, 2021). Evaluating the BRI’s impact objectively, therefore, contributes to building a global community with a shared future (Liu et al., 2020). Based on the above analysis, we were able to reveal the effects of a series of control variables on urbanization with the use of geographical detector. Since the driving factors used in the geographical detector must be stratified, the k-means method was adopted in this study. The number of strata was set to 4 in accordance with the recommendations of previous studies (Hafeez et al., 2019; Yang and Lin, 2021).
The factor detection results have shown in Figure 2. Overall, the market factor is shown to have contributed remarkably to changes in a country’s urbanization level compared to other driving factors. Many regions have emphasized the role of market in economic growth, and it is crucial to establish a consumer-oriented economy in the context of economic globalization by promoting the degree of openness. For countries within BRI region, the extent of how the factors influencing the level of urbanization was found to be as follows: market factor > cargo flow > technology factor > population flow > capital flow > government factor. The top four factors were shown to be leading drivers at the 1% significance level, while the other indicators were not significant in their impacts. Due to a lack of technological innovation and capital agglomeration, the BRI countries embrace outward foreign direct investment in hope of enhancing their productivity. These countries are usually the first choice for developed countries aiming to transfer their industries with lower cost on labor force. Thus, external factors such as knowledge and goods flow, play an important role in BRI countries. For non-BRI countries, three internal drivers—namely, the market factor, government factor, and technology factor—are shown to constitute the prominent driving factors affecting urbanization. The above three indicators were also found to be statistically significant at the 1% level. One possible reason for this phenomenon in non-BRI countries is that developed countries along the route have already advanced to a higher quality development level, so their internal condition is significant in this stage of economic growth (Inostroza and Zepp, 2021).
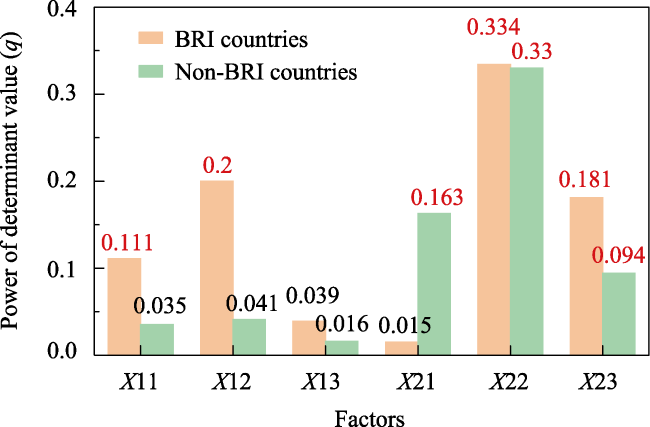
Figure 2 Factor detector results for each driving factor

Note: The explanatory power of factors significant at the level of 1% is highlighted in red.

Figure 3 shows the result of both determinant force and interaction type for any two factors addressed in our study, in relation to BRI and non-BRI countries. For BRI countries, the interaction effect of the market factor and the technology factor was found to reach the maximum intensity. Market conditions accelerate the pace of urbanization through commodity exchange and trade flows, while technological innovation has been identified as the key to be competitive in the global market (Miao et al., 2007). Though the government factor is shown to have had little effect in the analysis with the factor detection module, its interaction with other factors was found to have the capacity to make their explanatory power increase significantly. As for non-BRI countries, the interaction between government and market factors was found to exert the greatest comprehensive effect on urbanization levels. We note that whilst the driving forces of three external factors were quite weak individually, the explanatory power of their interactions with other factors was greater than single factor. The interactions of all factors showed bivariate enhancement and nonlinear enhancement in the influence that they exerted on urbanization, suggesting that all driving factors have strong joint effects with respect to urbanization level of the given country. As such, a range of factors should be taken into consideration in efforts to improve the level of urbanization.
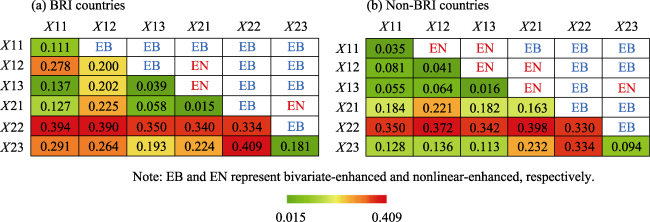
Figure 3 Matrix of interaction results of any two factors in BRI (a) and non-BRI countries (b)

Note: The lower triangular matrix is the explanatory power of two factors. The upper triangular matrix represents the interaction type of two factors.

5 Conclusions

The BRI, which seeks to usher in a new era of inclusive globalization, is inevitably shaping urbanization patterns all over the world. This study has evaluated its effects on urbanization by using panel data for 138 countries from the period 2010 to 2020. A series of robustness tests were also performed in order to validate the reliability of estimation. Our study has also sought to reveal the influencing mechanisms in relation to urbanization level of countries within and outside of BRI region. The main results of the study are as follows.
The implementation of BRI is found to exert increasingly positive effects on the urbanization level of participating countries. Though the BRI slows down the pace of urbanization for the first three years following a country’s integration in the region, its effects are significantly positive in the fifth year, showing that the impact of the policy on urbanization experienced a lag effect. The heterogeneity analysis results show that the degree of influence was highest in low-income countries, whereas the net effect for the high-income countries was much slighter, indicating that the BRI exerted greater effects in developing or underdeveloped economies. The geographical detector model was further employed to reveal the influencing mechanism of urbanization in BRI and non-BRI countries, with our results indicating that external factors are the prominent driving force in BRI countries, whereas internal drivers were shown to play an important role in non-BRI countries. A possible reason is that internal conditions occupy a significant position at the stage of economic growth in developed countries, indicating the implementation of BRI is conducive to promoting local urban growth and sustainable development in developed regions. From the proposal of the initiative to the present moment, international cooperation modalities have undergone significant change, thus producing varied effects on urbanization in the participating countries. There is a lag effect on urbanization in the BRI countries, proving the existence of a learning curve for China’s FDI with respect to the benefits that it is able to deliver local economic development.
We identify three prospective directions for further research. First, a comprehensive and objective analysis of the BRI in the participating countries could be conducted, which would assist China in finding better ways to fully make use of its investments and allow other BRI countries to be able to view the initiative properly. It is necessary to conduct a follow-up study to evaluate the influence of the initiative in the long term. In addition, due to the restriction in data acquisition, we selected representative factors in order to investigate the changes in driving mechanisms in the urbanization level in this study. This research design could be improved in future studies through an in-depth exploration of urbanization by considering more quantifiable influencing forces. Finally, although we have compared differences between BRI and non-BRI countries, the effects for individual countries within these categories have not been discussed. It is meaningful to explore the net effect for individual countries to facilitate the targeted policy implications.
[1]
Anastasiadou I, 2019. Iron Silk Roads: The geopolitics of past and present initiatives for the revival of Eurasian trade through overland transport corridors. Cambridge Journal of Regions, Economy and Society, 12(1): 57-75.

[2]
Arvin M B, Pradhan R P, Nair M S, 2021. Are there links between institutional quality, government expenditure, tax revenue and economic growth? Evidence from low-income and lower middle-income countries. Economic Analysis and Policy, 70: 468-489.

DOI

[3]
Bardaka E, Delgado M S, Florax R J G M, 2019. A spatial multiple treatment/multiple outcome difference-in-differences model with an application to urban rail infrastructure and gentrification. Transportation Research Part A: Policy and Practice, 121: 325-345.

[4]
Bjarnason T, Stockdale A, Shuttleworth I, et al. 2021. At the intersection of urbanisation and counterurbanisation in rural space: Microurbanisation in Northern Iceland. Journal of Rural Studies, 87: 404-414.

DOI

[5]
Bompard E F, Corgnati S P, Grosso D, et al. 2022. Multidimensional assessment of the energy sustainability and carbon pricing impacts along the Belt and Road Initiative. Renewable and Sustainable Energy Reviews, 154: 111741.

DOI

[6]
Bougheas S, Demetriades P O, Mamuneas T P, 2000. Infrastructure, specialization, and economic growth. Canadian Journal of Economics, 33(2): 506-522.

DOI

[7]
Chen C, Wu Y, 2017. Impact of foreign direct investment and export on urbanization: Evidence from China. China & World Economy, 25(1): 71-89.

[8]
Chen M, Sui Y, Liu W, et al. 2019. Urbanization patterns and poverty reduction: A new perspective to explore the countries along the Belt and Road. Habitat International, 84: 1-14.

DOI

[9]
Chen M X, Lin C, 2020. Geographic connectivity and cross-border investment: The belts, roads and skies. Journal of Development Economics, 146: 102469.

DOI

[10]
Cheng C, Ge C, 2020. Green development assessment for countries along the Belt and Road. Journal of Environmental Management, 263: 110344.

DOI

[11]
Contractor F J, Dangol R, Nuruzzaman N, et al. 2020. How do country regulations and business environment impact foreign direct investment (FDI) inflows? International Business Review, 29(2): 101640.

DOI

[12]
Dai F, Diao M, Sing T F, 2020. Effects of rail transit on individual travel mode shares: A two-dimensional propensity score matching approach. Transportation Research Part D: Transport and Environment, 89: 102601.

DOI

[13]
Dijkstra L, Florczyk A J, Freire S, et al. 2021. Applying the degree of urbanisation to the globe: A new harmonised definition reveals a different picture of global urbanisation. Journal of Urban Economics, 125: 103312.

DOI

[14]
Dunford M, Liu W, 2019. Chinese perspectives on the Belt and Road Initiative. Cambridge Journal of Regions, Economy and Society, 12(1): 145-167.

[15]
Enderwick P, 2018. The economic growth and development effects of China’s One Belt, One Road Initiative. Strategic Change, 27(5): 447-454.

DOI

[16]
Fang C, Yu D, 2017. Urban agglomeration: An evolving concept of an emerging phenomenon. Landscape and Urban Planning, 162: 126-136.

DOI

[17]
Fang K, Wang S, He J, et al. 2021. Mapping the environmental footprints of nations partnering the Belt and Road Initiative. Resources, Conservation and Recycling, 164: 105068.

[18]
Friedman T L, 2005. The World Is Flat:A Brief History of the Twenty-first Century. New York: Farrar, Straus and Giroux.

[19]
Fu X, Ridderstaat J, Jia H, 2020. Are all tourism markets equal? Linkages between market-based tourism demand, quality of life, and economic development in Hong Kong. Tourism Management, 77: 104015.

DOI

[20]
Ghaffarpasand O, Talaie M R, Ahmadikia H, et al. 2021. How does unsustainable urbanization affect driving behavior and vehicular emissions? Evidence from Iran. Sustainable Cities and Society, 72: 103065.

DOI

[21]
Gollin D, Jedwab R, Vollrath D, 2016. Urbanization with and without industrialization. Journal of Economic Growth, 21(1): 35-70.

DOI

[22]
Gozgor G, Kablamaci B, 2015. What happened to urbanization in the globalization era? An empirical examination for poor emerging countries. The Annals of Regional Science, 55(2): 533-553.

DOI

[23]
Gyedu S, Heng T, Ntarmah A H, et al. 2021. The impact of innovation on economic growth among G7 and BRICS countries: A GMM style panel vector autoregressive approach. Technological Forecasting and Social Change, 173: 121169.

DOI

[24]
Hafeez M, Yuan C, Shahzad K, et al, 2019. An empirical evaluation of financial development-carbon footprint nexus in One Belt and Road region. Environmental Science and Pollution Research, 26(24): 25026-25036.

DOI

[25]
Heckman J J, Ichimura H, Todd P E, 1997. Matching as an econometric evaluation estimator: Evidence from evaluating a job training programme. The Review of Economic Studies, 64(4): 605-654.

DOI

[26]
Hirota H, Yunoue H, 2017. Evaluation of the fiscal effect on municipal mergers: Quasi-experimental evidence from Japanese municipal data. Regional Science and Urban Economics, 66: 132-149.

DOI

[27]
Hsieh S-C, 2014. Analyzing urbanization data using rural-urban interaction model and logistic growth model. Computers, Environment and Urban Systems, 45: 89-100.

[28]
Huntington S P, 1993. The clash of civilizations? Foreign Affairs, 72(3): 22-49.

[29]
Hussain J, Zhou K, Muhammad F, et al, 2021. Renewable energy investment and governance in countries along the Belt & Road Initiative: Does trade openness matter? Renewable Energy, 180: 1278-1289.

DOI

[30]
Inostroza L, Zepp H, 2021. The metabolic urban network: Urbanisation as hierarchically ordered space of flows. Cities, 109: 103029.

DOI

[31]
Jiang Q, Ma X, Wang Y, 2021. How does the One Belt One Road Initiative affect the green economic growth? Energy Economics, 101: 105429.

DOI

[32]
Keleg M, Butina Watson G, Salheen M A, 2021. The path to resilience: Change, landscape aesthetics, and socio-cultural identity in rapidly urbanising contexts. The case of Cairo, Egypt. Urban Forestry & Urban Greening, 65: 127360.

[33]
Kong Q, Chen A, Shen C, et al, 2021. Has the Belt and Road Initiative improved the quality of economic growth in China’s cities? International Review of Economics & Finance, 76: 870-883.

[34]
Lambin E F, Meyfroidt P, 2011. Global land use change, economic globalization, and the looming land scarcity. Proceedings of the National Academy of Sciences, 108(9): 3465.

DOI

[35]
Li C-Y, Lai A-C, Wang Z-A, et al, 2019. The preliminary effectiveness of bilateral trade in China’s Belt and Road Initiatives: A structural break approach. Applied Economics, 51(35): 3890-3905.

DOI

[36]
Li K X, Jin M, Qi G, et al, 2018. Logistics as a driving force for development under the Belt and Road Initiative: The Chinese model for developing countries. Transport Reviews, 38(4): 457-478.

DOI

[37]
Lin Y, Qin Y, Wu J, et al, 2021. Impact of high-speed rail on road traffic and greenhouse gas emissions. Nature Climate Change, 11(11): 952-957.

DOI

[38]
Lindberg J, Biddulph R, 2021. China’s Belt and Road Initiative: The need for livelihood-inclusive stories. Geoforum, 121: 138-141.

DOI

[39]
Liu W, Dunford M, 2016. Inclusive globalization: Unpacking China’s Belt and Road Initiative. Area Development and Policy, 1(3): 323-340.

DOI

[40]
Liu W, Dunford M, Gao B, 2018. A discursive construction of the Belt and Road Initiative: From neo-liberal to inclusive globalization. Journal of Geographical Sciences, 28(9): 1199-1214.

DOI

[41]
Liu W, Zhang Y, Xiong W, 2020. Financing the Belt and Road Initiative. Eurasian Geography and Economics, 61(2): 137-145.

DOI

[42]
Liu Z, Dunford M, Liu W, 2021. Coupling national geo-political economic strategies and the Belt and Road Initiative: The China-Belarus Great Stone Industrial Park. Political Geography, 84: 102296.

DOI

[43]
Luo Z, Wan G, Wang C, et al, 2022. The distributive impacts of the Belt and Road Initiative. Journal of Economic Surveys, 36(3): 586-604.

DOI

[44]
Ma H, Sun Z, 2020. Comprehensive urbanization level and its dynamic factors for five Central Asian countries. Journal of Geographical Sciences, 30(11): 1761-1780.

DOI

[45]
Miao C H, Wei Y D, Ma H, 2007. Technological learning and innovation in China in the context of globalization. Eurasian Geography and Economics, 48(6): 713-732.

DOI

[46]
Muhammad S, Long X, Salman M, et al, 2020. Effect of urbanization and international trade on CO2 emissions across 65 Belt and Road Initiative countries. Energy, 196: 117102.

DOI

[47]
Munck R, 2021. Rethinking Development: Marxist Perspectives. Cham: Palgrave Macmillan.

[48]
Nugent J B, Lu J, 2021. China’s outward foreign direct investment in the Belt and Road Initiative: What are the motives for Chinese firms to invest? China Economic Review, 68: 101628.

DOI

[49]
Pacione M, 2009. Urban Geography: A Global Perspective. London: Routledge.

[50]
Pan S, Chong Z, 2022. Effects of FDI on trade among countries along the Belt and Road: A network perspective. The Journal of International Trade & Economic Development: 1-20.

[51]
Polykretis C, Alexakis D D, 2021. Spatial stratified heterogeneity of fertility and its association with socio-economic determinants using Geographical Detector: The case study of Crete Island, Greece. Applied Geography, 127: 102384.

DOI

[52]
Razzaq A, An H, Delpachitra S, 2021. Does technology gap increase FDI spillovers on productivity growth? Evidence from Chinese outward FDI in Belt and Road host countries. Technological Forecasting and Social Change, 172: 121050.

DOI

[53]
Rosenbaum P R, Rubin D B, 1983. The central role of the propensity score in observational studies for causal effects. Biometrika, 70(1): 41-55.

DOI

[54]
Sidaway J D, Rowedder S C, Woon C Y, et al, 2020. Introduction: Research agendas raised by the Belt and Road Initiative. Environment and Planning C: Politics and Space, 38(5): 795-802.

[55]
Smith N, Thomas E, 2017. Regional conditions and innovation in Russia: The impact of foreign direct investment and absorptive capacity. Regional Studies, 51(9): 1412-1428.

DOI

[56]
Sun L, Chen J, Li Q, et al, 2020. Dramatic uneven urbanization of large cities throughout the world in recent decades. Nature Communications, 11(1): 5366.

DOI PMID

[57]
Tian G, Li J, 2019. How does infrastructure construction affect economic development along the “Belt and Road”: By promoting growth or improving distribution? Emerging Markets Finance and Trade, 55(14): 3332-3348.

DOI

[58]
Tritto A, 2021. China’s Belt and Road Initiative: From perceptions to realities in Indonesia’s coal power sector. Energy Strategy Reviews, 34: 100624.

DOI

[59]
UN-Habitat, 2020. World Cities Report 2020:The Value of Sustainable Urbanization. Nairobi, Kenya.

[60]
Wang J F, Li X H, Christakos G, et al, 2010. Geographical detectors-based health risk assessment and its application in the neural tube defects study of the Heshun region, China. International Journal of Geographical Information Science, 24(1): 107-127.

DOI

[61]
Wang Q, Li L, 2021. The effects of population aging, life expectancy, unemployment rate, population density, per capita GDP, urbanization on per capita carbon emissions. Sustainable Production and Consumption, 28: 760-774.

DOI

[62]
Wu F, 2003. Globalization, place promotion and urban development in Shanghai. Journal of Urban Affairs, 25(1): 55-78.

DOI

[63]
Wu W, Huang M, Lv H, et al, 2021. Does the air pollution joint prevention and control policy possess the Porter effect in China: Evidence from two perspectives. Environmental Impact Assessment Review, 91: 106678.

DOI

[64]
Yang Y, Hu N, 2019. The spatial and temporal evolution of coordinated ecological and socioeconomic development in the provinces along the Silk Road Economic Belt in China. Sustainable Cities and Society, 47: 101466.

DOI

[65]
Yang Y, Lin C, 2021. Impact of the “Belt and Road Initiative” on machinery production networks. Economic Modelling, 104: 105642.

DOI

Outlines

/