Research Articles

Divergent effects of climate change on cropland ecosystem water use efficiency at different elevations in southwestern China

  • TAO Jian , 1 ,
  • ZHU Juntao 2 ,
  • ZHANG Yangjian , 2, * ,
  • DONG Jinwei 3 ,
  • ZHANG Xianzhou 2
Expand
  • 1. School of Public Administration, Shandong Technology and Business University, Yantai 264005, Shandong, China
  • 2. Nagqu Alpine Grassland Research Station, Key Laboratory of Ecosystem Network Observation and Modeling, Institute of Geographic Sciences and Natural Resources Research, CAS, Beijing 100101, China
  • 3. Key Laboratory of Land Surface Pattern and Simulation, Institute of Geographic Sciences and Natural Resources Research, CAS, Beijing 100101, China
* Zhang Yangjian (1976-), Professor, E-mail:

Tao Jian (1983-), Professor, specialized in alpine ecosystem ecology. E-mail:

Received date: 2021-11-05

  Accepted date: 2022-05-20

  Online published: 2022-10-25

Supported by

National Natural Science Foundation of China(41501054)

Scientific Research Foundation of Shandong Technology and Business University(BS201735)

Key Research Program of Frontier Sciences of the Chinese Academy of Sciences(QYZDB-SSW-DQC005)

Abstract

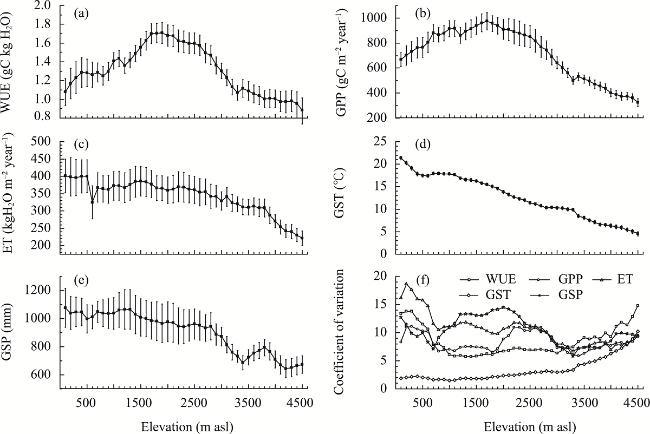
Understanding climatic effects on cropland water use efficiency at different elevations is imperative for managing agricultural water and production in response to ongoing climate change in climate-sensitive areas with complex topography, such as southwestern China. We investigated climatic effects on cropland water use efficiency in southwestern China at each 100-m elevation bin during 2001-2017. The maximum water use efficiency was 1.71 gC kg-1 H2O for the 1900-1999 m elevation bin under the growing season temperature and precipitation of 14.58±0.32°C and 965.40±136.45 mm, respectively. The water use efficiency slopes were dominated by the evapotranspiration slopes at elevations below 1999 m but were controlled by the gross primary productivity slopes at elevations above 2000 m. This difference was caused by the substantial responses of evaporation to climate change at lower elevations and the increased climatic sensitivity of gross primary productivity at higher elevations. In comparison to those at other elevations, croplands at lower elevations were more vulnerable to extreme drought because of the dominant role fluctuating evapotranspiration played in water use efficiency. The findings will improve cropland water management in the study area.

Cite this article

TAO Jian , ZHU Juntao , ZHANG Yangjian , DONG Jinwei , ZHANG Xianzhou . Divergent effects of climate change on cropland ecosystem water use efficiency at different elevations in southwestern China[J]. Journal of Geographical Sciences, 2022 , 32(8) : 1601 -1614 . DOI: 10.1007/s11442-022-2012-7

1 Introduction

Carbon and water cycles are the two key and related processes in cropland ecosystems (Piao et al., 2010; Moore and Lobell, 2014; Porter et al., 2017). Crops assimilate CO2 through photosynthesis to regulate plant growth and the carbon cycle (Field et al., 1995; Berry et al., 2013). These processes are highly controlled by water availability (Nemani et al., 2003; van der Molen et al., 2011; Lawson and Vialet-Chabrand, 2019). Varied water availability under the background of climate change has severely affected global cropland ecosystem productivity (Zhao and Running, 2010; Zhu et al., 2019). In particular, extreme drought events have resulted in devastating impacts on regional agriculture activities (Lesk et al., 2016; Webber et al., 2018). It is critical to determine the mechanism behind the interactions between carbon and water cycles to manage cropland ecosystems in consideration of the changed water availability regime. Ecosystem water use efficiency (WUE), which is the ratio of carbon assimilation to water loss, is a parameter that effectively indicates the coupling relationship between ecosystem carbon and water cycles (Niu et al., 2011; Tang et al., 2014; Zhang et al., 2015). Improved knowledge of cropland WUE and its climate-driven mechanism is critical for coping with and adapting to ongoing climate change.
Ecosystem WUE is conventionally calculated as the ratio of gross primary productivity (GPP)/evapotranspiration (ET) (Hu et al., 2008). Eddy covariance flux observations and model simulations provide feasible ways for tracking the spatial and temporal characteristics of cropland WUE at varied scales (Williams et al., 2012; Knauer et al., 2018). Flux observations show that the global cropland WUE has a strong spatial variability across different climate regimes and changes from 1.06 gC kg-1 H2O in a semiarid continental monsoon climate (Xiao et al., 2013; Yang et al., 2016) to 4.02 gC kg-1 H2O in a temperate climate with humid westerly winds (Beer et al., 2010). On the North China Plain, the daily maximal cropland WUE appears in the morning, and the seasonal peak value occurs in late April in wheat fields and in late July/early August in maize fields (Tong et al., 2009). However, flux tower observations are limited, and their data cannot be accessed for every spot in the world, especially for croplands (Liu et al., 2015; Zhang et al., 2015). Under certain circumstances, we still must rely on model simulations to obtain cropland WUE at a regional scale. In the United States, the model-simulated cropland WUE increased from 1.7 gC kg-1 H2O in spring to 2.8 gC kg-1 H2O in autumn during 2004-2005 (Lu and Zhuang, 2010). In comparison to other regions of the United States, the southern United States exhibited a lower annual cropland WUE (calculated as the ratio of net primary productivity/evapotranspiration) of 0.54 gC kg-1 H2O, which increased by 30% from 1895 to 2007 (Tian et al., 2010). Previous studies using the Moderate-Resolution Imaging Spectroradiometer (MODIS) GPP (Zhao et al., 2005) and ET (Mu et al., 2011) products have reported the maximum annual cropland WUE in Central Europe, southern Canada and South Russia (Yang et al., 2016), the annual cropland WUE in China (Liu et al., 2015), and the change trend of cropland WUE in southern China (Tian et al., 2011). Additionally, the driving factors of the spatiotemporal patterns of cropland WUE have been identified (Zhang et al., 2012b; Liu et al., 2015).
In China, studies have shown a widespread decreasing trend in cropland WUE has been detected in southwestern China during the past decades (Hou et al., 2015; Li et al., 2015; Liu et al., 2015). The annual WUE (annual GPP/annual ET) and average monthly WUE of cropland ecosystems are 1.76 gC kg-1 H2O and 2.37 gC kg-1 H2O in this region, respectively (Zhao et al., 2020; Mokhtar et al., 2021). These studies unanimously agreed that cropland WUE is more sensitive to climate change than the WUE of other vegetation types, and precipitation plays a primary role in regulating cropland WUE in this region. In particular, a sustained climate drought from September 2009 to April 2010 resulted in extensive crop die-off and failure (Wang et al., 2010) and caused a severe reduction in annual GPP (Zhang et al., 2012a). The responses of cropland ecosystem characteristics, such as ecosystem productivity and respiration, to climate change also show spatial heterogeneity in this region (Tao et al., 2018; Gao et al., 2019; Zeeshan et al., 2021). Southwestern China features a complex mountainous topography composed of mountains/plateaus, such as the Yunnan-Guizhou Plateau, Hengduan Mountains, West Sichuan Plateau and Songpan Plateau (Figure 1a). The regional climate is dominated by the eastern branch of the South Asian monsoon, the East Asian summer monsoon and the Western Pacific subtropical high (Luo et al., 2009; Wu et al., 2012). Shaped by complex topography and varied magnitudes of monsoons, regional climates exhibit strong spatial heterogeneities, which complicate ecosystem responses to climate change. For example, the wide elevation range results in elevation-dependent climate effects on vegetation activities. We thus hypothesized that the response of cropland WUE to climate change might show spatial heterogeneity along rising elevations. However, previous related studies have mostly treated this precipitation-sensitive region as one individual unit and largely neglected local topography and climate regimes. To improve cropland management, the effects of climate change on cropland WUE and the underlying mechanism must be further explored in a more spatially explicit manner.
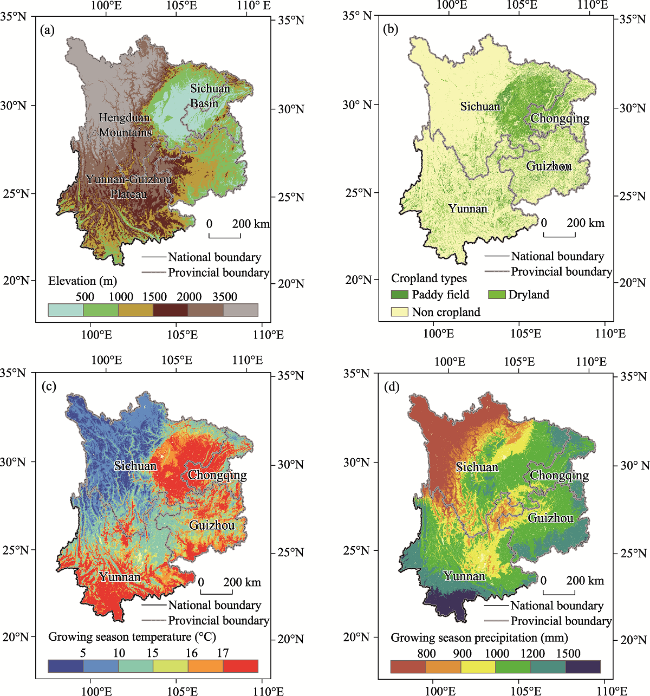
Figure 1 Maps of elevation (a), cropland distribution (b), growing season temperature (c), and growing season precipitation (d) in southwestern China
Thus, we applied MODIS data to investigate the driving effects of climate change on cropland WUE along rising elevations in southwestern China. Specifically, we addressed the following questions:
(1) Do the cropland WUE and the magnitude of its change trend vary along rising elevations?
(2) What is the relative contribution of the two WUE constitutive components, i.e., GPP and ET, to change trend of cropland WUE along rising elevations?
(3) Do climatic effects on the change trend of cropland WUE change with rising elevations?

2 Materials and methods

2.1 Study area

Southwestern China covers a total area of 1.13 × 10⁶ km2 and encompasses Chongqing Municipality, and provinces of Sichuan, Yunnan, and Guizhou. Elevations range from less than 100 m above sea level (asl) in the Sichuan Basin to over 4000 m asl on the western Sichuan Plateau (Figure 1a). Cropland accounts for 12.56% of the total vegetated areas (Figure 1b), and the study area is largely located in the subtropical climate zone. Temperature decreases with increasing elevation (Figure 1c), and precipitation decreases from the southeast to the northwest (Figure 1d).

2.2 Data

The MODIS program provides a series of remotely sensed ecological parameters with a high temporal resolution and a medium spatial resolution for ecological simulations at ecosystem scales. In this study, we selected the 8-day MODIS GPP (MOD17A2) and ET (MOD16A2) products (https://e4ftl01.cr.usgs.gov) to calculate 8-day cropland WUE during the growing season from 2001 to 2017. The growing season period was defined as the cutting date when the ratio of interpolated daily GPP to seasonal amplitude was 10% (Baldocchi et al., 2001; Xin et al., 2015). In our previous studies (Xu et al., 2017; Xu et al., 2018), both products were well validated by flux observations in the study area. The WUE data were also validated by the combined 8-day flux observational data obtained during 2015-2017, showing a strong correlation (Figure 2).
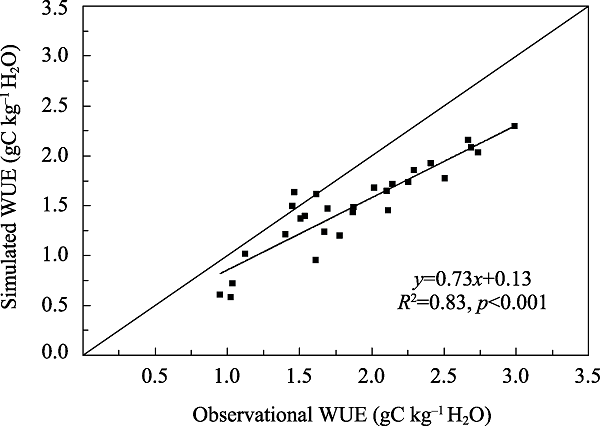
Figure 2 Validation of simulated WUE against WUE derived from eddy covariance flux observations
We derived land cover products in 2010 from MODIS (MCD12Q1) and the Data Center of Resources and Environmental Sciences, Chinese Academy of Sciences (Liu et al., 2014), to define the spatial distributions of cropland and its two types, i.e., paddy fields and dry land. We extracted the mean leaf area index (LAI) during the growing season (GSLAI) at each elevation bin using the MODIS LAI dataset (MCD15A2) during 2002-2017.
Daily meteorological records during 2001-2017, derived from the China Meteorology Administration (CMA), were aggregated to growing season mean temperature (GST) and the growing season total precipitation (GSP) according to the growing season period of GPP, and were then interpolated to spatially continuous grid datasets with a 500-m spatial resolution by ANUSPLIN software (Hutchinson, 1995). We used the GST and GSP data to analyze climate effects on change trend of WUE from 2001 to 2017.
The digital elevation dataset of the Shuttle Radar Topography Mission (SRTM) was employed to summarize the average values of WUE, GPP, ET, and climate factors at each 100-m elevation bin. The SRTM dataset with a 90-m spatial resolution was aggregated to a 500-m spatial resolution to match the MODIS and climate datasets. The elevation bins with pixel amounts less than 100 were excluded to avoid anomalous fluctuations caused by inadequate pixels. As a result, the elevation bins from 100 m to 4500 m asl were included in this study.

2.3 Statistical analyses

We analyzed change trends of cropland WUE, GPP, ET, GST and GSP from 2001 to 2017 across the entire cropland and at each 100-m elevation bin. The linear regression slope of the growing season values of each variable against time from 2001 to 2017 was calculated to indicate change trend.
We quantified the relative contribution of each climate factor to the change trends of WUE, GPP and ET using standardized regression coefficients (SRC) (Bring, 1994):
$\frac{y-\bar{y}}{ST{{D}_{y}}}=a+{{b}_{1}}\frac{{{x}_{1}}-{{{\bar{x}}}_{1}}}{ST{{D}_{{{x}_{1}}}}}+{{b}_{2}}\frac{{{x}_{2}}-{{{\bar{x}}}_{2}}}{ST{{D}_{{{x}_{2}}}}}$
where y is a dependent variable array during 2001–2017; $\bar{y}$ is the mean value of y; STDy is the standard deviation (STD) of y; x1 and x2 are concurrent arrays of two independent variables; ${{\bar{x}}_{1}}$ and ${{\bar{x}}_{2}}$ are the mean values of x1 and x2, respectively; STDx1 and STDx2 are the STDs of x1 and x2, respectively; a is the intercept; and b1 and b2 are the SRCs of x1 and x2, respectively.

3 Results

3.1 Elevational patterns of cropland distribution and averaged GSLAI, WUE, GPP, ET, GST, GSP during 2001-2017

The paddy fields covered more than 25% of the total croplands at elevation bins below 2599 m asl in the study area (Figure 3). The cropland GSLAI was more than 0.7 for all elevation bins. The GSLAI values showed a significant decreasing trend with increasing elevation (slope: 0.0013 per 1000 m, R2=0.22, p=0.04) below 1999 m asl but then steadily decreased to approximately 0.92±0.07 above 2000 m asl.
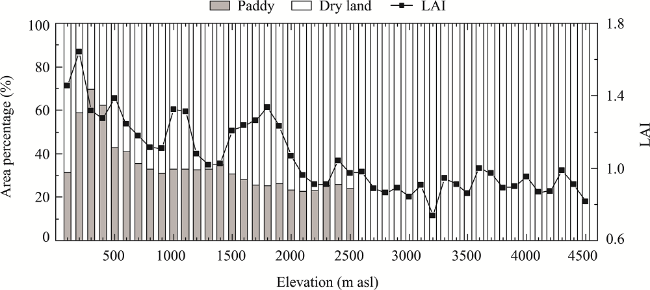
Figure 3 Histogram showing the area percentages of paddy fields and drylands, while the line with squares shows the mean leaf area index (LAI) during the growing season (GSLAI) at each elevation bin in southwestern China
The peak WUE value was 1.71 gC kg-1 H2O at the elevation bin of 1900-1999 m asl, where GST and GSP were 14.58±0.32℃ and 965.40±136.45 mm, respectively (Figure 4). Along rising elevations, the WUE increased significantly from 100 m asl to 1999 m asl by 0.0032 gC kg-1 H2O per 1000 m (R2=0.92, p<0.001) and then shifted to decreasing significantly from 2000 m asl to 4599 m asl by -0.0035 gC kg-1 H2O per 1000 m (R2=0.93, p<0.001). The GPP increased significantly from 100 m asl to 1799 m asl by 1.74 gC m-2 year-1 per 1000 m (R2=0.89, p<0.001) and then shifted to decreasing significantly from 1800 m asl to 4599 m asl by -2.55 gC m-2 year-1 per 1000 m (R2=0.97, p<0.001). The ET, GST and GSP decreased significantly from 100 m asl to 4599 m asl by -0.32 kgH2O m-2 year-1 per 1000 m (R2=0.77, p<0.001), -0.036℃ per 1000 m (R2=0.98, p<0.001) and -1.00 mm per 1000 m (R2=0.87, p<0.001), respectively.
Figure 4 Averages and standard deviations of cropland WUE (a), GPP (b), ET (c), GST (d), GSP (e), and their coefficients of variation (f) during 2001-2017 at each elevation bin in southwestern China. WUE, GPP, ET, GST, and GSP refer to ecosystem water use efficiency, gross primary productivity, evapotranspiration, mean temperature and total precipitation during the growing season, respectively. The coefficient of variation refers to the ratio of the interannual standard deviation to the average value during 2001-2017.
The interannual coefficients of variation (CVs) of WUE, GPP, ET, GST and GSP from 2001 to 2017 at each elevation bin were calculated to compare their interannual fluctuations (Figure 4f). As the two constitutive components of WUE, GPP and ET had CVs that showed elevation-dependent decreasing gaps. The CVs of ET were larger than those of the other variables at elevation bins below 1099 m asl and were more than 1.36 times those of the CVs of GPP below 1999 m asl. Above 2000 m asl, the CVs of GPP and ET were less different.

3.2 Elevational patterns of cropland WUE, GPP, ET, GST, and GSP slopes from 2001 to 2017

The WUE slopes were negative at all elevation bins except between 2100-2399 m asl and 2600-2899 m asl (Figure 5a). The WUE slopes strengthened significantly from 300 m asl to 2799 m asl by 0.008 gC kg-1 H2O year-1 per 1000 m (R2=0.84, p<0.001) and then shifted to weakening significantly from 2800 m asl to 4599 m asl by -0.004 gC kg-1 H2O year-1 per 1000 m (R2=0.70, p<0.001). The slopes of GPP and ET showed bimodal patterns that had two peaks at elevation bins below 799 m asl and between 2000 and 2999 m asl. The largest peak of the GPP slopes was located at elevation bins between 2000 and 2999 m asl, but the largest peak of the ET slopes was located at elevation bins below 799 m asl. The peak values of the ET slope percentages were higher than those of the GPP slope percentages at elevation bins below 799 m asl but were lower than those of the GPP slope percentages at elevation bins between 2000 and 2999 m asl (Figure 5f).
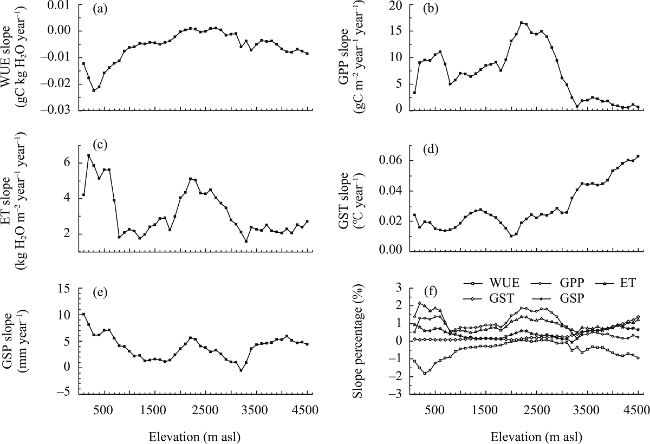
Figure 5 Change trends of annual WUE (a), GPP (b), ET (c), GST (d), GSP (e) from 2001 to 2017 and their slope percentages (f) at each elevation bin. WUE, GPP, ET, GST, and GSP refer to ecosystem water use efficiency, gross primary productivity, evapotranspiration, mean temperature and total precipitation during the growing season, respectively. The slope percentage refers to the ratio of the slope to the average value during 2001-2017.
Across all elevation bins, the WUE slopes exhibited a significantly positive relationship with the GPP slopes but had a significantly negative relationship with ET slopes (Table 1). However, when all the elevation bins were divided into two regions, lower and higher than the elevation bin of 1900-1999 m asl, the relative contributions of the GPP and ET slopes varied in the two regions. For the region below 1999 m asl, the absolute SRC of the ET slopes was larger than that of the GPP slopes but shifted to be lower than that of the GPP slopes in the region above 2000 m asl.
Table 1 Binary linear regression results between the cropland WUE slopes and the GPP and ET slopes. One asterisk refers to a p value < 0.05. Three asterisks refer to a p value < 0.001.
Dependent
factors
Independent
factors
SRC
100-4599 m asl 100-1999 m asl 2000-4599 m asl
WUE slope GPP slope 0.95*** 0.30* 1.99***
ET slope -0.99*** -1.02*** -1.13***

3.3 Elevational patterns of climatic effects on change trends of WUE, GPP, and ET from 2001 to 2017

For the change trend of WUE (Figure 6a), no SRCs of GST reached a significant level, while the SRCs of GSP were significantly negative at elevation bins above 3300 m asl, which indicated a significantly negative contribution of GSP change to WUE change at higher elevations. However, for the change trend of GPP (Figure 6b), the SRCs of GST were significantly positive at elevation bins below 1099 m and above 3400 m asl. The SRCs of GSP were significantly positive at elevation bins below 399 m asl but were significantly negative at elevation bins above 3200 m asl. For the change trend of ET (Figure 6c), the SRCs of GST were significantly positive at elevation bins below 1099 m asl and above 3400 m asl. The SRCs of GSP were significantly positive at elevation bins below 299 m asl.
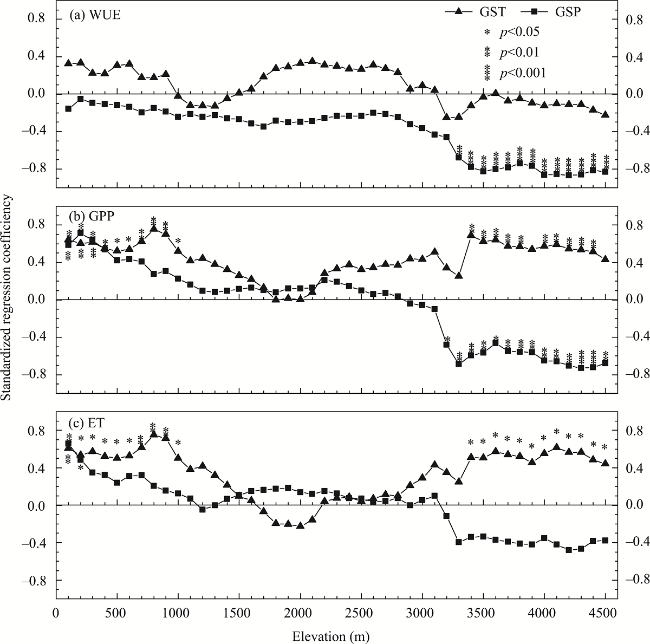
Figure 6 Standardized regression coefficients between change trends of GST and GSP and those of cropland WUE (a), GPP (b) and ET (c) at each elevation bin. In Figure a, y is the growing season WUE during 2001-2017, while x1 and x2 are GST and GSP, respectively. In Figure b, y is the growing season GPP during 2001-2017, while x1 and x2 are GST and GSP, respectively. In Figure c, y is the growing season ET during 2001-2017, while x1 and x2 are GST and GSP, respectively. WUE, GPP, ET, GST, and GSP refer to ecosystem water use efficiency, gross primary productivity, evapotranspiration, mean temperature and total precipitation during the growing season, respectively.

4 Discussion

4.1 Maximum cropland WUE at middle elevations

We used well-validated MODIS GPP and ET products to simulate cropland WUE in southwestern China. The cropland WUE across the entire study area was 1.38±0.11 gC kg-1 H2O during 2001-2017. It is higher than the value of 1.06 gC kg-1 H2O for cropland in northern China (Xiao et al., 2013) but lower than that of all of China (Zhu et al., 2015), both of which were derived from field observations. A global cropland WUE range value calculated by flux observation was within 1.06-4.02 gC kg-1 H2O (Beer et al., 2009; Tang et al., 2014). A model simulation revealed a cropland WUE of 2.34 gC kg-1 H2O for China (Liu et al., 2015) and 2.07 gC kg-1 H2O for the world (Ito and Inatomi, 2011). The cropland WUE generated in the present study was similar to that of a previous study in a humid/semihumid subtropical climate zone at a value of 1.57 gC kg-1 H2O (Fischer et al., 2007).
Cropland WUE is determined by a combination of water and heat conditions. The maximum cropland WUE value occurred at the elevation bin of 1900-1999 m, indicating that cropland ecosystems reach their peak capacity in utilizing water to assimilate carbon growth under optimal environmental conditions (GST: 14.58±0.32℃, GSP: 965.40±136.45 mm). There is a positive correlation between photosynthetic capacity and temperature to a certain extent, but it also applies to photorespiration and dark respiration (Xia et al., 2014; Dusenge et al., 2019). Thus, the maximum net photosynthetic rate tends to occur under medium temperatures (Wright et al., 2017), which exists at middle elevations in the study area. In addition, this region is located in the river valleys of the central and northern Yunnan-Guizhou Plateau. In comparison to other areas, river valleys normally feature a wider temperature difference between daytime and nighttime. Most plant photosynthesis occurs during the daytime, whereas respiration takes place throughout the day, causing asymmetric effects of daytime and nighttime temperatures on cropland production (Peng et al., 2013). The greater day-night temperature difference promotes carbon assimilation during the daytime and weakens carbon consumption during the nighttime, thereby further promoting cropland WUE. In regions below 1900 m asl, improved heat and water conditions stimulate carbon assimilation and carbon consumption. In regions above 2000 m asl, photosynthesis activity abates under worsened heat and water conditions (Tao et al., 2018).

4.2 Divergent contributions of GPP and ET to change trends of cropland WUE at different elevations

Previous studies have reported a significantly decreasing trend in WUE from 2001 to 2011 across southwestern China and have found that the primary driving factor of the WUE change was ET (Liu et al., 2015). For cropland in southwestern China, the primary driving factor of the WUE slopes was the ET slopes in the region below 1999 m asl, and the primary driving factor shifted to the GPP slopes in the region above 2000 m asl. At elevation bins below 1999 m asl, croplands exist in tropical/subtropical with humid climates and are exposed to the highest water and heat conditions across the study area. This region hosts 97.20% of the total paddy fields across the study area, and paddy fields account for more than 25% of the total croplands at each elevation bin. In tropical paddy fields, surface energy is primarily allocated to latent heat flux (Kueppers et al., 2007), and paddy evaporation (ETevap) makes up the primary proportion of ET (Kool et al., 2014). ETevap constitutes 71%-74% of the total ET during the growing season in a tropical monsoon-type climate, and it is principally controlled by meteorological factors, especially by solar radiation (Hossen et al., 2012). Climate change in the study area has displayed strong seasonal and interannual variability during the past decades (Li et al., 2015; Tao et al., 2018), which has caused the interannual CVs of ET to be higher than 10%. The ET slopes, which are sensitive to ongoing climate change, consequently played a dominant role in controlling cropland WUE slopes at lower elevations.
At elevations above 2000 m asl, the GPP slopes became the dominant contributor to the cropland WUE slopes. On the one hand, vegetation activity, such as greenness and productivity, has higher climate sensitivity at higher elevations in southwestern China (Tao et al., 2018). The GPP slopes were sensitive to climate change, especially under elevation-dependent climate warming. On the other hand, most croplands in this region are distributed in dry lands, whose GSLAI values were approximately 0.92±0.07. The stable cropland GSLAI values indicated that the ETevap of croplands was relatively stable and had less interannual variation. At the same time, temporal change in crop transpiration has a consistent correlation with that in GPP at daily, seasonal and interannual scales (Lawson and Vialet-Chabrand, 2019). The above two aspects resulted in the change trend of GPP dominating that in cropland WUE.

4.3 Divergent climatic effects on change trend of cropland WUE at different elevations

Climatic effects on change trend of cropland WUE were divergent at different elevations. Climate wetting exerted negative effects on change trend of WUE at elevation bins above 3300 m asl. Climate change indirectly affects change trend of the WUE by influencing that in GPP and ET (Xiao et al., 2013). The divergent climatic effects could be attributed to the shifted dominance of the primary driving factor of the WUE slopes from the ET slopes to the GPP slopes at different elevations.
At elevation bins below 1099 m asl, climate warming significantly facilitated change trend of GPP and ET. In this region, croplands are mostly distributed in the Sichuan Basin, which is located in a subtropical humid climate zone. In this climate zone, croplands require higher water availability stability because crops need more ET to assimilate CO2 (Niu et al., 2008; Berry et al., 2013). Climate-driven change in GPP was less than that in ET because of the stronger sensitivity of ET than GPP to climate change (Ponce-Campos et al., 2013). Under the climate and ecosystem conditions in the study area, the decreasing WUE was mainly caused by the enhanced ET at elevation bins below 1099 m asl. It is worth noting that the frequency of drought is relatively high in this region, and drought occurred more than 10 times during 2001-2017 (Zhao et al., 2020). The conflict between the high requirement of stable water availability and frequent drought leads to croplands at lower elevations being more vulnerable to extreme drought than other regions.
At elevations above 3400 m asl, croplands are largely located in the western Yunnan-Guizhou Plateau and the West Sichuan Plateau. Temperature is the primary climate factor driving change trends of GPP in alpine ecosystems (Piao et al., 2012; Tao et al., 2015; Pan et al., 2018), while cropland ET had less change in this region. In this region, elevation-dependent climate warming significantly accelerated photosynthetic activity, while the increasing GSP significantly hindered carbon assimilation by reducing soil temperature. Precipitation has a significantly negative correlation with soil temperature (Jones, 2013), especially in alpine ecosystems (Shen et al., 2015). GST at elevations above 3400 m asl ranged from 4.54℃ to 9.91℃ (mean: 6.74±1.49℃). The photosynthetic rate and carbon assimilation of plant leaves decrease significantly when the soil temperature is below 7℃ (Lambers and Oliveira, 2019). Increasing precipitation in this region reduced soil temperature and resulted in a negative effect on change trend of GPP. This negative effect resulted in a negative relationship between climate wetting and change trend of WUE since the cropland WUE slopes were dominantly controlled by the GPP slopes at higher elevations.
It should be noted that we investigated climate effects on change trend of cropland WUE at an interannual temporal scale. However, both water and carbon cycles have seasonal changes resulting from seasonal changes in meteorological factors. The optimum efficiency of a cropland utilizing water to assimilate carbon and its climate-driven mechanism consequently have seasonal changes. The elevational gradient of these seasonal changes should be further explored in future studies.

5 Conclusions

In this study, we investigated the change trend of cropland WUE in southwestern China from 2001 to 2017 and explored the climatic effects on WUE along an elevational gradient. We found that the maximum WUE was 1.71 gC kg-1 H2O at 1900-1999 m asl in elevation, where the GST and GSP were 14.58±0.32℃ and 965.40±136.45 mm, respectively. Cropland WUE decreased significantly under climate warming and wetting. The change trend of cropland WUE was mainly controlled by change trend of ET at lower elevations and by that of GPP at higher elevations. The shift in dominant driving factors on change trend of cropland WUE resulted in elevation-dependent climatic effects on change trend of WUE. An improved understanding of the specific driving factors of cropland WUE may significantly facilitate agricultural water management in southwestern China, which has complex topography and largely climate-sensitive ecosystems.
[1]
Baldocchi D, Falge E, Gu L, et al., 2001. FLUXNET: A new tool to study the temporal and spatial variability of ecosystem-scale carbon dioxide, water vapor, and energy flux densities. Bulletin of the American Meteorological Society, 82(11): 2415-2434.

DOI

[2]
Beer C, Ciais P, Reichstein M, et al., 2009. Temporal and among-site variability of inherent water use efficiency at the ecosystem level. Global Biogeochemical Cycles, 23(2): GB2018.

[3]
Beer C, Reichstein M, Tomelleri E, et al., 2010. Terrestrial gross carbon dioxide uptake: Global distribution and covariation with climate. Science, 329(5993): 834-838.

DOI PMID

[4]
Berry J, Wolf A, Campbell J E, et al., 2013. A coupled model of the global cycles of carbonyl sulfide and CO2: A possible new window on the carbon cycle. Journal of Geophysical Research: Biogeosciences, 118(2): 842-852.

DOI

[5]
Bring J, 1994. How to standardize regression coefficients. The American Statistician, 48(3): 209-213.

[6]
Dusenge M E, Duarte A G, Way D A, 2019. Plant carbon metabolism and climate change: Elevated CO2 and temperature impacts on photosynthesis, photorespiration and respiration. New Phytologist, 221(1): 32-49.

DOI

[7]
Field C B, Randerson J T, Malmström C M, 1995. Global net primary production: Combining ecology and remote sensing. Remote Sensing of Environment, 51(1): 74-88.

DOI

[8]
Fischer M L, Billesbach D P, Berry J A, et al., 2007. Spatiotemporal variations in growing season exchanges of CO2, H2O, and sensible heat in agricultural fields of the southern Great Plains, earth interactions. American Meteorological Society, 11(17): 1-21.

DOI

[9]
Gao M, Piao S, Chen A, et al., 2019. Divergent changes in the elevational gradient of vegetation activities over the last 30 years. Nature Communications, 10(1): 2970.

DOI PMID

[10]
Hossen M S, Mano M, Miyata A, et al., 2012. Surface energy partitioning and evapotranspiration over a double-cropping paddy field in Bangladesh. Hydrological Processes, 26(9): 1311-1320.

DOI

[11]
Hou W, Gao J, Wu S, et al., 2015. Interannual variations in growing-season NDVI and its correlation with climate variables in the southwestern karst region of China. Remote Sensing, 7(9): 11105-11124.

DOI

[12]
Hu Z, Yu G, Fu Y, et al., 2008. Effects of vegetation control on ecosystem water use efficiency within and among four grassland ecosystems in China. Global Change Biology, 14(7): 1609-1619.

DOI

[13]
Hutchinson M F, 1995. Interpolating mean rainfall using thin plate smoothing splines. International Journal of Geographical Information Systems, 9(4): 385-403.

DOI

[14]
Ito A, Inatomi M, 2011. Water-use efficiency of the terrestrial biosphere: A model analysis focusing on interactions between the global carbon and water cycles. Journal of Hydrometeorology, 13(2): 681-694.

DOI

[15]
Jones H G, 2013. Plants and Microclimate:A Quantitative Approach to Environmental Plant Physiology. Cambridge: Cambridge University Press.

[16]
Knauer J, Zaehle S, Medlyn B E, et al., 2018. Towards physiologically meaningful water-use efficiency estimates from eddy covariance data. Global Change Biology, 24(2): 694-710.

DOI PMID

[17]
Kool D, Agam N, Lazarovitch N, et al., 2014. A review of approaches for evapotranspiration partitioning. Agricultural and Forest Meteorology, 184: 56-70.

DOI

[18]
Kueppers L M, Snyder M A, Sloan L C, 2007. Irrigation cooling effect: Regional climate forcing by land-use change. Geophysical Research Letters, 34(3): L03703.

[19]
Lambers H, Oliveira R S, 2019. Photosynthesis, respiration, and long-distance transport:Respiration. In: LambersH, OliveiraR S (eds.). Plant Physiological Ecology,115-172. Cham: Springer International Publishing.

[20]
Lawson T, Vialet-Chabrand S, 2019. Speedy stomata, photosynthesis and plant water use efficiency. New Phytologist, 221(1): 93-98.

DOI PMID

[21]
Lesk C, Rowhani P, Ramankutty N, 2016. Influence of extreme weather disasters on global crop production. Nature, 529(7584): 84-87.

DOI

[22]
Li X, He B, Quan X, et al., 2015. Use of the standardized precipitation evapotranspiration index (SPEI) to characterize the drying trend in Southwest China from 1982-2012. Remote Sensing, 7(8): 10917-10937.

DOI

[23]
Liu J, Kuang W, Zhang Z, et al., 2014. Spatiotemporal characteristics, patterns, and causes of land-use changes in China since the late 1980s. Journal of Geographical Sciences, 24(2): 195-210.

DOI

[24]
Liu Y, Xiao J, Ju W, et al., 2015. Water use efficiency of China’s terrestrial ecosystems and responses to drought. Scientific Reports, 5(1): 13799.

DOI

[25]
Lu X, Zhuang Q, 2010. Evaluating evapotranspiration and water-use efficiency of terrestrial ecosystems in the conterminous United States using MODIS and AmeriFlux data. Remote Sensing of Environment, 114(9): 1924-1939.

DOI

[26]
Luo Y, Sherry R, Zhou X, et al., 2009. Terrestrial carbon cycle feedback to climate warming: Experimental evidence on plant regulation and impacts of biofuel feedstock harvest. GCB Bioenergy, 1(1): 62-74.

DOI

[27]
Mokhtar A, He H, Alsafadi K, et al., 2021. Ecosystem water use efficiency response to drought over southwest China. Ecohydrology: e2317.

[28]
Moore F C, Lobell D B, 2014. Adaptation potential of European agriculture in response to climate change. Nature Climate Change, 4(7): 610-614.

DOI

[29]
Mu Q, Zhao M, Running S W, 2011. Improvements to a MODIS global terrestrial evapotranspiration algorithm. Remote Sensing of Environment, 115(8): 1781-1800.

DOI

[30]
Nemani R R, Keeling C D, Hashimoto H, et al., 2003. Climate-driven increases in global terrestrial net primary production from 1982 to 1999. Science, 300(5625): 1560-1563.

PMID

[31]
Niu S, Wu M, Han Y, et al., 2008. Water-mediated responses of ecosystem carbon fluxes to climatic change in a temperate steppe. New Phytologist, 177(1): 209-219.

DOI PMID

[32]
Niu S, Xing X, Zhang Z, et al., 2011. Water-use efficiency in response to climate change: From leaf to ecosystem in a temperate steppe. Global Change Biology, 17(2): 1073-1082.

DOI

[33]
Pan S, Chen G, Ren W, et al., 2018. Responses of global terrestrial water use efficiency to climate change and rising atmospheric CO2 concentration in the twenty-first century. International Journal of Digital Earth, 11(6): 558-582.

DOI

[34]
Peng S, Piao S, Ciais P, et al., 2013. Asymmetric effects of daytime and night-time warming on Northern Hemisphere vegetation. Nature, 501(7465): 88-92.

DOI

[35]
Piao S, Ciais P, Huang Y, et al., 2010. The impacts of climate change on water resources and agriculture in China. Nature, 467(7311): 43-51.

DOI

[36]
Piao S, Tan K, Nan H, et al., 2012. Impacts of climate and CO2 changes on the vegetation growth and carbon balance of Qinghai-Tibetan grasslands over the past five decades. Global and Planetary Change, 98/99: 73-80.

DOI

[37]
Ponce-Campos G E, Moran M S, Huete A, et al., 2013. Ecosystem resilience despite large-scale altered hydroclimatic conditions. Nature, 494(7437): 349-352.

DOI

[38]
Porter J R, Howden M, Smith P, 2017. Considering agriculture in IPCC assessments. Nature Climate Change, 7(10): 680-683.

DOI

[39]
Shen M, Piao S, Cong N, et al., 2015. Precipitation impacts on vegetation spring phenology on the Tibetan Plateau. Global Change Biology, 21(10): 3647-3656.

DOI PMID

[40]
Tang X, Li H, Desai A R, et al., 2014. How is water-use efficiency of terrestrial ecosystems distributed and changing on Earth? Scientific Reports, 4(1): 7483.

DOI

[41]
Tao J, Xu T, Dong J, et al., 2018. Elevation-dependent effects of climate change on vegetation greenness in the high mountains of southwest China during 1982-2013. International Journal of Climatology, 38(4): 2029-2038.

DOI

[42]
Tao J, Zhang Y, Dong J, et al., 2015. Elevation-dependent relationships between climate change and grassland vegetation variation across the Qinghai-Xizang Plateau. International Journal of Climatology, 35(7): 1638-1647.

DOI

[43]
Tian H, Chen G, Liu M, et al., 2010. Model estimates of net primary productivity, evapotranspiration, and water use efficiency in the terrestrial ecosystems of the southern United States during 1895-2007. Forest Ecology and Management, 259(7): 1311-1327.

DOI

[44]
Tian H, Lu C, Chen G, et al., 2011. Climate and land use controls over terrestrial water use efficiency in monsoon Asia. Ecohydrology, 4(2): 322-340.

DOI

[45]
Tong X, Li J, Yu Q, et al., 2009. Ecosystem water use efficiency in an irrigated cropland in the North China Plain. Journal of Hydrology, 374(3/4): 329-337.

DOI

[46]
van der Molen M K, Dolman A J, Ciais P, et al., 2011. Drought and ecosystem carbon cycling. Agricultural and Forest Meteorology, 151(7): 765-773.

DOI

[47]
Wang W, Wang W, Li J, et al., 2010. The impact of sustained drought on vegetation ecosystem in Southwest China based on remote sensing. Procedia Environmental Sciences, 2: 1679-1691.

DOI

[48]
Webber H, Ewert F, Olesen J E, et al., 2018. Diverging importance of drought stress for maize and winter wheat in Europe. Nature Communications, 9(1): 4249.

DOI PMID

[49]
Williams C A, Reichstein M, Buchmann N, et al., 2012. Climate and vegetation controls on the surface water balance: Synthesis of evapotranspiration measured across a global network of flux towers. Water Resources Research, 48(6): W06523.

[50]
Wright I J, Dong N, Maire V, et al., 2017. Global climatic drivers of leaf size. Science, 357(6354): 917-921.

DOI PMID

[51]
Wu G, Liu Y, He B, et al., 2012. Thermal controls on the Asian Summer Monsoon. Scientific Reports, 2(1): 404.

DOI

[52]
Xia J, Chen J, Piao S, et al., 2014. Terrestrial carbon cycle affected by non-uniform climate warming. Nature Geoscience, 7(3): 173-180.

DOI

[53]
Xiao J, Sun G, Chen J, et al., 2013. Carbon fluxes, evapotranspiration, and water use efficiency of terrestrial ecosystems in China. Agricultural and Forest Meteorology, 182/183: 76-90.

DOI

[54]
Xin Q, Broich M, Zhu P, et al., 2015. Modeling grassland spring onset across the western United States using climate variables and MODIS-derived phenology metrics. Remote Sensing of Environment, 161: 63-77.

DOI

[55]
Xu T, Xu Y, Wang C, et al., 2017. Validation of applicability of MODIS evapotranspiration simulation model to Panxi tobacco planting area. Acta Tabacaria Sinica, 23(6): 53-60. (in Chinese)

[56]
Xu T, Xu Y, Zhang Y, et al., 2018. Applicability validation of MODIS productivity simulation model based on flux data in typical Pan-xi tobacco planting area. Acta Tabacaria Sinica, 24(4): 48-54. (in Chinese)

[57]
Yang Y, Guan H, Batelaan O, et al., 2016. Contrasting responses of water use efficiency to drought across global terrestrial ecosystems. Scientific Reports, 6(1): 23284.

DOI

[58]
Zhang L, Tian J, He H, et al., 2015. Evaluation of water use efficiency derived from MODIS Products against eddy variance measurements in China. Remote Sensing, 7(9): 11183-11201.

DOI

[59]
Zhang L, Xiao J, Li J, et al., 2012a. The 2010 spring drought reduced primary productivity in southwestern China. Environmental Research Letters, 7(4): 045706.

DOI

[60]
Zhang Q, Sun P, Singh V P, et al.,2012b. Spatial-temporal precipitation changes (1956-2000) and their implications for agriculture in China. Global and Planetary Change, 82/83: 86-95.

DOI

[61]
Zhao J, Xu T, Xiao J, et al., 2020. Responses of water use efficiency to drought in Southwest China. Remote Sensing, 12: 199.

DOI

[62]
Zhao M, Heinsch F A, Nemani R R, et al., 2005. Improvements of the MODIS terrestrial gross and net primary production global data set. Remote Sensing of Environment, 95(2): 164-176.

DOI

[63]
Zhao M, Running S W, 2010. Drought-induced reduction in global terrestrial net primary production from 2000 through 2009. Science, 329(5994): 940-943.

DOI PMID

[64]
Zhu W, Jia S, Devineni N, et al., 2019. Evaluating China’s water security for food production: The role of rainfall and irrigation. Geophysical Research Letters, 46(20): 11155-11166.

DOI

[65]
Zhu X, Yu G, Wang Q, et al., 2015. Spatial variability of water use efficiency in China’s terrestrial ecosystems. Global and Planetary Change, 129: 37-44.

DOI

Outlines

/