
Journal of Geographical Sciences >
Simulation of frozen ground distribution in northeast China based on a surface frost number model
|
Zhan Daqing (1997-), Master, specialized in permafrost degradation and land use change. E-mail: dqzhan@hrbnu.edu.cn |
Received date: 2021-08-26
Accepted date: 2022-03-09
Online published: 2022-10-25
Supported by
National Natural Science Foundation of China(41901072)
National Natural Science Foundation of China(41971151)
Joint Key Program of the NSFC and Heilongjiang Province of China(U20A2082)
Against the background of global warming, environmental and ecological problems caused by frozen ground degradation have become a focus of attention for the scientific community. As the temperature rises, the permafrost is degrading significantly in the frozen ground region of northeast China (FGRN China). At present, research on FGRN China is based mainly on data from meteorological stations, and the research period has been short. In this study, we analyzed spatial and temporal variation in the ground surface freezing index (GFI) and ground surface thawing index (GTI) from 1900 to 2017 for FGRN China, with the air freezing index (AFI) and air thawing index (ATI) using the University of Delaware (UDEL) monthly gridded air temperature dataset. The turning point year for annual mean air temperature (AMAT) was identified as 1985, and the turning point years for GFI and GTI were 1977 and 1996. The air temperature increased by 0.01 ℃ per year during 1900-2017, and the GFI and GTI increased at rates of -0.4 and 0.5 ℃ d per year before the turning point year; after the turning point, these rates were -0.7 and -2.1 ℃ d per year. We utilized a surface frost number model to study the distribution of frozen ground in FGRN China from 1900 to 2017. When the empirical coefficient E value is 0.57, the simulated frozen ground distribution is basically consistent with the existing frozen ground maps. The total area of permafrost in FGRN China decreased by 22.66×10⁴ km2 from 1900 to 2017, and the permafrost boundary moved northward with obvious degradation. The results of this study demonstrate the trend in permafrost boundary degradation in FGRN China, and provide basic data for research on the hydrological, climate, and ecological changes caused by permafrost degradation.
ZHAN Daqing , MAN Haoran , ZANG Shuying , LI Miao . Simulation of frozen ground distribution in northeast China based on a surface frost number model[J]. Journal of Geographical Sciences, 2022 , 32(8) : 1581 -1600 . DOI: 10.1007/s11442-022-2011-8
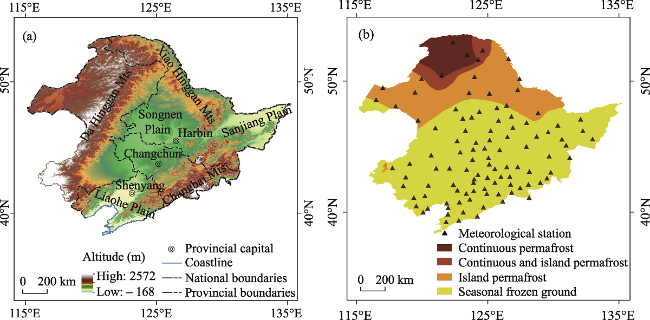
Figure 1 Location of the study area (a) and permafrost distribution (b) in the frozen ground region of northeast China |
Table 1 Description of the datasets adopted in this study |
| Number | Name | Time | Fuction | Source |
|---|---|---|---|---|
| 1 | Meteorological station data | 1977-2017 | Calculating the value of N | National Meteorological Information Centre of China (http://data.cma.cn/) |
| 2 | Monthly air temperature reanalysis data | 1900-2017 | Calculating the freezing/thawing indices | University of Delaware (http://climate.geog.udel.edu/climate/) |
| 3 | Land cover data | 2020 | Calculating the value of N | National Geomatics Center of China (http://www.globallandcover.com/) |
| 4 | Soil moisture data | 2002-2018 | Calculating the correlation between freezing/thawing indices and soil moisture | National monthly scale soil moisture dataset (https://zenodo.org/record/4922393) |
| 5 | Frozen ground map of China | 1998 and 2000 | Accuracy evaluation | National Tibetan Plateau Data Center (http://www.tpdc.ac.cn/) |
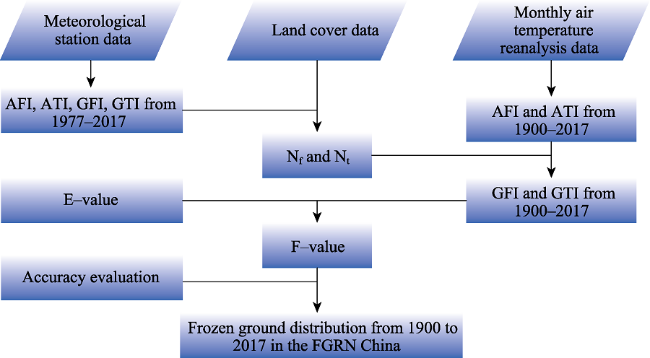
Figure 2 Flowchart of research design |
Table 2 Nf/Nt values of various land cover types in the frozen ground region of northeast China |
| Land cover types | Nf | Nt |
|---|---|---|
| Cultivated land | 0.43 | 1.30 |
| Grassland | 0.63 | 1.33 |
| Forest | 0.39 | 1.21 |
| Water bodies | 0.40 | 1.25 |
| Artificial surfaces | 0.44 | 1.26 |
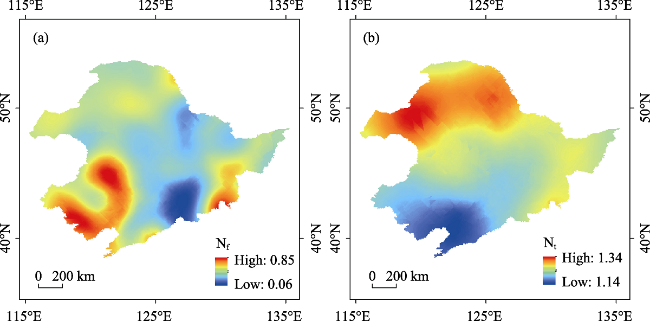
Figure 3 Spatial distribution of Nf (a) and Nt (b) in the frozen ground region of northeast China from 1977 to 2017 |
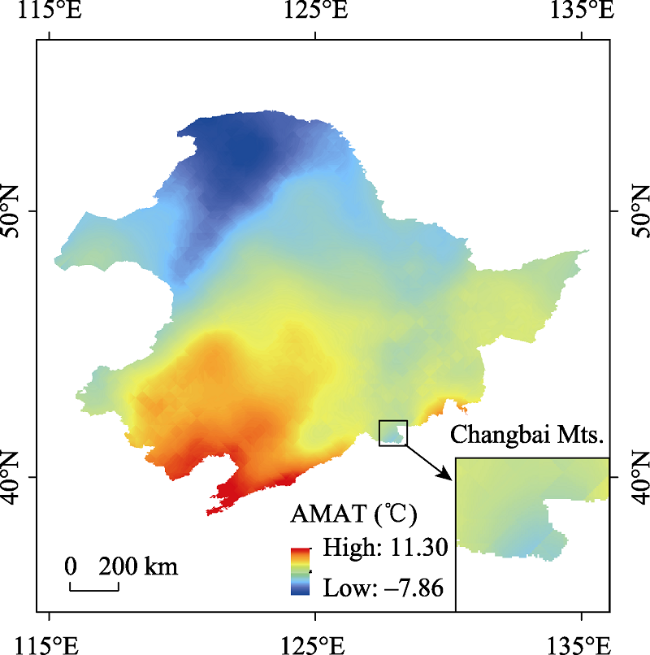
Figure 4 Spatial distribution of annual mean air temperature (AMAT) 1900-2017 in the frozen ground region of northeast China |
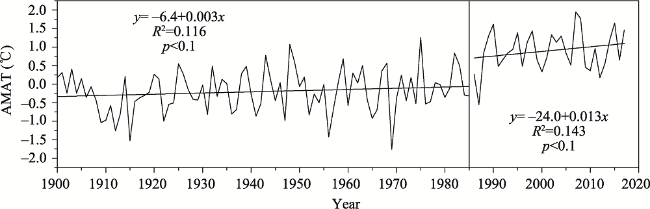
Figure 5 Annual mean air temperature (AMAT) in the frozen ground region of northeast China from 1900 to 2017 (marginally significant at the p<0.1 level, with a 90% confidence level) |
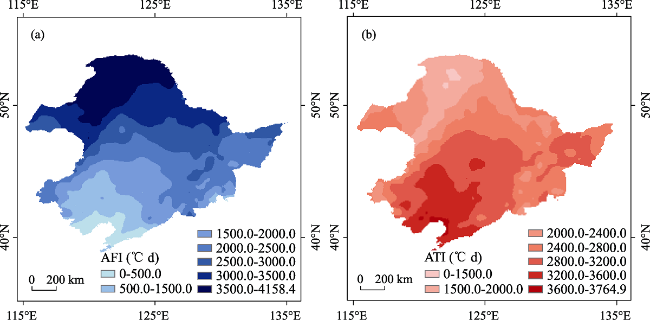
Figure 6 The average (a) air freezing index (AFI) and (b) air thawing index (ATI) (℃ d) over the period from 1900 to 2017 in the frozen ground region of northeast China |
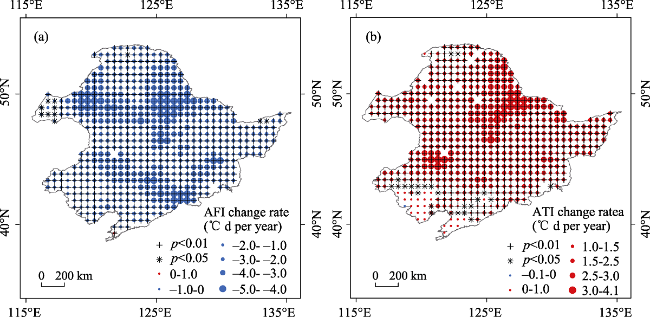
Figure 7 Spatial distribution of the rate of change in (a) air freezing index (AFI) and (b) air thawing index (ATI) over the period from 1900 to 2017 in the frozen ground region of northeast China (the plus sign indicates p<0.01 and the asterisk indicates p<0.05) |
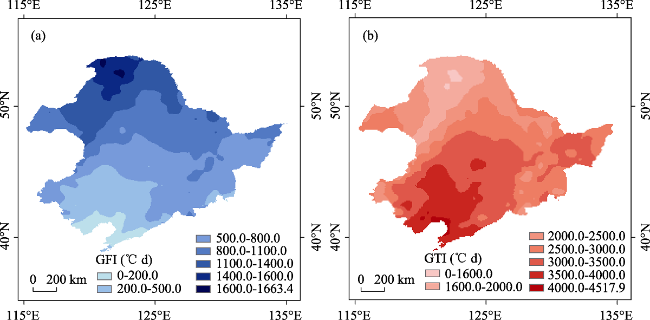
Figure 8 The average (a) ground surface freezing index (GFI) and (b) ground surface thawing index (GTI) (℃ d) over the period from 1900 to 2017 in the frozen ground region of northeast China |
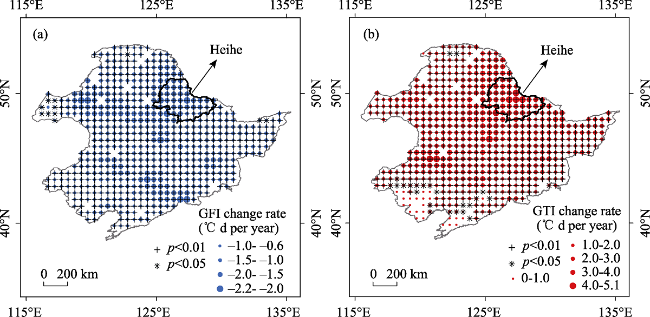
Figure 9 Spatial distribution of the rate of change in (a) ground surface freezing index (GFI) and (b) ground surface thawing index (GTI) over the period from 1900 to 2017 in the frozen ground region of northeast China (the plus sign indicates p<0.01 and the asterisk indicates p<0.05) |
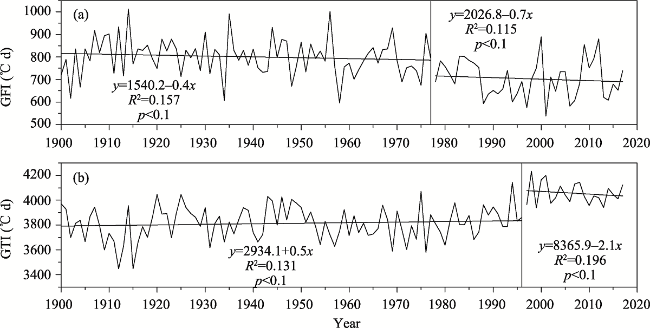
Figure 10 Time series of (a) ground surface freezing index (GFI) and (b) ground surface thawing index (GTI) during the period from 1900 to 2017 in the frozen ground region of northeast China (marginally significant at the p<0.1 level, with a 90% confidence level) |
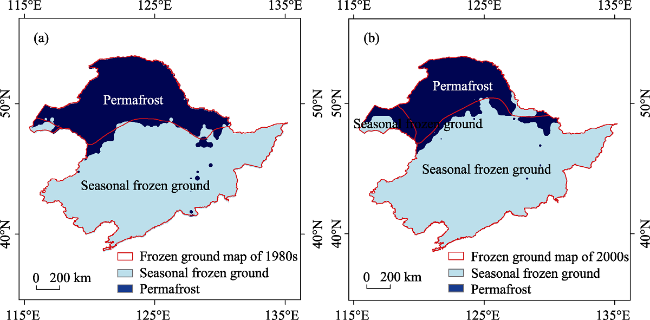
Figure 11 Spatial differences in permafrost distribution between the frozen ground map and simulation result for the 1980s (a) and the frozen ground map and simulation result for the 2000s (b) in the frozen ground region of northeast China |
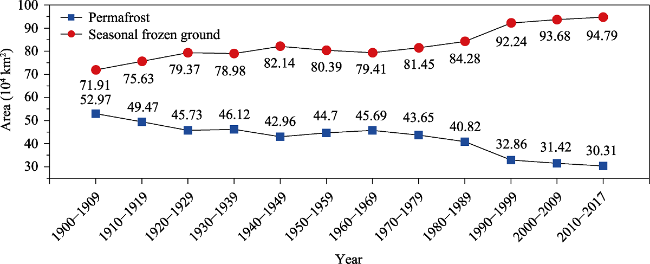
Figure 12 Changes in permafrost and seasonal frozen ground area in the frozen ground region of northeast China from 1900 to 2017 |
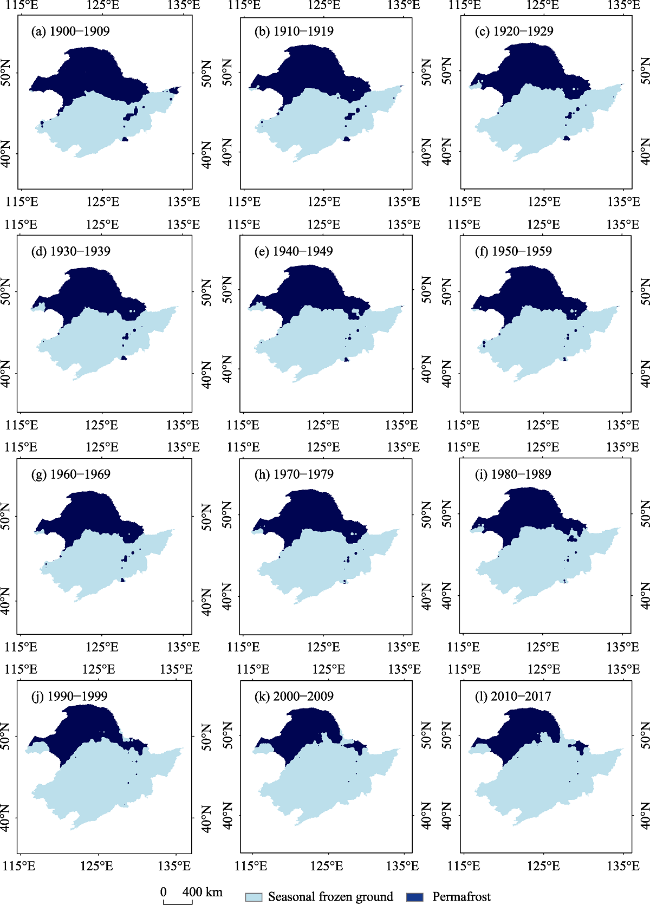
Figure 13 Decadal changes in permafrost in the frozen ground region of northeast China from 1900 to 2017 |
Table 3 Existing frozen ground map and simulated permafrost areas in the frozen ground region of northeast China |
| Year | Permafrost zone in existing frozen ground map (104 km2) | Simulated permafrost zone (104 km2) |
|---|---|---|
| 1980-1989 | 38.54 | 40.82 |
| 2000-2009 | 24.75 | 30.31 |
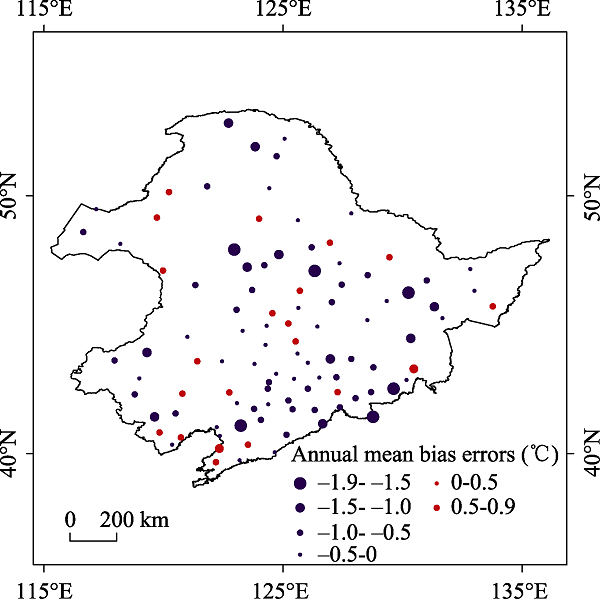
Figure A1 The spatial distribution of annual mean bias errors between the monthly air temperature reanalysis data and the meteorological station data in the frozen ground region of northeast China |
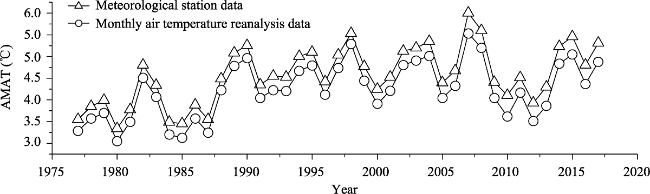
Figure A2 Changes in annual mean air temperature (AMAT) in the frozen ground region of northeast China from 1977 to 2017 |
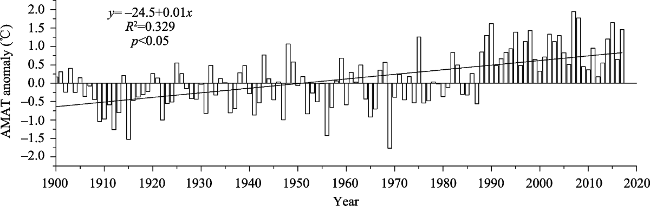
Figure A3 Time series of regional anomalies in annual mean air temperature (1900-2017) in the frozen ground region of northeast China |
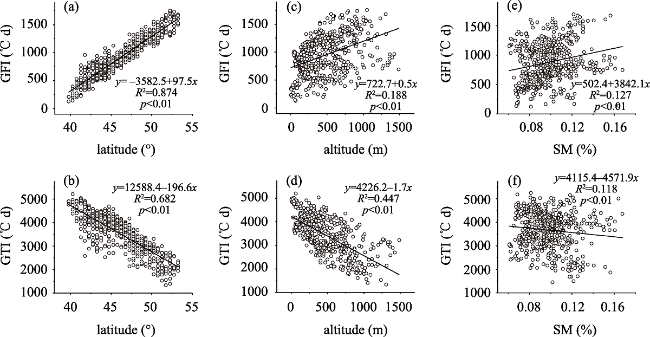
Figure A4 Correlation of GFI with latitude (a); correlation of GTI with latitude (b); correlation of GFI with altitude (c); correlation of GTI with altitude (d); correlation of GFI with SM (e); and correlation of GTI with SM (f) |
| [1] |
|
| [2] |
|
| [3] |
|
| [4] |
|
| [5] |
|
| [6] |
|
| [7] |
|
| [8] |
|
| [9] |
|
| [10] |
|
| [11] |
|
| [12] |
|
| [13] |
|
| [14] |
|
| [15] |
|
| [16] |
|
| [17] |
|
| [18] |
|
| [19] |
|
| [20] |
|
| [21] |
|
| [22] |
|
| [23] |
|
| [24] |
|
| [25] |
|
| [26] |
|
| [27] |
|
| [28] |
|
| [29] |
|
| [30] |
|
| [31] |
|
| [32] |
|
| [33] |
|
| [34] |
|
| [35] |
|
| [36] |
|
| [37] |
|
| [38] |
|
| [39] |
|
| [40] |
|
| [41] |
|
| [42] |
|
| [43] |
|
| [44] |
|
| [45] |
|
| [46] |
|
| [47] |
|
| [48] |
|
| [49] |
|
| [50] |
|
| [51] |
|
| [52] |
|
| [53] |
|
| [54] |
|
| [55] |
|
/
| 〈 |
|
〉 |