Research Articles

Machine learning-based identification for the main influencing factors of alluvial fan development in the Lhasa River Basin, Qinghai-Tibet Plateau

  • CHEN Tongde , 1 ,
  • WEI Wei 2 ,
  • JIAO Juying , 1, 3, * ,
  • ZHANG Ziqi 1 ,
  • LI Jianjun 1
Expand
  • 1. State Key Laboratory of Soil Erosion and Dryland Farming on the Loess Plateau, Institute of Soil and Water Conservation, Northwest A&F University, Yangling 712100, Shaanxi, China
  • 2. School of Automation, Northwestern Polytechnical University, Xi’an 710072, China
  • 3. Institute of Soil and Water Conservation, Chinese Academy of Sciences and Ministry of Water Resources, Yangling 712100, Shaanxi, China
* Jiao Juying (1965-), PhD and Professor, specialized in soil erosion and vegetation restoration. E-mail:

Chen Tongde (1993-), PhD Candidate, specialized in soil erosion and land quality evaluation. E-mail:

Received date: 2021-10-01

  Accepted date: 2022-02-14

  Online published: 2022-10-25

Supported by

The Strategic Priority Research Program of Chinese Academy of Sciences(XDA20040202)

The Second Tibetan Plateau Scientific Expedition and Research Program (STEP)(2019QZKK0603)

Abstract

Alluvial fans are an important land resource in the Qinghai-Tibet Plateau with the expansion of human activities. However, the factors of alluvial fan development are poorly understood. According to our previous investigation and research, approximately 826 alluvial fans exist in the Lhasa River Basin (LRB). The main purpose of this work is to identify the main influencing factors by using machine learning. A development index (Di) of alluvial fan was created by combining its area, perimeter, height and gradient. The 72% of data, including Di, 11 types of environmental parameters of the matching catchment of alluvial fan and 10 commonly used machine learning algorithms were used to train and build models. The 18% of data were used to validate models. The remaining 10% of data were used to test the model accuracy. The feature importance of the model was used to illustrate the significance of the 11 types of environmental parameters to Di. The primary modelling results showed that the accuracy of the ensemble models, including Gradient Boost Decision Tree, Random Forest and XGBoost, are not less than 0.5 (R2). The accuracy of the Gradient Boost Decision Tree and XGBoost improved after grid research, and their R2 values are 0.782 and 0.870, respectively. The XGBoost was selected as the final model due to its optimal accuracy and generalisation ability at the sites closest to the LRB. Morphology parameters are the main factors in alluvial fan development, with a cumulative value of relative feature importance of 74.60% in XGBoost. The final model will have better accuracy and generalisation ability after adding training samples in other regions.

Cite this article

CHEN Tongde , WEI Wei , JIAO Juying , ZHANG Ziqi , LI Jianjun . Machine learning-based identification for the main influencing factors of alluvial fan development in the Lhasa River Basin, Qinghai-Tibet Plateau[J]. Journal of Geographical Sciences, 2022 , 32(8) : 1557 -1580 . DOI: 10.1007/s11442-022-2010-9

1 Introduction

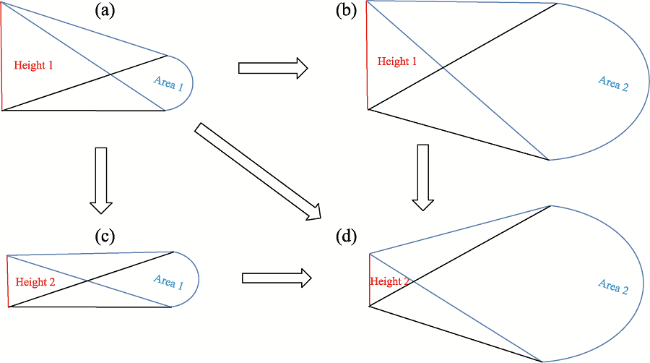
Alluvial fan is a cone-shaped sedimentary geomorphology that restores the deposition from catchment (White et al., 1996; Hartley et al., 2010). Alluvial fans can grow in a variety of terrestrial settings, such as alpine, periglacial, humid tropical and humid mid-latitude settings (Dorn, 1994). Moreover, alluvial fans can provide substantial historical data about tectonic, environmental and climate change for a basin or region (White et al., 1996; Sil et al., 2016). In some mountainous areas, alluvial fans have become an excellent producing and living space for local residents (Ma et al., 2004; Mazzorana et al., 2020). Some large-scale alluvial fans are even developed to towns or cities (Santangelo et al., 2012; Maghsoudi et al., 2014; Chen et al., 2017). Accordingly, numerous scholars have concentrated on alluvial fan since its concept was proposed (Drew, 1873). Research mainly includes the morphology (Sorrisovalvo et al., 1998), deposition process (Sweeney and Loope, 2001) and main influencing factors (Calvache et al., 1997; Harvey et al., 1999) of the alluvial fan. Alluvial fan development and evolution are influenced by a variety of factors (Goswami et al., 2009), including tectonic, climatic and catchment characteristics (relief, geology, drainage basin area, etc.). Tectonic activity is a fundamental requirement for alluvial fan development because it affects the size and morphology of alluvial fans by controlling the accommodation space (Viseras et al., 2003; Ventra and Clarke, 2018). Climate is a significant factor for fan-forming processes (White et al., 1996), and it affects the geomorphic activity of alluvial fans by altering the instability and intensity of runoff and flood (Harvey et al., 1999). The intensity and frequency of rainfall events are particularly important for alluvial fan development. The debris-flow activities are active with dramatical tensive rains and high rates of sediment, and flood-flow activities are active with high tensive rains; these activities ensue the procedure of sediment in the broad area where alluvial fans are commonly sculptured since Quaternary (Harvey et al., 1999). Meanwhile, the dry-wet cycle in history also affects the development of alluvial fans. The size is greater in the humid times than arid times in the historical period in central Europe (Meinsen et al., 2014). Catchment characteristics also influence the morphology of alluvial fans (Goswami et al., 2009; Ventra and Clarke, 2018). These characteristics, mainly including area, gradient, bedrock and vegetation, have received great attention in recent years (Harvey et al., 1999; Blair, 2002; Stock et al., 2008; Birch et al., 2016; Stokes and Gomes, 2020). Alluvial fans with a small size (typically, their radii are less than a few kilometres) and higher gradient are frequently associated with restricted matching catchments that are poorly integrated and small. By contrast, alluvial fans with a large size (the radii reached several tens up to a few hundred kilometres) and lower gradient are associated with well-integrated and extensive catchments (Ventra and Clarke, 2018). The alluvial fan area is usually large when the erosion resistance of catchment is low (Bull, 1962). Catchment resistance to erosion depends on the bedrock lithology characteristics. The catchment dominated with lithology of greater erodibility, such as mudrock, gypsum and marl limestone, yields a greater amount of weathering materials that can be carried to alluvial fan (Nichols and Thompson, 2010). The vegetation continuity also changes the shape of alluvial fans. The continuous cover of vegetation can be a barrier to the generation of rapid runoff and high-sediment flow. The catchment has a more discontinuous vegetation cover, making intensive runoff and debris-flow activities easier to create. The surface of alluvial fan is easily damaged or changed in this case due to rapid runoff (Harvey et al., 1999). Accordingly, several factors affect alluvial fan development and evolution, and they may influence it in a comprehensive manner or be dominated by one of them (Ventra and Clarke, 2018). The main influencing factors of an alluvial fan can be isolated where a contrast exists between one component and another, although such as case is rare in nature (Nichols and Thompson, 2010). Thus, researchers will have difficulty in confirming the major or controlling influencing factors on alluvial fan development.
Exploring the relationship between alluvial fans and their matching catchments is a good method to understand the mechanisms and qualify the main influencing factors of alluvial fan development (Nichols and Thompson, 2010; Ventra and Clarke, 2018). The composed materials of alluvial fans are the sediments delivered from the catchment by runoff, and the material characteristics, such as amount, distribution and deposition, can reflect the environmental change of catchment (Sorrisovalvo et al., 1998; Crosta and Frattini, 2004; Harvey, 2012). Accordingly, the relationship (including the sedimentation, morphology, geology and so on) between the alluvial fan and the catchment has received great attention in recent years, especially morphology, given the convenience of obtaining parameters (Crosta and Frattini, 2004; Stokes and Gomes, 2020). Moreover, the morphology relationship can show a linkage between the morphological characteristics and the processes that shape them (Stokes and Mather, 2015). On the one hand, alluvial fan morphology is the direct consequence of catchment sedimentation, which can reflect their catchment morphology (Ventra and Clarke, 2018). On the other hand, catchment morphology is verified to be the main influencing factor in alluvial fan development compared with other factors when empirical relationship models show a high correlation (Crosta and Frattini, 2004). However, the catchment morphology may be inferred to other factors, such as tectonic, climate and rock strength of catchment, when inferior correlations exist (Stokes and Mather, 2015; Stokes and Gomes, 2020). Several empirical relationship models of the morphological properties between alluvial fans (area and gradient) and catchments (area, relief, length and gradient) have been quantified in the volcanic island chain in the east-central Atlantic Ocean, indicating that catchment is a factor for alluvial fan development. However, the relationship of the models is inferior, and other more essential factors in this terrestrial environment must be taken into account to specifically link with volcano structure (Stokes and Gomes, 2020). Therefore, the morphology-catchment relationship is a significant way for determining the main influencing factors in alluvial fan development. The other affecting factors for alluvial fan, such as rock strength, hydrological condition and vegetation, are rarely considered in those relationships between alluvial fan and catchment even though they are significant for alluvial fan development and morphology. Those morphology-catchment relationships may be expressed as a power function of empirical models based on regression analyses, one or more of which is chosen to illustrate the main influencing factors of alluvial fan development (Harvey, 2002; Stokes and Gomes, 2020; Stokes and Mather, 2015). Although those relationships are useful in determining the main influencing factors in alluvial fan development, the optional regression model is an empirical selecting result from a series of regression models qualified by linear regression, polynomial regression, logistic regression and other methods. The selection standard is to choose an optional solution after contrasting the correlation exponents of regression models. However, some regression models may be overlooked because they are not well-known, although they really exist. Regression models based on machine learning are potential solutions to address the issue.
Machine learning techniques can help in finding the optimal solution for solving a complex problem for which no good solution can be found using a traditional approach (Géron, 2019). Machine learning has been used for modelling in many fields, including flood risk assessment (Alipour et al., 2020), debris flow forecast (Kern et al., 2017) and landslide susceptibility assessment (Marjanovi et al., 2011). The modelling processes of those studies are similar. Firstly, the independent factor data are proportionally classified into three parts. The first part is used to train different regression models. The second part is used to validate the models. The last part is used to test the models. The final model is qualified by the testing results, and some important main influencing factors for independent parameters are confirmed in the modelling process. The process of identifying the main influencing factors in alluvial fan development is also similar to those aforementioned processes, but few studies focused on it. Moreover, alluvial fan research is more common in arid, semi-arid or humid environments (Blair, 2002; Crosta and Frattini, 2004; Stokes and Mather, 2015; Stokes and Gomes, 2020), but it is seldom conducted in cold-alpine environments. Therefore, the objectives of this work as follows: 1) propose a regression model in the Lhasa River Basin (LRB) of Qinghai-Tibet Plateau (QTP) based on machine learning algorithms, according to the environmental parameters (morphology, material and hydrology of catchment) and alluvial fan development parameters; 2) analyse the application ability in other regions based on the generalisation ability testing of the model in other three basins in the QTP; and 3) qualify the main influencing factors in alluvial fan development based on the feature importance of final model. This work will provide a scientific basis for understanding the alluvial fan development in cold and high-altitude regions.

2 Data and methodology

2.1 Study area

The LRB is located in the south of Tibetan Plateau, southwest of China (Figure 1). The altitude range is wide, varying from 3523 m to 7067 m, because the topography is dominated by alpines and valleys (Zhang et al., 2010). The area is influenced by plateau semi-arid monsoon, with an average temperature from -1.7℃ to 9.7℃ and annual rainfall from 340 mm to 600 mm. The rainy season runs from June to September (Zhang et al., 2010; Wei et al., 2012). The vegetations are characterised by alpine steppe, alpine shrubs and meadows, cushion vegetation and so on (Lin et al., 2008). Some typical plants, including Populus szechuanica, Caragana sinica, Hordeum vulgare, Pisum sativum, Agropyron cristatum and Gnaphalium affine, can be found in the region (Lin et al., 2021). The seven soil types of this region are as follows: alluvial soil, meadow soil, subalpine meadow soil, alpine meadow soil, subalpine steppe soil, alpine steppe soil and alpine frozen soil (Wei et al., 2012).
Figure 1 Location of the Lhasa River Basin (LRB)
Alluvial fan is one of the fundamental landforms in the LRB, and it has been demonstrated to be an important land resource with huge utilisation potential (Zhao, 2020; Chen et al., 2022). The alluvial fans and matching catchments were interpreted one by one based on Google Earth (Figure 2). The three visible judging characteristics to ascertain alluvial fan in the LRB are as follows (Chen et al., 2020): 1) fan-shaped landform, 2) braided flow channels and 3) inconsistent flow (Figure 3, Chen et al., 2021). The position, amount, area and distribution of all alluvial fans were then obtained and entered into ArcGIS. Finally, approximately 826 alluvial fans were determined in the research area, with a total area of 1166.03 km2. The quantity of alluvial fans is concentrated in the east of LRB, but they are mainly distributed in the west (Chen et al., 2021).
Figure 2 Distribution of alluvial fans in the Lhasa River Basin
Figure 3 Typical alluvial fan and its matching catchment in the Lhasa River Basin

2.2 Methods

The alluvial fans had been visually interpreted based on Google Earth in a previous study. The 826 matching catchments with alluvial fans were obtained in the same way, using field checks for boundaries of some typical catchments, as shown in Figure 2. A typical alluvial fan and its matching catchment located in RLB are shown in Figure 3.
In this study, 826 alluvial fans are matched with 826 catchments. The process of building models consisted of a variety of steps, including establishing a development index (Di), obtaining independent parameters, different regression model operations, model evaluation and model generalisation ability test (Figure 4).
Figure 4 Flow chart of modelling

2.2.1 Alluvial fan developmental index establishment

Alluvial fan is a cone-shaped geomorphology, which develops when sediment from catchment is covered and eroded by external forces, such as runoff, wind and human activities. The development includes two directions under those two opposite functions, including ‘positive’ and ‘negative’ directions. The positive direction is when an alluvial fan develops into a steadier state with larger area or (and) lower elevation (Figure 5a to 5b, 5c or 5d; Figure 5b or 5c to 5d). The negative direction is the opposite of positive direction (Figure 5d to 5a, 5b, or 5c; Figure 5b or 5c to 5a). The perimeter and slope gradient of alluvial fan should be coordinated with area and height in the developmental process, and they are replenished information for alluvial fan development states. The common parameters in alluvial fan development are all about morphology, for example, alluvial fan area (Fa), alluvial fan perimeter (Fp), alluvial fan average gradient (Fg) and alluvial fan height (Fh) (Sorrisovalvo et al., 1998; Stokes and Gomes, 2020). Those four dependent parameters are shown in Table 1. Parameters Fa, Fp, Fg and Fh were calculated in ArcGIS using Calculate Geometry, Slop and Regional Statistical Analysis functions based on DEM (ALOS). The DEM (ALOS) data with 12.5 m of resolution were obtained from NASA EARTHDATA, and they were projected in geographic-WGS84 coordinates. The aforementioned parameters were used to create a developmental index of alluvial fan.
Figure 5 Conceptional map of the developmental state of alluvial fan. Height 1 is more than Height 2, and Area 1 is less than Area 2; The state of a is unsteady. The alluvial fan is easily eroded by external forces because the area is small, and the height is long. The state of d is the steadiest one amongst a, b and c due to the large area and long height.
Table 1 Brief information of the four dependent parameters
No. Alluvial fan parameter Abbreviation Unit Range
1 Area Fa km2 0.05-82.99
2 Perimeter Fp km 0.95-50.59
3 Average gradient Fg ° 2.32-23.34
4 Height Fh m 19-570
A development index (Di) was suggested based on the above data. The height of an alluvial fan is short, and the area and Di are large. The slope gradient and perimeter are supplementary indicators for alluvial fan development, considering the need for more information. Consequentially, four indicators (dependent parameters) are selected to develop Di. Based on the success of soil quality index (SQI) (Doran and Parkin, 1994; Li et al., 2013; Guo et al., 2017), Di was obtained using the following equation:
$Di=\sum\limits_{i=1}^{n}{{{W}_{xi}}{{f}_{xi}}}$,
where Di is the development index of alluvial fans that ranges between zero and one, Wxi is the assigned weight of each indicator, fxi is the indicator score, and i is the number of indicators from one to four, including Fa, Fp, Fg and Fh.
Wxi was calculated by Entropy Weight Method (EWM), which is an objective weighting method. EWM uses the information entropy to qualify the entropy weight of index, based on the variation degree of each index (Gao et al., 2018). Fxi was calculated and normalised by standard scoring function (SSF) (Guo et al., 2017), which can avoid variation of the different indicator units. In our study, two types of SSF equations, S and reverse S, were chosen to standardise the alluvial fan development indicators. The area and perimeter were standardised by S equation, according to Figure 5. The height and slope gradient were standardised by reverse S equation. The two equations can be described as follows:
Type S:$f(x)=\left\{ \begin{align} & \text{0}\text{.1 }x<{{x}_{\text{min}}}\text{ } \\ & 0.1+{{\frac{0.9\times (x-{{x}_{\text{min}}})}{{{x}_{\text{max}}}-{{x}_{\text{min}}}}}^{{}}}\text{ }{{x}_{\text{min}}}<x<{{x}_{\text{max}}} \\ & \text{1 }x\text{}{{x}_{\text{max}}} \\ \end{align} \right.$,
Type reverse S:$f(x)=\left\{ \begin{align} & \text{0}\text{.1 }x<{{x}_{\text{min}}}\text{ } \\ & 1-{{\frac{0.9\times (x-{{x}_{\text{min}}})}{{{x}_{\text{max}}}-{{x}_{\text{min}}}}}^{{}}}{{x}_{\text{min}}}<x<{{x}_{\text{max}}} \\ & \text{1 }x\text{}{{x}_{\text{max}}} \\ \end{align} \right.$,
where f(x) is the score of the indicator that ranges between 0.1 and 1; x is the value of the indicator; and xmin and xmax are the minimum and maximum values of the indicators, respectively.

2.2.2 Independent parameter obtainment

The morphology, lithology, vegetation, rainfall, glacier and snow of the matching catchment are selected as independent parameters, according to existing research. The morphology of catchment determines the energy conditions of runoff. Lithology and vegetation are the factors that affect the material amount from matching catchment (Harvey et al., 1999; Nichols and Thompson, 2010). Rainfall, glacier and snow determine the characteristics of runoff, which are directly provide energy for alluvial fan development.
Eleven parameters related to morphology were selected (Table 2, 1-11). Examples of the parameters are catchment area (CA), catchment perimeter (CP), catchment slope gradient (CSG), catchment slope aspect (CSA), catchment relief (CR), catchment relief ratio (CRR), catchment drainage density (CDD) and catchment shape coefficient (CSC). CSA indirectly affects the weathering material amount by influencing solar radiation. The slope could be divided into four classes (Huang et al., 2015), including sunny slope (157.5°-247.5°), half-sunny slope (112.5°-157.5°, 247.5°-292.5°), shady slope (0°-67.5°, 337.5°-360°) and half-shady slope (67.5°-112.5°, 292.5°-337.5°), according to the aspect angle. The percentage between the area of a class and the total area of a catchment is regarded as an independent parameter to illustrate the function of an aspect on alluvial fan development in a more detailed way. The other parameters include sunny slope percentage (CSA1), half-sunny slope percentage (CSA2), shady slope percentage (CSA3) and half-shady slope percentage (CSA4). CR is the elevation difference between the top and the outlet of a catchment (Zhou et al., 2016). CRR is the ratio between CR and horizontal distance of the main stream, which indicates the overall steepness of catchment. CDD is the ratio between total drainage length and CA. CSC is an important factor for runoff velocity of a catchment, and it is defined as the ratio of an actual catchment perimeter to a circular catchment perimeter of the same area. The larger the CSC, the more circular the catchment is. The relationships can be expressed Eq. (4) as follows:
CSC = Pt/Pc = Pt/(4πA)1/2,
where CSC is the shape coefficient of a catchment, Pt is the true perimeter of a catchment (km), Pc is the parameter of a circle catchment with the same area of true catchment (km), and A is the area of catchment (km2).
Table 2 Brief of the 15 matching catchment independent parameters of alluvial fans
No. Name of parameter Abbreviation Unit Range
1 Catchment area CA km² 0.16-490.77
2 Catchment perimeter CP km 1.51-125.78
3 Catchment average slope gradient CSGa ° 4.91-36.34
4 Sunny slope percentage CSA1 % 0-100
5 Half-sunny slope percentage CSA2 % 0-100
6 Shady slope percentage CSA3 % 0-100
7 Half-shady slope percentage CSA4 % 0-100
8 Catchment relief CR m 80-2283
9 Catchment relief ratio CRR m/m 0.35-1
10 Catchment drainage density CDD km/km2 2.61-10.65
11 Catchment shape coefficient CSC / 1.08-2.49
12 Catchment average rock hardness RHa / 1-5
13 Catchment average NDVI VIa / 0.14-0.80
14 Average annual rainfall Ra mm 409-759
15 Average annual glacier and snow cover GSa km2 0-0.01
The 11 parameters were achieved using the DEM (ALOS) and calculated by the tools of ArcGIS, including the Calculate Geometry, Slope, Aspect, Spatial Analyst and Regional Statistical Analysis.
The two factors of material for alluvial fan development are lithology and vegetation (Table 2, 12 and 13). The data related to lithology and vegetation cannot be quantified in terms of catchment. The study was confined to lithology and vegetation because of this issue. The solution was as follows. The lithology data were obtained by vectorisation of the geological map of 1:250,000 scale (Figure 6). The lithology in this area is intricate. Many exposures from the Ordovician and Carboniferous to the Neogene and Quaternary can be observed, with the exception of Jurassic and Cretaceous strata (Figure 6). The lithology data in a catchment was classified as very soft (Quaternary loose material), soft (Paleozoic stratified intermediate and acid intrusive rocks, clastic rocks), medium (Cenozoic stratified schistose intrusive rocks, clastic rocks), hard (Cenozoic and Mesozoic stratified intermediate-acid and acid intrusive rocks) and very hard (Cenozoic and Mesozoic stratified basic and intermediate intrusive rocks) according to the hardness of the rock (Zhao et al., 2020). Meanwhile, five degrades (1-5) were assigned in ArcGIS (Figure 7). Then, Regional Statistical Analysis of ArcGIS was used to obtain the average rock hardness (RHa) of every catchment unit. The RHa was regarded as an independent parameter. In this study, the mean annual NDVI was used to represent vegetation. The NDVI (2000-2018) with a 250 m resolution was obtained from the National Qinghai-Tibet Plateau Data Center (Du, 2019). This parameter cannot be assigned a value in a catchment. The processing of NDVI data was similar to that of lithology data. The NDVI was classified into low (0-0.2), middle-low (0.2-0.4), middle (0.4-0.6), middle-high (0.6-0.8) and high (0.8-1) in ArcGIS. Then, five degrades (1-5) were assigned. Finally, the average NDVI of every catchment unit (VIa) was calculated using the same lithology data processing method.
Figure 6 Geological map of the Lhasa River Basin
Figure 7 Distribution of rock hardness in the Lhasa River Basin
The two hydrologic factors for alluvial fan development are rainfall and glacier and snow. The alluvial fan is a sedimentary landform that has been affected by runoff over many years.
The main source of the runoff is from the confluence of rainfall and melting of glacier and snow. Accordingly, the average annual rainfall (Ra) and average annual cover of glacier and snow (GSa) (Table 2, 14 and 15) were selected. The annual rainfall data (1990-2015) with 1 km resolution was obtained from the National Qinghai-Tibet Plateau Data Center. The glacier and snow cover data (2000, 2010 and 2020) with a 30 m resolution was obtained from GlobeLand30 (http://www.globallandcover.com/home_en.html?type=data). The Ra and GSa of catchment unit were calculated in ArcGIS using Calculate Geometry and Regional Statistical Analysis.

2.2.3 Parameter assignment and preprocessing

A database for the 826 catchment and alluvial fan had been built, with 15 independent parameters and four dependent parameters. The 826 data were randomly divided into three parts in the proportions of 72%, 18% and 10% in accordance with previous studies (Bengio et al., 2016), including 595 training samples, 149 validating samples and 82 testing samples. Then, the 826 data were subjected to min-max standardisation.
Detecting parameters with high correlation and multicollinearity is an important step to parameter preprocessing (Heiser et al., 2015). According to the proposal of previous research (Dormann et al., 2013), removing the parameters with correlation coefficient greater than 0.7 will effectively overcome the multicollinearity of the models. Therefore, the CP, CR, CSA3 and CSA4 were removed according to the correlation matrix of the independent parameters (Table 3), thereby ensuring that the models will not have the problems of high correlation and multicollinearity. Finally, the remaining 11 parameters were used in the modelling.
Table 3 Correlation analyses between Di and independent parameters
Di CA CP CSGa CSA1 CSA2 CSA3 CSA4 CR CRR CDD CSC Rha VIa Ra GSa
1.000 0.580** 0.641** 0.057 0.097** -0.004 0.028 -0.003 0.190** 0.198** -0.076* 0.527** -0.249** -0.256** -0.208** 0.126**
1.000 0.979** 0.026 0.088* 0.030 0.052 0.024 0.729** -0.117** 0.149** 0.296** -0.127** -0.159** -0.126** 0.236**
1.000 0.033 0.093** 0.024 0.051 0.020 0.686** -0.080* 0.106** 0.468** -0.144** -0.191** -0.160** 0.189**
1.000 0.051 -0.007 -0.049 -0.009 0.065 0.017 0.027 0.067 -0.025 0.048 -0.136** -0.013
1.000 0.541** -0.866** -0.803** 0.033 0.046 -0.022 0.056 -0.425** -0.131** -0.100** 0.024
1.000 -0.743** -0.427** 0.025 0.022 -0.047 -0.028 -0.267** -0.173** 0.005 0.032
1.000 0.578** 0.033 -0.046 -0.025 0.018 0.377** 0.108** 0.031 -0.003
1.000 0.024 -0.042 0.034 0.005 0.362** 0.104** 0.102** 0.008
1.000 -0.481** 0.351** 0.095** -0.073* -0.047 -0.086* 0.121**
1.000 0.129** 0.123** -0.011 -0.026 -0.061 -0.031
1.000 -0.121** 0.084* 0.108** -0.028 0.040
1.000 -0.146** -0.193** -0.221** -0.130**
1.000 0.267** 0.146** -0.140**
1.000 0.074* -0.343**
1.000 0.119**
1.000

Note: * is a significant correlation at the 0.05 level, ** is a significant correlation at the 0.01 level. The bold fonts represent the value of correlations greater than 0.7. A Spearman correlation analysis was conducted via SPSS 19.0 (SPSS Inc. Chicago, USA)

2.2.4 Running different machine learning algorithms

The machine learning algorithms of regression used in this study were run on python, enabling us to develop predictive models using successful library packages. The 10 packages with different characteristics were used to create a model, and they were obtained from https://www.anaconda.com/. The mechanisms were classified two types of algorithms. The first type includes simple machine learning algorithms, including Bayesian Ridge, Linear Regression, ARD Regression, Decision Tree and Support vector machine. The decision boundary of these algorithms is relatively simple. The second type includes ensemble learning algorithms, such as Gradient Boost Decision Tree, Random Forest, Adaboost, EXtree and XGBoost. The decision boundary of these algorithms is more detailed. Accordingly, the generalisation ability is better.

2.3 Testing the accuracy of different machine learning models

The regression algorithms used in the study were separately run on Python. The training samples were inputted into each algorithm one by one to create a series of algorithms using the automatic regressors. Subsequently, a series of primary machine learning model was produced. Thereafter, the regression models were tested. The optimal models were selected in 11 regression algorithms according to the coefficient of determination (R2). The closer the value of R2 is to one, the closer the predicted value of the models is to the true value. Therefore, the accuracy and performance of regression models is better when R2 is higher. The equation of R2 is expressed as follows:
${{R}^{2}}=1-\frac{S{{S}_{res}}}{S{{S}_{tot}}}=1-\frac{\sum{{{({{y}_{i}}-{{f}_{i}})}^{2}}}}{\sum{{{({{y}_{i}}-\bar{y})}^{2}}}}$,
where R2 is the coefficient of determination, SSres is the sum of squares of residuals, SStot is the total sum of squares, yi is the true Di calculated by equation (1), fi is the Di estimated by models, and $\bar{y}$ is the mean of yi.

2.4 Optimising different machine learning models

Validating data and grid search were used to optimise different machine learning models. The validating data were inputted into the primary models. Meanwhile, the grid search is used to adjust the parameters of the models, which can be achieved by calling Model_select.GridSearchCV in Scikit-learn (Pedregosa et al., 2011). The method can optimise models using optimal parameters. Grid search uses the exhaustive search method; thus, it consumes a substantial amount of computer processing time. Under the initial conditions, any parameter adopts the default parameters, and the performance of the initial model is checked by fitting data. The parameters are coarsely adjusted first and then finely modified to continuously narrow the search range and select some models as alternative models with good performance from a group of more than 10 models. For example, the learning rate of model parameters, the maximum depth of tree, the maximum value of leaves and other parameters are adjusted in the EXtree model, and the optimal value of each parameter is determined by gridding search, resulting in the best performance (R2).

2.5 Testing the generalisation ability of the alternative models

The generalisation ability of the model is not only an important aspect to test whether it can be widely applied but also an important reference to evaluating whether it can be regarded as an excellent model. The better the generalisation ability of the model, the easier it is to be popularised and applied. The models with a relatively high R2 are selected as the alternative models of the final model according to the modeling results of 2.4 after being optimised. Then, the final model is determined by the testing results of the generalisation ability of the alternative models.
Three other basins, except the LRB in the Qinghai-Tibet Plateau, were selected, including the Danupu, Niyangqu and Bayin River Basins (Figure 8), and 10 alluvial fans were randomly selected in each basin. The distances between the LRB and Danupu, Niyangqu and Bayin River Basins are 195.91, 310.42 and 1016.72 km, respectively (Figure 8). The data of the 10 alluvial fans and matching catchments are obtained according to the steps in 3.1-3.3. These 30 data sets are used to test the generalisation ability of the alternative models in determining the final model. Finally, the relative feature importance of the final model is produced in the feature engine, which can provide the contribution of an independent parameter for alluvial fan development (Di).
Figure 8 Sample sites of alluvial fans in the Qinghai-Tibet Plateau (QTP)

3 Results

3.1 Primary model results

The primary results are shown in Figure 9. The results of the ensemble learning algorithms are more accurate than those of the single learning algorithms. The three ensemble models are Gradient Boost Decision Tree, Random Forest and XGBoost (R2 > 0.5), which have relatively good performance in predicting the value of the test samples. The R2 of XGBoost is close to 0.7. The performance ratings of all single models are lower than those of the ensemble models. The R2 values of these models are not more than 0.5. The R2 values of Linear regression, ARD Regression and Decision Tress are not more than zero. Therefore, Gradient Boost Decision Tree, Random Forest and XGBoost can be regarded as the final models with at least 50% illustrations for alluvial fan development. The result comparison of the two types of models also reflects that the ensemble algorithms have better validation ability in testing the samples. The predicted values of the ensemble models are close to the true Di of testing samples, especially for some extreme values (Figure 9b).
Figure 9 Primary results of different types of models

3.2 Optimisation results of the model

The optimisation results are shown in Figure 10 after grid research. The R2 values of Gradient Boost Decision Tree and XGBoost reached 0.782 and 0.870, respectively (Figure 10b). Thus, Gradient Boost Decision Tree and XGBoost showed excellent performance in predicting the Di of alluvial fan by independent factors. The results of the single models optimised by grid research are basically equal to the values before optimisation. Therefore, Gradient Boost Decision Tree and XGBoost can be considered alternative models for the final model of alluvial fan development.
Figure 10 Optimisation results of different types of models

3.3 Generalisation ability of the alternative models

The testing results of the two alternative models in three basins are shown in Table 4. Both alternative models follow the same pattern: their generalisation ability decreases as the distance from the LRB increases. Specifically, the model may have better prediction results in the area close to the LRB under the current conditions in this research. XGBoost has a better generalisation ability than Gradient Boost Decision Tree because its accuracy is higher than that of Gradient Boost Decision Tree in the Danupu, Niyangqu and Bayin River Basins. The R2 of XGBoost in the Danupu River Basin, which is the closest basin to the LRB, is 0.670. Specifically, the accuracy of XGBoost in the Danupu River Basin is close to 0.7. Thus, the XGBoost is chosen as the final model.
Table 4 Testing results of the generalisation ability of the alternative models
River basin Gradient Boost Decision Tree (R2) XGBoost (R2)
Danupu River Basin 0.569 0.670
Niyangqu River Basin 0.277 0.389
Bayin River Basin 0.093 0.297

3.4 Feature importance of the final model

The relative feature importance amongst the 11 independent parameters is shown in Figure 11. The feature importance of CA is highest (17.88%), indicating that CA is the most environmental parameter for alluvial fan development (Di). The sum value of the geomorphological parameters, including CA, CSGa, CSA1, CSA2, CDD, CSC and CRR, is 74.60%. The sum value of the material parameters, including VIa and RHa, is 14.42%. Meanwhile, the sum value of the hydrological parameters, including Ra and GSa, is 10.98%. Therefore, the geomorphological parameters are the major influencing factor for alluvial fan development in the LRB.
Figure 11 Relative feature importance of the independent parameters

4 Discussion

4.1 Model characteristics

The accuracy rates of the single models (Bayesian Ridge, Linear Regression, Support Vector Machine and Decision Tree) are lower than those of the ensemble models (Adaboost, Gradient Boost Decision Tree, Random Forest, EXtree and XGBoost) (Figure 9). The reason is that the ensemble algorithms use the multiple single learning algorithms to process data. These types of algorithms combine the previous single machine learning algorithms and become integrated models with a strong prediction ability (Kim et al., 2003). The ensemble models can be divided into two categories according to the relationship between integrated single models. The first categories have strong dependence amongst the single models, and they serially generate results, such as AdaBoost and Gradient Boost Decision Tree. The second categories have no strong dependence amongst the single models, and they can synergistically generate results, such as EXtree and XGBoost (Sagi and Rokach, 2021). Although the prediction accuracy of each single model is weak, it will be significantly improved after model combination. The ensemble models will achieve a strong learner with superior generalisation ability (Kim et al., 2003).
The accuracies of Gradient Boost Decision Tree and XGBoost are 0.782 and 0.870, and they have the same excellent prediction ability for Di, but XGBoost is better in terms of algorithm and computing speed (Chen and Guestrin, 2016). The algorithms used in these two models actually have an evolutionary relationship. XGBoost uses the second derivative information in its algorithm, whilst Gradient Boost Decision Tree only uses the first derivative. Therefore, XGBoost is more efficient than Gradient Boost Decision Tree and supports parallel operation at a faster speed. In addition, XGBoost explicitly adds the complexity of the Tree as a regular term to the optimisation objective; thus, it has a high prediction accuracy (Sagi and Rokach, 2021). These two models can be regarded as alternative models without considering the calculation cost. However, XGBoost is superior to Gradient Boost Decision Tree algorithm in terms of the number of parameters handled and the calculation speed. This superiority will be more clearly expressed when the amount of data is enough. However, XGBoost is far better than Gradient Boost Decision Tree in terms of algorithm and computing speed. This superiority can also be confirmed by comparing the generalisation ability of these models.

4.2 Generalisation ability of the two alternative models

Generalisation ability is an important standard for evaluating the utilising potential of models. The generalisation ability performance of the alternative models determines the generalisation ability in other regions. Danupu, Niyangqu and Bayin River Basins have 30 alluvial fans (10 samples for each basin) (Figure 8). Those three groups of data from the three basins were inputted into two alternative models (XGBoost and Gradient Boost Decision Tree) to test their generalisation ability. The generalisation ability of the models is weaker as the distance from the LRB increases. The reason for the differences in the performances of the alternative models in those three regions is the changes of environmental factors on alluvial fan development. The Danupu River Basin is located in the middle reaches of the Yarlung Zangbo River, which is the same with the LRB. These basins belong to the same tectonic division (Pan et al., 2009), geomorphological division (Wang et al., 2020) and climate division (Zheng et al., 2013). Accordingly, the background environment of these basins would be similar. Therefore, the performance of the XGBoost of Danupu River Basin is relative good. The current model should be applied to the region where the background environment is similar to the LRB. Meanwhile, XGBoost has better generalisation ability than Gradient Boost Decision Tree due to its higher accuracy (Table 4). Therefore, XGBoost is chosen as the final model.
In comparison with the LRB, the performance of the final model in Niyangqu and Bayin River Basins is low due to the differences in the background environment, including tectonic, geomorphology and climate (Pan et al., 2009; Zheng et al., 2013; Wang et al., 2020). However, low performance does not mean that the final model cannot be applied to the Niyangqu and Bayin River Basin, as well as in other regions. The current results of the generalisation ability are not based on the fact that no data belonging to these three new basins are added to the training sample of XGBoost. If a certain amount of data on alluvial fans from other regions is acquired and added to the training samples in the final model built by our research, then the performance should be more satisfactory (Webb et al., 2010; Dolnicar et al., 2016). Specifically, the results of the generalisation ability of XGBoost obtained before adding any training samples belonging to the other regions are 0.670 in Danupu River Basin, 0.389 in Niyangqu River Basin and 0.297 in Bayin River Basin. If some new data of alluvial fans and its matching catchment belonging to these three basins are added to the training samples of XGBoost, then the generalisation ability performance will be improved. The amount of training samples in different regions will be quantified in the future. Hence, the final model still has potential to be applied in the QTP and other regions under the premise of adding training samples from different regions.

4.3 Main factor of alluvial fan development

The geomorphological characteristics of catchment for alluvial fan development in the LRB are significant factors. The factors of alluvial fan development in this research were divided into three parts, namely, geomorphological factors (Table 2, from 1 to 11), material factors (Table 2, 12 and 13) and hydrological factors (Table 2, 14 and 15). The sum value of the relative feature importance (Fi) of geomorphological factors is 76.09% (Figure 11). The Fi of catchment area (CA) can reach 17.88% only on these parameters. Meanwhile, the sum Fi of material factors (catchment average rock hardness and NDVI) and hydrological factors (average annual rainfall, glacier and snow cover) are 14.42% and 10.98%, respectively. Therefore, the independent parameters related to geomorphology are the main influencing factors for alluvial fan development.
The importance of geomorphology for alluvial fan development in this research is consistent with those of the High Atlas Mountains in Morocco (Stokes and Mather, 2015), which is located in semi-arid area, similar to the LRB. The main influencing factor of alluvial fan development in this mountain is also the geomorphology of matching catchment because the catchments with alluvial fan have higher relief, larger area, lower slope and longer length compared with those without alluvial fan (Stokes and Mather, 2015). However, our research conclusion is inconsistent with the volcanic islands in the east-central Atlantic Ocean and Calabria in the southern Italy (Antronico et al., 2016; Stokes and Gomes, 2020). The volcanic island is located in the tropical arid climate, and the main influencing factor of alluvial fan development is the accommodation space amongst volcanic mountain, although the rock strength, climate and base level also have influences on the alluvial fan development. Specifically, the accommodation space and the alluvial fan are large (Stokes and Gomes, 2020). The main influencing factor for the alluvial fan development in the Calabria is the lithology of the matching catchment because the lithologies of most catchments of alluvial fans are low-grade metamorphic rocks, shales and igneous rocks.
The geomorphological features of the matching catchment are the main influencing factor of alluvial fan development in LRB. The two main reasons are as follows. Firstly, the LRB has less precipitation, and the formation of alluvial fan mainly depends on the flood processes. Forming a flood under this semi-arid condition requires enough large catchment to collect more runoff, and the shape of the catchment makes it easy to gather runoff. Six independent parameters related to geomorphology have a significant positive relationship with Di (Table 3). The values of the catchment area, catchment perimeter, catchment relief, catchment relief ratio and catchment shape coefficient are high, and the conflux of runoff is substantial, thereby increasing the amount of weathering material carried by runoff from catchment to alluvial fan (Stokes and Mather, 2015). The sixth geomorphological parameter is sunny slope percentage of catchment, which also have a significant positive relationship with Di. Meanwhile, the half-sunny slope percentage, shady slope percentage and half-shady slope percentage have no significant relationship with Di. Alluvial fan development is simpler in catchments with higher sunny slope percentage. Specifically, the sunny slope has a greater ability to produce more weathering materials with more variable-temperature condition as a result of achieving more radiation from the sun (Ran and Liu, 2018). Therefore, geomorphology plays an important role in the development of alluvial fans in this area. Secondly, the growth of vegetation and chemical weathering of rocks are limited because of the high altitude, low temperature and little precipitation in the LRB (Chen et al., 2022). Therefore, factors, such as precipitation and vegetation, have less influence on the development of alluvial fan than the landform of catchment area.
The two independent parameters of catchment average rock hardness and catchment average NDVI directly related to material have a negative relationship with Di. A catchment with high rock hardness cannot easily produce weathering materials because the rock is harder to be weathered. Therefore, weathering materials carried by runoff from catchment to alluvial fan are less (Mather and Stokes, 2017). Meanwhile, weathering materials are less in a catchment with high catchment average NDVI because vegetation can fix the weathering materials. There are two independent parameters about hydrology (average annual rainfall and average annual glacier and snow cover), but they have opposite effects for alluvial fan development (Table 3). The average annual glacier and snow cover has a positive relationship with Di. The data are consistent with that of LRB. The alluvial fan is large, developed in the area with high glacier and snow cover, especially in the Damshung county (Chen et al., 2021). The more glacier and snow cover can produce more runoff or floods that is the energy source to carry on the weathering materials in the catchment. However, the Ra (average annual rainfall) has a significant negative correlation with alluvial fan development. The data match with those of the LRB. The alluvial fan in Damshung county is large, with low average annual rainfall. There are three reasons for the phenomenon. The alluvial fan is a landform due to a series of flooding processes, and the flooding processes depend on the extreme runoff transformed by quick and extreme events of glacier-snow melting or rainfall (Santangelo et al., 2012). Thus, the first reason for the above phenomenon is that the function of rainfall to alluvial fan development may indirectly work by average annual glacier and snow cover. The temperature of Damshung county is lower than those of the other parts of LRB (Qiao et al., 2020). Therefore, the glacier and snow are easier produced and stored, although the average annual rainfall is low. Specifically, this place should have more possibility of producing flooding processes. Secondly, the average annual rainfall may not totally reflect the extreme rainfall events. Thirdly, the time of alluvial fan development (since Quaternary) is not matched with rainfall data (1990-2015) in this research. This phenomenon can be clearly illustrated under the more detailed spatiotemporal rainfall data in the future.
The other factors, such as tectonic activity, historical climate, accommodation space and human activities (Bahrami et al., 2015; Ventra and Clarke, 2018), also affect the alluvial fan development in the LRB, although those factors were overlooked in our research due to the limitation and shortage of data. For example, human activities are also one of the important factors that affect the alluvial fan development. In the process of development, houses, terraces, canals and roads could be built the surface of the alluvial fan, which could change the shape of an alluvial fan (Bahrami et al., 2015; Chen et al., 2021). These factors are difficult to quantify and add to the model, which may be one of the main reasons for the 13% unillustrated variance of final model. The two other possible reasons for the unillustrated variance are as follows. Firstly, although the highest precision geological map published at present has been used in final model, its scale is still larger than that of alluvial fan. Secondly, the vegetation and precipitation data used in final model do not completely match the alluvial fan development. Vegetation and precipitation have been monitored in the past few decades. However, these factors could not reflect all influences on the alluvial fan development in the historical period to a certain degree.
Although the geology, vegetation and precipitation data in this work are not highly accurate, they can reflect the influence of these three factors on the alluvial fan development to a certain extent. The two main reasons are as follows. Firstly, geology is a regional concept, and no big change in a small range can be observed (Zhao et al., 2020). Secondly, some studies have shown that since the early Holocene (11,700 yr BP), the climate suitable for forest growth around Lhasa has disappeared and turned into a semi-arid environment with little rain, although the climate of the QTP has shown signs of warming and wetting in recent years. Since then, the surface vegetation type has changed from forest to modern vegetation dominated by sparse herbs and shrubs; meanwhile, the modern vegetation has been in a relatively stable state for a long time (Kaiser et al., 2009; Miehe et al., 2014; Zhang et al., 2018).
Despite that an unillustrated variance (0.130) exists in our research, the 0.870 accuracy (R2) of XGBoost (final model) remains, and geomorphology should be the most important factor in alluvial fan development.

5 Conclusions

Alluvial fans and relative environmental factors in the LRB were selected for moulding to illustrate the alluvial fan development. The main conclusions are as follows: (1) The results of the ensemble learning algorithms are more accurate than those of the single learning algorithms. The three ensemble models are Gradient Boost Decision Tree, Random Forest and XGBoost (R2 > 0.5), which have relatively good performance in predicting the value of the test samples. (2) After grid research, Gradient Boost Decision Tree and XGBoost are showed excellent performance in predicting the Di of alluvial fan by independent factors. The R2 values of Gradient Boost Decision Tree and XGBoost reached 0.782 and 0.870, respectively. (3) The model built by XGBoost is selected as the final model due to its better algorithm, computing speed and generalisation ability. Specifically, XGBoost has a better generalisation ability than Gradient Boost Decision Tree because its accuracy is higher than that of Gradient Boost Decision Tree in the Danupu, Niyangqu and Bayin River Basins. The accuracy of XGBoost in the Danupu River Basin closest to the Lhasa River Basin is close to 0.7. Therefore, the model has better prediction results in the area close to the Lhasa River Basin. (4) The independent parameters related to geomorphology are the main influencing factors for alluvial fan development, especially catchment area. The sum value of the relative feature importance of geomorphological factors is 76.09%. The feature importance of catchment area can reach 17.88% only on these parameters. Meanwhile, the sum feature importance of material factors (catchment average rock hardness and NDVI) and hydrological factors (average annual rainfall, glacier and snow cover) are 14.42% and 10.98%, respectively. Therefore, the XGBoost is the best model to predict the alluvial fan development in which the geomorphological parameters are the most important factors.
[1]
Alipour A, Ahmadalipour A, Abbaszadeh P et al., 2020. Leveraging machine learning for predicting flash flood damage in the Southeast US. Environmental Research Letters, 15(2): 1-13.

[2]
Antronico L, Greco R, Sorriso-Valvo M, 2016. Recent alluvial fans in Calabria (southern Italy). Journal of Maps, 12(3): 503-514.

DOI

[3]
Bahrami S, Fatemi A S M, Bahrami K et al., 2015. Effects of weathering and lithology on the quality of aggregates in the alluvial fans of Northeast Rivand, Sabzevar, Iran. Geomorphology, 241: 19-30.

DOI

[4]
Bengio Y, Courville A, Goodfellow I J, 2016. Deep learning:Adaptive Computation and Machine Learning. Cambridge: The MIT Press, 105-107.

[5]
Birch S P D, Hayes A G, Howard A D et al., 2016. Alluvial fan morphology, distribution and formation on Titan. Icarus, 270: 238-247.

DOI

[6]
Blair T C, 2002. Cause of dominance by sheetflood vs. debris-flow processes on two adjoining alluvial fans, Death Valley, California. Sedimentology, 46(6): 1015-1028.

DOI

[7]
Calvache M L, Viseras C, Fernd́ez J, 1997. Controls on fan development: Evidence from fan morphometry and sedimentology; Sierra Nevada, SE Spain. Geomorphology, 21(1): 69-84.

DOI

[8]
Chen B B, Gong H L, Li X J et al., 2017. Characterization and causes of land subsidence in Beijing, China. International Journal of Remote Sensing, 38(3): 808-826.

DOI

[9]
Chen T, Guestrin C, 2016. XGBoost: A scalable tree boosting system. In:Proceedings of the 22nd ACM SIGKDD International Conference on Knowledge Discovery and Data Mining. Association for Computing Machinery, San Francisco, California, USA, 785-794.

[10]
Chen T D, Jiao J Y, Chen Y X et al., 2021. The distribution and land use characteristics of alluvial fans in Lhasa River Basin in Tibet. Journal of Geographical Sciences, 31(10): 1437-1452.

DOI

[11]
Chen T D, Jiao J Y, Lin H, et al., 2020. Discrimination on types of fan-shaped land and its distinguishing methods. Bulletin of Soil and Water Conservation, 40(4): 190-198. (in Chinese)

[12]
Chen T D, Jiao J Y, Zhang Z Q et al., 2022. Soil quality evaluation of the alluvial fan in the Lhasa River Basin, Qinghai-Tibet Plateau. Catena, 209(1): 1-13.

[13]
Crosta G B, Frattini P, 2004. Controls on modern alluvial fan processes in the central Alps, northern Italy. Earth Surface Processes and Landforms, 29(3): 267-293.

DOI

[14]
Dolnicar S, Grün B, Leisch F, 2016. Increasing sample size compensates for data problems in segmentation studies. Journal of Business Research, 69(2): 992-999.

DOI

[15]
Doran J W, Parkin T B, 1994. Defining and Assessing Soil Quality. John Wiley & Sons, New Jersey, 1-21.

[16]
Dormann C F, Elith J, Bacher V et al., 2013. Collinearity: A review of methods to deal with it and a simulation study evaluating their performance. Ecography, 36(1): 27-46.

DOI

[17]
Dorn R I, 1994. The Role of Climatic Change in Alluvial Fan Development Geomorphology of Desert Environments. London: Chapman and Hall, 593-615.

[18]
Drew F, 1873. Alluvial and lacustrine deposits and glacial records of the Upper-Indus Basin. Quarterly Journal of the Geological, 29(1): 441-471.

[19]
Du Y Y, 2019. Vegetation index data of Qinghai-Tibet Plateau (2000-2018). National Tibetan Plateau Data Center.

[20]
Fernández C V A M, Viseras C, Calvache M et al., 2003. Differential features of alluvial fans controlled by tectonic or eustatic accommodation space. Examples from the Betic Cordillera, Spain. Geomorphology, 50: 181-202.

DOI

[21]
Gao C, Li S, Wang J et al., 2018. The risk assessment of tunnels based on grey correlation and entropy weight method. Geotechnical and Geological Engineering, 36(3): 1621-1631.

DOI

[22]
Géron A, 2019. Hands-on machine learning with Scikit-Learn, Keras, and TensorFlow: Concepts, tools, and techniques to build intelligent systems. Farnham, UK: O'Reilly Media.

[23]
Goswami P K, Pant C C, Pandey S, 2009. Tectonic controls on the geomorphic evolution of alluvial fans in the piedmont zone of Ganga Plain, Uttarakhand, India. Journal of Earth System Science, 118(3): 245-259.

DOI

[24]
Guo L L, Sun Z G, Ouyang Z et al., 2017. A comparison of soil quality evaluation methods for fluvisol along the lower Yellow River. Catena, 152: 135-143.

DOI

[25]
Hartley A J, Weissmann G.S, Nichols G J et al., 2010. Large distributive fluvial systems: Characteristics, distribution, and controls on development. Journal of Sedimentary Research, 80(2): 167-183.

DOI

[26]
Harvey A M, 2002. The role of base-level change in the dissection of alluvial fans: Case studies from southeast Spain and Nevada. Geomorphology, 45(1): 67-87.

DOI

[27]
Harvey A M, 2012. The coupling status of alluvial fans and debris cones: A review and synthesis. Earth Surface Processes and Landforms, 37(1): 64-76.

DOI

[28]
Harvey A M, Wigand P E, Wells S G, 1999. Response of alluvial fan systems to the late Pleistocene to Holocene climatic transition: Contrasts between the margins of pluvial Lakes Lahontan and Mojave, Nevada and California, USA. Catena, 36: 255-281.

DOI

[29]
Heiser M, Scheidl C, Eisl J et al., 2015. Process type identification in torrential catchments in the eastern Alps. Geomorphology, 232: 239-247.

DOI

[30]
Huang Y M, Liu D, An S S, 2015. Effects of slope aspect on soil nitrogen and microbial properties in the Chinese loess region. Catena, 125: 135-145.

DOI

[31]
Kaiser K, Lai Z P, Schneider B et al., 2009. Sediment sequences and paleosols in the Kyichu Valley, southern Tibet (China), indicating Late Quaternary environmental changes. Island Arc, (3): 404-427.

[32]
Kern A N, Addison P, Oommen T et al., 2017. Machine learning based predictive modeling of debris flow probability following wildfire in the intermountain western United States. Mathematical Geosciences, 49: 717-735.

DOI

[33]
Kim H C, Pang S N, Je H M, 2003. Constructing support vector machine ensemble. Pattern Recognition, 36(12): 2757-2767.

DOI

[34]
Li P, Zhang T L, Wang X X et al., 2013. Development of biological soil quality indicator system for subtropical China. Soil and Tillage Research, 126(1): 112-118.

DOI

[35]
Lin H, Jiao J Y, Chen T D et al., 2021. Species composition and diversity of vegetation of diluvial fan in the Lhasa River Basin of Tibet. Research of Soil and Water Conservation, 28(5): 67-75. (in Chinese)

[36]
Lin X D, Zhang Y L, Yao Z J et al., 2008. The trend on runoff variations in the Lhasa River Basin. Journal of Geographical Sciences, 18(1): 95-106.

DOI

[37]
Ma D T, Tu J J, Cui P et al., 2004. Approach to mountain hazards in Tibet, China. Journal of Mountain Science, 143-154.

[38]
Maghsoudi M, Simpson I A, Kourampas N et al., 2014. Archaeological sediments from settlement mounds of the Sagzabad Cluster, central Iran: Human-induced deposition on an arid alluvial plain. Quaternary International, 324: 67-83.

DOI

[39]
Marjanovi M, Kova Evi M, Bajat B et al., 2011. Landslide susceptibility assessment using SVM machine learning algorithm. Engineering Geology, 123(3): 225-234.

DOI

[40]
Mather A E, Stokes M, 2017. Bedrock structural control on catchment-scale connectivity and alluvial fan processes, High Atlas Mountains, Morocco. Geological Society London Special Publications, 440(1): 103-128.

DOI

[41]
Mazzorana B, Ghiandoni E, Picco L, 2020. How do stream processes affect hazard exposure on alluvial fans? Insights from an experimental study. Journal of Mountain Science, 17(4): 753-772.

DOI

[42]
Meinsen J, Winsemann J, Roskosch J et al., 2014. Climate control on the evolution of Late Pleistocene alluvial-fan and aeolian sand-sheet systems in NW Germany. Boreas, 43(1): 42-66.

DOI

[43]
Miehe S, Miehe G, Van L J F N et al., 2014. Persistence of artemisia steppe in the Tangra Yumco Basin, west-central Tibet, China: Despite or in consequence of Holocene lake-level changes? Journal of Paleolimnology, 51(2): 267-285.

DOI

[44]
Nichols G, Thompson B, 2010. Bedrock lithology control on contemporaneous alluvial fan facies, Oligo-Miocene, southern Pyrenees, Spain. Sedimentology, 52(3): 571-585.

DOI

[45]
Pan G T, Xiao Q H, Lu S N et al., 2009. Subdivision of tectonic units in China. Geology in China, 36(1): 1-28. (in Chinese)

[46]
Pedregosa F, Varoquaux G, Gramfort A, 2011. Scikit-learn machine learning in Python. Journal of Machine Learning Research, 12(85): 2825-2830.

[47]
Qiao L, Wang W, Ma Z et al., 2020. Sensitivity analysis of potential evapotranspiration to key climatic factors in the Lhasa River Basin. South-to-North Water Transfers and Water Science & Technology, 18(4): 97-103. (in Chinese)

[48]
Ran Z Z, Liu G N, 2018. Rock glaciers in Daxue Shan, south-eastern Tibetan Plateau: An inventory, their distribution, and their environmental controls. Cryosphere, 12(7): 2327-2340.

DOI

[49]
Sagi O, Rokach L, 2021. Approximating XGBoost with an interpretable decision tree. Information Sciences, 572: 522-542.

DOI

[50]
Santangelo N, Daunis-i-Estadella J, Di C G et al., 2012. Topographic predictors of susceptibility to alluvial fan flooding, southern Apennines. Earth Surface Processes and Landforms, 37(8): 803-817.

DOI

[51]
Sil L, Tesfaalem A, Amaury F et al., 2016. Sediment in alluvial and lacustrine debris fans as an indicator for land degradation around Lake Ashenge (Ethiopia). Land Degradation & Development, 27(2): 258-269.

DOI

[52]
Sorrisovalvo M, Antronico L, Le P E, 1998. Controls on modern fan morphology in Calabria, Southern Italy. Geomorphology, 24(2/3): 169-187.

DOI

[53]
Stock J D, Schmidt K M, Miller D M, 2008. Controls on alluvial fan long-profiles. Geological Society of America Bulletin, 120(5/6): 619-640.

DOI

[54]
Stokes M, Gomes A, 2020. Alluvial fans on volcanic islands: A morphometric perspective (So Vicente, Cape Verde). Geomorphology, 368: 1-15.

[55]
Stokes M, Mather A E, 2015. Controls on modern tributary-junction alluvial fan occurrence and morphology: High Atlas Mountains, Morocco. Geomorphology, 248: 344-362.

DOI

[56]
Sweeney M R, Loope D B, 2001. Holocene dune-sourced alluvial fans in the Nebraska Sand Hills. Geomorphology, 38(1): 31-46.

DOI

[57]
Ventra D, Clarke L E, 2018. Geology and geomorphology of alluvial and fluvial fans: Current progress and research perspectives. London: The Geological Society of London, 1-21.

[58]
Wang N, Cheng W, Wang B et al., 2020. Geomorphological regionalization theory system and division methodology of China. Journal of Geographical Sciences, 30(2): 212-232.

DOI

[59]
Webb R Y, Smith P J, Firag A A F M, 2010. On the probability of improved accuracy with increased sample size. The American Statistician, 64(3): 257-262.

DOI

[60]
Wei Y L, Zhou Z H, Liu G C, 2012. Physico-chemical properties and enzyme activities of the arable soils in Lhasa, Tibet, China. Journal of Mountain Science, 9(4): 558-569.

DOI

[61]
White K, Drake N, Millington A et al., 1996. Constraining the timing of alluvial fan response to Late Quaternary climatic changes, southern Tunisia. Geomorphology, 17(4): 295-304.

DOI

[62]
Zhang Y J, Duo L, Pang Y Z et al., 2018. Modern pollen assemblages and their relationships to vegetation and climate in the Lhasa Valley, Tibetan Plateau, China. Quaternary International, 406: 210-221.

[63]
Zhang Y L, Wang C L, Bai W Q et al., 2010. Alpine wetlands in the Lhasa River Basin, China. Journal of Mountain Science, 20(3): 375-388.

[64]
Zhao C J, 2020. Morphological characteristics of gully on typical alluvial fans and their hydrological response of catchment in the Lhasa River Basin[D]. Yangling: Northwest Agricultural and Forestry University. (in Chinese)

[65]
Zhao Y, Meng X M, Qi T J et al., 2020. AI-based identification of low-frequency debris flow catchments in the Bailong River basin, China. Geomorphology, 359: 1-15.

[66]
Zheng J Y, Bian J J, Ge Q S, 2013. The climate regionalization in China for 1981-2010. Chinese Science Bulletin, 58(30): 3088-3099. (in Chinese)

DOI

[67]
Zhou W, Tang C, Van A T W J et al., 2016. A rapid method to identify the potential of debris flow development induced by rainfall in the catchments of the Wenchuan earthquake area. Landslides, 13(5): 1243-1259.

DOI

Outlines

/