Research Articles

Bank and point bar morphodynamics in the Lower Jingjiang Reach of the Yangtze River in response to the Three Gorges Project

  • WANG Hongyang , 1, 2 ,
  • LU Yongjun , 2, * ,
  • YAO Shiming 3 ,
  • ZUO Liqin 2 ,
  • LIU Huaixiang 2
Expand
  • 1. State Key Laboratory of Water Resources and Hydropower Engineering Science, Wuhan University, Wuhan 430072, China
  • 2. State Key Laboratory of Hydrology-Water Resources and Hydraulic Engineering, Nanjing Hydraulic Research Institute, Nanjing 210029, China
  • 3. Key Laboratory of River Regulation and Flood Control of Ministry of Water Resources, Changjiang River Scientific Research Institute, Wuhan 430010, China
* Lu Yongjun, PhD and Professor, specialized in sediment simulation and waterway regulation. E-mail:

Wang Hongyang, PhD, specialized in hydraulics and river dynamics. E-mail:

Received date: 2021-09-03

  Accepted date: 2021-12-29

  Online published: 2022-10-25

Supported by

Key Program of National Natural Science Foundation of China(U2040219)

National Natural Science Foundation of China(51579015)

Program of National Key Research and Development Plan of China(2016YFC0402108)

Program of National Key Research and Development Plan of China(2016YFC0402103)

Abstract

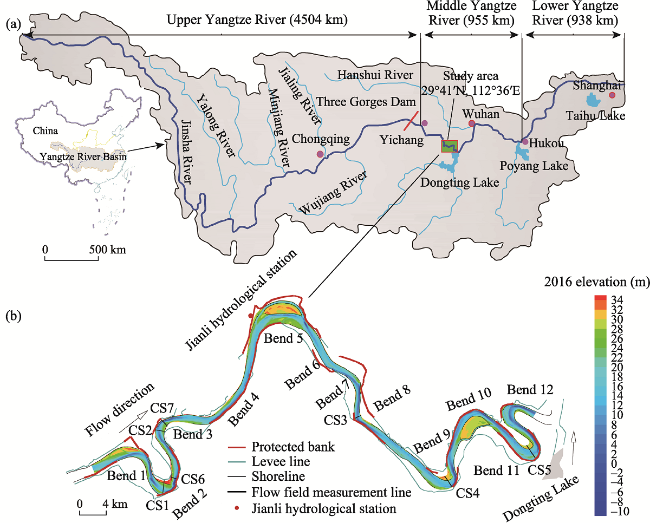
Geomorphic dynamics of alluvial rivers in response to upstream damming have substantial impacts on navigation, habitat protection, and channel stability. The purpose of this study was to determine how flow and sediment regimes, and meander characteristics affect the morphological adjustment of bends in the Lower Jingjiang Reach (LJR) before and after the Three Gorges Project (TGP). Based on detailed field measurements and hydrological and topographic datasets from 1991 to 2016, banks and point bars morphodynamics of 12 continuous bends in the LJR were comprehensively analyzed. Point bars in the LJR mainly experienced a net deposition before the TGP operation, but substantially deteriorated with a net erosion rate of 4.6 million m3 yr‒1 in the post-TGP periods (2003-2016), and erosion on heads and upstream margins of point bars was a general adjustment pattern in the 12 bends. The most significant morphological changes of point bars and banks occurred in 2006-2011, indicating a delayed response of the channel evolution of the LJR to damming. Detailed observations suggested that the medium discharges (16,000-18,000 m3 s‒1) were the most contributive discharges in shaping the morphology of point bars and banks in the LJR after damming. In addition, we revealed the importance of sediment supply on meander deformation of the LJR, driven by sediment exchange over point bars, and more upstream planform deformation tended to occur in bends with high sinuosity (>2.0) in the LJR after damming. The relationship between meander deformation and sinuosity was manifested through the geometric adjustment range of point bars. The morphological adjustments of point bars in the highly curved or compound bends of the LJR were more conducive to cause flow deflections, leading to form concave-bank bars after the TGP operation.

Cite this article

WANG Hongyang , LU Yongjun , YAO Shiming , ZUO Liqin , LIU Huaixiang . Bank and point bar morphodynamics in the Lower Jingjiang Reach of the Yangtze River in response to the Three Gorges Project[J]. Journal of Geographical Sciences, 2022 , 32(8) : 1530 -1556 . DOI: 10.1007/s11442-022-2009-2

1 Introduction

A meandering stream is a ubiquitous pattern of river evolution, but it was still inadequate for understanding the complex morphological dynamics of meandering rivers after damming (Gautier et al., 2010; Ghinassi et al., 2016). Many river systems around the world have been severely altered by dam construction, irrigation projects, and other human activities in recent decades, which can significantly influence natural discharge and sediment regimes downstream (Ollero, 2010; Li et al., 2018). Typically, the modified hydrological characteristics affect not only channel stability, navigation, aquatic habitats, and the formation and number of bars in downstream reaches, but also geomorphology adjustments of meanders (Williams and Wolman, 1984; Ibisate et al., 2011; Zuo et al., 2020).
In terms of river morphology, meandering rivers can be categorized into four groups: simple symmetry, simple asymmetry, compound symmetry, and compound asymmetry. They all demonstrate twisting planforms and a tendency to migrate (Brice, 1974; Hooke, 1984; Hooke, 2011). In general, meander migration is controlled by a number of variables, including curvature, channel width, and instabilities in river flow and sediment load (Parker et al., 2011; Guo et al., 2019). By studying ten point-bar complexes on the Beatton River, Hickin et al. (1975) reported that the rate of bend migration would peak when the ratio of curvature radius to channel width hit approximately 3.0. By observing the spatial distribution of bars over time, Hooke and Yorke (2011) indicated the higher possibility of producing concave bank bars in bends with large curvature. Crosato and Mosselman (2009) also proved that the formation of fluvial bars is controlled by a threshold of width to depth ratio of the channel. Nevertheless, a formal evaluation of the relationships between meander bends morphodynamics and meander characteristics have been restricted by the absence of detailed observations across a range of continuous meandering bends.
The morphological adjustment of meander bends is generally determined by the duration and magnitude of peak flow events and sediment supply from the upstream (Hooke, 2007; Lotsari et al., 2014). However, a channel formation needs two types of flow events: (i) low flows which transport the fine sediment and prevent channel aggradation); and (ii) flood events which shape the channel (Brandt, 2000; Lenzi et al., 2006). Osterkamp et al. (2004) suggested that all flow events that transported or sorted sediment should be responsible for channel formation. Kasvi et al. (2012) indicated that the influence of a flood event on the morphological changes of point bars might depend on the development stage of the bends, and the point bars also might experience lateral growth during low discharge period. In addition, Constantine et al. (2014) demonstrated that rivers with high sediment load could experience higher rates of annual migration and cutoff compared to those with low sediment load. Ahmed et al. (2019) further illustrated that rivers with low sediment load usually develop smaller point bars, which reduce the capacity to increase meander curvature and sinuosity. Nevertheless, the roles of flow frequency and reduced sediment load in the evolution of meander bends under dams remain poorly understood.
Since the TGP operation in 2003, the annual distribution of runoff had been quite different from the natural condition, and its sediment load had dramatically reduced (Fang et al., 2012; Yan et al., 2019). This had caused widespread morphological and hydrodynamic adjustments of meander bends downstream. A recent study reported that some sharp bends in Lower Jingjiang Reach have experienced point bar erosion and concave-bank deposition that resulted in submerged shoal (Zhu et al., 2017). Another study demonstrated that geomorphic adjustments of channel bars in the Yichang-Chenglingji Reach were closely related to the previous four-year flows and sediment regimes, implying a delayed response of the fluvial system to damming (Lyu et al., 2020). However, previous studies mostly focused on the short-term influence of dams on fluvial regime or subsequent morphology of channel cross sections (Ma et al., 2012; Xia et al., 2016). Limited studies explored the damming influence on hydrologic characteristics and geomorphic dynamics in meandering channels. In this paper, detailed hydrological and topographic data for the past 30 years have been collected to analyze how bank and point bar respond to altered flow discharge and sediment load before and after damming.
The main objectives of this study are to increase understanding of the annual morphodynamics of point bars and banks of meandering river in the LJR, including: (i) analyze how magnitude and duration of flow and sediment flux influence the morphodynamics of meander bends before and after the TGP; (ii) present the development patterns of point bar and bank in response to upstream damming; and (iii) evaluate the relationship between meander deformation and meander characteristics in the context of reduced sediment load.

2 Study area

The Yangtze River originates from the Qinghai-Tibet Plateau. It runs across China from west to east and ends in the Pacific Ocean. It is the longest river in China with a total length of 6387 km. According to different hydrological characteristics and geographic settings, it is usually divided into upper (4504 km in length), middle (955 km in length), and lower (938 km in length) reaches. The Jingjiang Reach (347 km in length) is located between Zhicheng and Chenglingji in the Middle Yangtze River (MYR), and it is generally divided into the Upper Jingjiang Reach (UJR, 172 km in length) and the Lower Jingjiang Reach (LJR, 175 km in length), bounded by Ouchikou (Cao and Wang, 2015; Yu, 2017).
The LJR between Ouchikou and Chenglingji is located at 274 km downstream of the Three Gorges Dam (TGD). The LJR is a typical and extremely developed meandering channel. It consists of 12 consecutive bends, despite that Bend 5 is a branching channel. The riverbanks in the LJR contain a typical two-layer structure made up of a silty-clay layer (several meters in thickness) in the upper bank and a medium-fine sand layer (about 30 m in thickness) in the lower bank (Xia et al., 2014; CWRC, 2017). Moreover, the riverbed in the LJR is mainly composed of fine sand with grain size varies from 0.1mm to 0.25 mm (Yu, 2017), this boundary condition is favorable for the formation of stable meander with small radius. The gradient of the LJR (about 5.5×10‒5-6.5×10‒5) is usually gentle and stable (Yu, 2017), which is conducive to the development of meandering.
In order to combat extreme flooding, abundant bank revetments have been constructed along the both banklines in the LJR, including the outer banks of the bend apexes and the part of upstream inner banks (Figure 1b). According to incomplete statistics (Table 1), the length of protected banks in the study area has reached at least 120 km before the TGP operation (Yu and Lu, 2008; CWRC, 2017), accounting for approximately 60% of the total length, and the riprap protection of bank was mainly applied in the LJR. Hence, the LJR gradually developed into a restricted meandering channel with smooth and continuous bank protection works, and the river regime had been controlled effectively. The hydrological conditions of the LJR are monitored by the Jianli hydrological station, which is located at the middle of the LJR (about 347 km downstream of the TGD).
Figure 1 Sketch maps of the study area: (a) Yangtze River Basin and (b) Lower Jingjiang Reach with locations of measured cross sections and Jianli hydrological station
Table 1 Sources of data
Data type Station Period Sources
Daily discharge Jianli 1991-2016 CWRC
Daily water level Jianli 1991-2016 (excluding 1996 and 1997) CWRC
Daily suspended sediment concentration Jianli 1991-2016 CWRC
Topographic data Topographic digital mapping 1991, 1996, 1998, 2002, 2006, 2011, 2016 CWRC

Note: The topographic data source of this paper was the digital AutoCAD mapping (1:10 000) of the LJR measured and drawn by the Hydrology and Water Resources Survey Bureau of Jingjiang River.

3 Materials and methods

3.1 Data collection and fluvial regimes

To better understand the influence of flow and sediment regimes on the continuous geometry variations of point bars and banks in the LJR, detailed and long-term data series before and after the TGP are required. Therefore, we collected the daily discharge, water levels, suspended sediment concentration and sediment load at the Jianli hydrological station for 1991-2016 from the Changjiang Water Resources Commission (CWRC). We also obtained the annual topographic data of the LJR from the CWRC (Table 1). These data can be used to quantitatively analyze the fluvial and morphological characteristics of meander bends before and after the TGP operation.
Figure 2 display the hydrograph of the Jianli hydrometric station from 1991 to 2016. The flood peaks (around 27,700-44,000 m3 s‒1) before the TGP (1991-2002) were higher than those (about 22,900-41,000 m3 s‒1) after the TGP (2003-2016). Apparently, the TGP operation was able to regulate the flow by suppressing the peaks and elevating the troughs. Affected by the TGP operation, the low-water level increased slightly, and the suspended sediment concentration had also experienced a significant dilution.
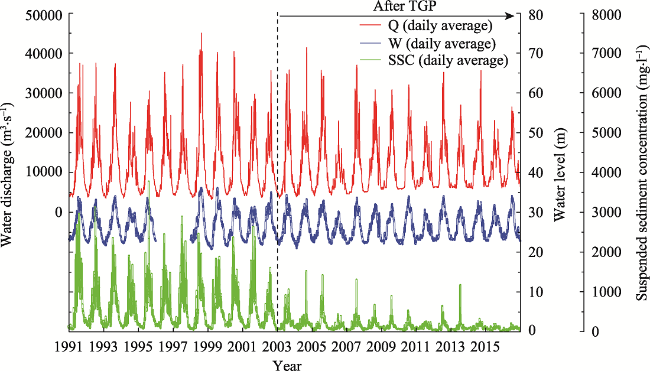
Figure 2 Variations of daily discharge, water level, and suspended sediment concentration at the Jianli hydrological station from 1991 to 2016
According to several channel related properties (low water level, water level parallel to the point bar, and floodplain), we classified the channels of the LJR into the low-flow (5000 m3 s‒1), basic (10,000 m3 s‒1), and bankfull (22,000 m3 s‒1) channels. According to the morphological features, we also classified the 12 bends along the LJR into four groups (Table 2): simple symmetric (Bend 7), simple asymmetric (bends 1, 4, 5, 6, 8, 9 and 10), elongated simple asymmetric (Bend 12), and compound asymmetric (bends 2, 3 and 11). The elongated simple asymmetric and compound asymmetric bends have higher sinuosity compared to the simple symmetric and simple asymmetric bends (almost less than 2.0).
Table 2 Characteristics of the 12 consecutive bends in the Lower Jingjiang Reach
Bends Length of protected bank (km) Chord length (m) Thalweg length (m) Sinuosity Radius of curvature at the apex (m) Planform type of meander morphology
Bend 1 9.4 7012 8895 1.27 1450 Simple asymmetric
Bend 2 9.5 4071 10650 2.62 1030 Compond asymmetric
Bend 3 2.8 4723 7322 1.55 1220 Compond asymmetric
Bend 4 10.2 8330 9210 1.11 2840 Simple asymmetric
Bend 5 31.7 8755 11684 1.33 2360 Simple asymmetric
Bend 6 5.2 6591 6808 1.03 4340 Simple asymmetric
Bend 7 8.1 5186 5710 1.10 3530 Simple symmetric
Bend 8 11.1 5541 6240 1.13 1920 Simple asymmetric
Bend 9 10.6 4423 9066 2.05 957 Simple asymmetric
Bend 10 6 8361 12417 1.49 1810 Simple asymmetric
Bend 11 16.1 2197 8773 3.99 707 Compond asymmetric
Bend 12 3.4 2906 7752 2.67 722 Elongated simple asymmetric

Note: The planform type of meander bends is defined based on Hooke (1984).

To show the major morphological deformation of each bend in different periods, we used the Golden Software Surfer 11 to elaborate the annual digital terrain models (DTMs) with 5 m × 5 m cell size adopting the Kriging interpolation method. Cross-Validations of the annual DTMs were conducted on the topographic dataset using the software Surfer and the derived quality parameters describing the elevation (z) of surveyed years were presented in Table 3. The average annual erosion and deposition volumes of point bars and concave banks (above the low water level) were calculated by the software Surfer. More specifically, interannual scouring and silting DTMs can be obtained based on the previously established annual DTMs, and the scouring and silting maps of point bar and concave banks could be extracted by this software, respectively. By obtaining the elevation changes (δz), namely, the positive δz indicated deposition and the negative δz indicated erosion, the volumes of erosion and deposition could be calculated applying the method of trapezoidal rule in the software Surfer.
Table 3 Elevation accuracy values for the annual digital terrain models (DTM) with a 5 m × 5 m cell size
DTM Elevation error (m)
SE RMSE MAE
1991 0.003 0.120 0.066
1996 0.003 0.110 0.059
1998 0.003 0.160 0.071
2002 0.003 0.224 0.104
2006 0.003 0.167 0.094
2011 0.003 0.173 0.106
2016 0.003 0.154 0.082

Note: The analysis was performed separately each year for the point bars, and concave banks. SE is standard error of mean, RMSE is root mean square error, and MAE is mean absolute error.

Moreover, we applied the statistical software SPSS to calculate the Pearson correlation coefficient (r), which characterized the correlations between average annual erosion proportions of bank and point bar and corresponding flow discharge frequency, total suspended sediment (TSS) flux, sinuosity, and planform type.

3.2 Field surveys

To gain some insight about the alteration of flow pattern along the bends of the LJR after the TGP, we conducted three separate field campaigns (on 24 June, 2016, 19 October, 2016, and 26 July, 2019) for multi-class discharges at four transects in bends 2 and 3 (Figure 1 and Table 4). The flow velocity and direction data of four cross sections were collected on a hydrographic vessel using an Acoustic Doppler Current Profiler (ADCP) with a resolution of 0.1 cm s‒1. The bathymetric data were collected on each transect with the real-time kinematic global navigation satellite systems (RTK-GNSS) using Global Positioning System (GPS), and the accuracy of the surveys was ±0.1 cm for horizontal coordinates and ± 0.2 cm for elevations.
Table 4 Reach-averaged hydraulic characteristics obtained from the field campaigns
Campaign Date Reach Transect Q H W D U J
m3 s‒1 m m m m s‒1 ×10‒5
1 2016/06/24 Bend 2 CS1, CS6 18,000 31.74 1118 14.87 1.16 6.2
Bend 3 CS2, CS7 31.27 1006 15.03 1.23 4.2
2 2016/10/19 Bend 2 CS1, CS6 8340 25.04 940 10.03 1.01 6.3
Bend 3 CS2, CS7 24.65 779 11.61 0.98 4
3 2019/07/26 Bend 2 CS1, CS6 23,700 33.57 1128 17.03 1.33 6.4
Bend 3 CS2, CS7 33.09 1060 16.29 1.41 5.2

Note: Flow discharge (Q); Water level (H); Width of the water surface (W); Hydraulic depth (D); Reach-averaged velocity (U); Slope of the water surface (J).

3.3 Methods

3.3.1 Erosion intensity index

The fluvial geomorphology adjustments often depended on the combined action of flow discharge and sediment flux. According to Xia et al. (2016) and Li et al. (2018), the ratio of discharge to incoming sediment concentration during flood seasons could represent the sediment transport capacity to influence the fluvial process. We assumed that each daily discharge has an effect on morphology adjustment, which could be expressed by:
$CEI=\sum\limits_{i}^{N}{\left( {Q_{i}^{2}}/{{{S}_{i}}}\; \right)}/{{10}^{8}}$
where Qi and Si are the daily discharge (m3 s‒1) and suspended sediment concentration (kg m‒3), respectively. N is the number of total days for discharges occurs within a certain interval during a certain year. The CEI represented the cumulative erosion intensity of total discharges within a given interval in a certain year, and AEI was the average of CEI.

3.3.2 Calculation methods for geomorphic impacts

We used the index QmJP proposed by Makayev (1955) to quantify the geomorphic impact of different flow discharge magnitudes.
where P is the occurrence frequency of Q. J is the corresponding average water surface slope. m is the slope of the relationship between sediment fluxes and water discharge, which is generally taken as a constant of 2 in fluvial rivers (Cao and Wang, 2015).

3.3.3 Stream power

The stream power reflects the kinetic energy per unit area of the riverbed resulting from the flow (Bagnold, 1980), which can be calculated using:
$\omega =\rho gDJv$
where ω is the stream power per unit area, W m‒2; ρ is the water density (1000 kg m‒3); g is the gravitational acceleration (9.8 m s‒2); D is the water depth, m; J is the water surface slope (Table 3); and v is the velocity, m s‒1.

3.3.4 Evaluation methods for meander bends planform geometry

Ahmed et al. (2019) developed a meander symmetry index (MSI) to characterize the meander planform geometry. The index was calculated for each meander as defined by the ratio of the erosion areas of upstream versus that of downstream in a meander bend between the first and final years.
To analyze channel planform deformation, we calculated the erosion areas of the upstream and downstream of bends in the LJR during different periods. Each bend was divided through bend apex as characterized by the point of maximum curvature.
MSI = SD/SU
where MSI is the meander symmetry index; SU is the eroded areas of the upstream; SD is the eroded areas of the downstream. Considering the majority of the protected banklines, retraction occurs when MSI is within 0.95-1.05; more downstream planform deformation is expected when MSI >1.05; and more upstream planform deformation takes place when MSI <0.95.

4 Results

4.1 Morphological adjustment of the LJR in both pre- and post-TGP periods

4.1.1 Erosion and deposition

With regard to the annual average erosion volume in the bankfull channel of investigated meander bends 1-12 (Table 5). In 1991-2002, the proportion of erosion in the total volume change reached 32.1%, with an average erosion rate of 16.3 million m3 yr‒1. But the proportion of eroded volume in total volume change had increased to 73.0% in 2002-2016, and the corresponding average erosion rate was 29.3 million m3 yr‒1. It was similar for proportion variations of eroded volume on point bars, the average erosion of 12 point bars had reached a rate of 4.4 million m3 yr‒1 from 1991 to 2002, while the erosion volumes of point bars increased to a rate of 7.3 million m3 yr‒1 in 2002-2016. However, after the TGP operation, the average erosion rate of point bars accounted for merely 24.9% of bankfull channel, indicating that the low-water channel experienced a significant degradation.
Table 5 Annual average erosion and deposition of the 12 consecutive bends in the Lower Jingjiang Reach from 1991 to 2016
Years Bankfull channel Point bar Relative error (%)
Deposition volume
(106 m3 yr‒1)
Erosion volume
(106 m3 yr‒1)
Erosion volume as proportion of total volume change (%) Deposition volume
(106 m3 yr‒1)
Erosion volume
(106 m3 yr‒1)
Erosion volume as proportion of total volume change (%)
Before TGP
1991-1996 44.6 32.9 42.4 8.4 8.4 50.0 1.10
1996-1998 113.9 72.5 38.9 28.9 15.5 34.9 -0.15
1998-2002 60.0 43.4 42.0 10.6 9.3 46.6 -0.29
1991-2002 34.6 16.3 32.1 7.4 4.4 37.5 0.06
After TGP
2002-2006 27.0 61.2 69.4 2.8 14.1 83.6 -0.16
2006-2011 34.9 39.1 52.8 8.9 8.7 49.2 -0.27
2011-2016 18.3 38.3 67.7 4.9 9.3 65.3 -0.15
2002-2016 10.9 29.3 73.0 2.7 7.3 73.0 -0.09

Note: The relative error was the comparison of interannual change volumes of these bends in the LJR, which were calculated by the trapezoidal rule and simpson's rule in the software Surfer, respectively.

4.1.2 Temporal variations in geometry

Five typical transects were selected near the apexes of bends 2, 3, 8, 9 and 11 with different sinuosities. Overall, the geomorphic adjustments of cross sections had gradually transformed from an obvious “V” type before the TGP to a “W” type after the TGP (Figures 3a-3e), and it was shown as a significant erosion on the parts near point bars and depositon on the parts near bottom. The WDR presented an annual average increase of 0.05 yr‒1 in all these transects before the TGP, and it was opposite in 2002-2016 with an annual average reduction of 0.04 yr‒1, indicating that the channel in the LJR was narrowing and deepening after the TGP (Figure 3f). Moreover, the higher sinuosity usually resulted in the greater WDR.
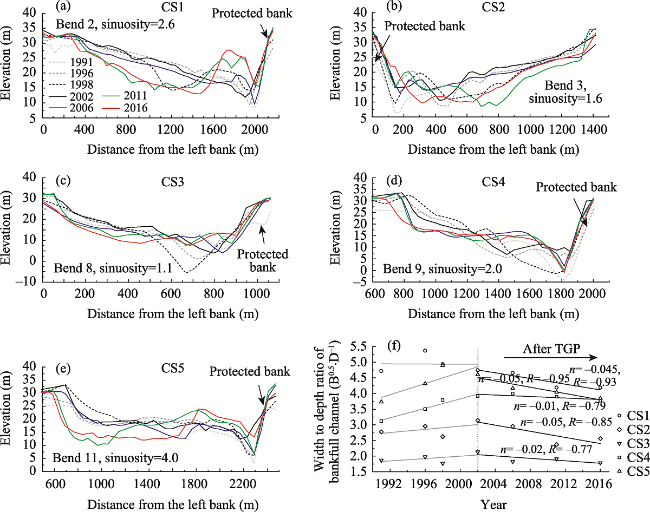
Figure 3 Variations in shape and width to depth ratio (WDR) of the typical transects from 1991 to 2016
Typically, taking Bend 2 as an example (Figure 4), the significant morphology adjustments were mainly located at the upstream part and tail of point bar. In 1991-2002, the margin of upstream point bar moved approximately 280 m towards the outer bank, and the point bar tail also experienced a lateral increase of 285 m (Figure 4a). However, after the TGP operation, the morphology adjustment of upstream point bar was dominated by erosion. The margin continuously drew back with an average erosion rate of 50 m yr‒1 in 2002-2011, and a lateral increase of 205 m appeared near the apex of point bar from 2011 to 2016 (Figure 4b). Notably, the serious erosion on the planform of upstream point bar caused the thalweg to swing towards the inner bank, a channel bar (about 2.4 km in length and 230 m in width) began to appear near the upstream concave bank since 2011, and the height of channel bar tail increased by about 15 m in the span of 14 years, especially from 2006 to 2011.
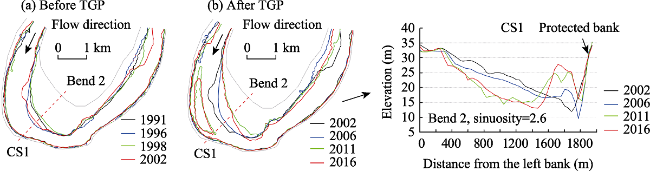
Figure 4 Temporal variations of geometry in typical Bend 2 during both pre- and post-TGP

4.1.3 Morphological changes of point bars and banks before and after the TGP

Before the TGP operation (1991-2002), two different modes of scour and silt on point bars and concave banks in the 12 bends had developed. Similar pattern of erosion and deposition at point bars and concave banks were detected in three periods i.e., 1991-1996, 1998-2002, and 1991-2002 (Table 6 and Figure 5). In these periods, point bars (especially in the highly developed bends) mainly experienced deposition in bends 2-3 and bends 8-11 with deposition proportion ranged from 66.6% to 99.8%, but major erosion occurred on the most corresponding concave banks in the first two periods. Besides, most of these bends (except Bend 8) had a high sinuosity greater than 1.5 (Table 2), and bends 2-3 and 11 were the type of compound asymmetric bend. The deposition zones of bends were located at the margins (for example, Bend 2) or platforms (for example, Bend 9) of point bars, while the upstream concave bank kept going back laterally. For other curves, significant erosion proportion (ranged from 52% to 88.1%) mostly occurred on the point bar head (bends 6-7) or the upstream point bars (bends 1 and 12) of apexes, while deposition occurred along the concave bank. These bends had a low sinuosity (less than 1.4), except Bend 12, with a sinuosity of 2.67, but formed a type of elongated simple asymmetric. In 1996-1998, sediment flux and runoff were rising, higher proportion of erosion of point bars (varied from 55.6% to 70.4%) occurred in bends 2, 3, 6 and 7, and remaining bends maintained the proportion of erosion on the point bars below 50%. The erosion of point bars were discovered on the margins or the upstream point bars of apexes. Nevertheless, almost every concave bank experienced serious deposition in 1996-1998.
Table 6 Annual average erosion and deposition of each point bar and concave bank in bends 1-12 from 1991 to 2016
Years Point bar Concave bank
Deposition volume
(106 m3 yr‒1)
Erosion
volume
(106 m3 yr‒1)
Erosion as proportion of total volume change (%) Deposition volume
(106 m3 yr‒1)
Erosion
volume
(106 m3 yr‒1)
Erosion as proportion of total volume change (%)
Bend 1
1991-1996 0.56 1.19 67.9 1.67 0.34 17.1
1996-1998 1.49 1.07 41.9 4.75 0.21 4.2
1998-2002 0.21 1.52 88.1 2.22 0.15 6.4
1991-2002 0.30 0.98 76.9 2.12 0.003 0.1
2002-2006 0.27 0.83 75.3 0.43 1.10 72.1
2006-2011 0.33 0.88 72.5 0.62 0.23 27.0
2011-2016 0.12 0.78 86.9 0.27 0.47 63.5
2002-2016 0.03 0.62 95.4 0.20 0.33 61.9
Bend 2
1991-1996 1.14 0.48 29.9 0.32 0.59 64.6
1996-1998 2.10 2.62 55.6 3.02 0.44 12.8
1998-2002 1.67 0.52 23.9 0.57 1.29 69.2
1991-2002 0.78 0.16 17.2 0.27 0.21 44.1
2002-2006 0.18 1.97 91.8 0.65 0.58 47.5
2006-2011 0.73 1.92 72.5 21.54 2.22 9.3
2011-2016 0.90 0.60 40.0 2.61 20.67 88.8
2002-2016 0.18 1.01 85.1 0.60 0.13 17.3
Bend 3
1991-1996 0.34 0.14 29.8 0.27 0.28 51.7
1996-1998 0.89 1.15 56.4 1.58 0.66 29.4
1998-2002 0.58 0.15 20.3 0.70 0.22 23.9
1991-2002 0.28 0.08 22.6 0.37 0.06 14.6
2002-2006 0.13 0.62 82.4 0.17 0.44 72.6
2006-2011 0.29 0.79 73.5 0.40 0.11 20.9
2011-2016 0.65 0.12 15.9 0.09 0.32 77.5
2002-2016 0.08 0.21 73.1 0.08 0.14 62.5
Bend 4
1991-1996 0.58 0.60 51.2 0.74 0.09 11.0
1996-1998 1.71 0.82 32.5 1.70 0.09 5.0
1998-2002 0.30 1.02 77.3 0.47 0.46 49.4
1991-2002 0.39 0.49 56.0 0.61 0.01 1.8
2002-2006 0.07 1.72 95.9 0.12 0.41 77.0
2006-2011 0.73 0.50 40.9 0.31 0.08 19.8
2011-2016 0.16 0.71 81.6 0.18 0.16 46.9
2002-2016 0.15 0.74 82.9 0.09 0.09 48.0
Years Point bar Concave bank
Deposition volume
(106 m3 yr‒1)
Erosion
volume
(106 m3 yr‒1)
Erosion as proportion of total volume change (%) Deposition volume
(106 m3 yr‒1)
Erosion volume
(106 m3 yr‒1)
Erosion as proportion of total volume change (%)
Bend 5
1991-1996 0.73 2.86 79.8 1.49 0.34 18.7
1996-1998 7.40 2.41 24.6 3.17 0.84 21.0
1998-2002 3.10 1.41 31.3 1.61 0.71 30.6
1991-2002 1.00 0.67 40.3 1.42 0.16 10.0
2002-2006 0.73 1.29 63.7 0.52 0.88 63.1
2006-2011 0.60 0.61 50.4 0.84 0.33 28.1
2011-2016 1.28 0.37 22.7 0.26 0.75 74.5
2002-2016 1.07 0.18 14.4 0.32 0.42 56.6
Bend 6
1991-1996 0.70 1.00 58.7 0.37 0.13 26.1
1996-1998 1.20 1.72 59.0 0.70 0.03 4.5
1998-2002 0.40 1.24 75.7 0.30 0.11 26.1
1991-2002 0.36 0.88 70.9 0.34 0.05 12.5
2002-2006 0.18 0.84 81.9 0.52 0.88 63.1
2006-2011 0.60 0.61 50.4 0.23 0.11 33.7
2011-2016 0.19 0.71 79.3 0.00 0.43 99.7
2002-2016 0.15 0.53 77.6 0.02 0.16 91.6
Bend 7
1991-1996 0.16 0.27 62.0 0.15 0.18 55.0
1996-1998 0.47 1.12 70.4 0.92 0.44 32.5
1998-2002 0.38 0.42 52.0 0.84 0.06 7.0
1991-2002 0.12 0.29 70.3 0.34 0.02 5.7
2002-2006 0.04 0.82 95.0 0.16 0.29 64.6
2006-2011 0.20 0.79 80.1 0.93 0.02 2.1
2011-2016 0.09 0.37 80.3 0.16 0.25 60.1
2002-2016 0.02 0.55 96.9 0.33 0.07 17.8
Bend 8
1991-1996 0.34 0.05 12.9 0.09 0.13 59.4
1996-1998 0.56 0.59 51.0 0.45 0.30 39.5
1998-2002 0.46 0.11 18.6 0.51 0.01 1.0
1991-2002 0.27 0.01 2.7 0.18 0.00 1.4
2002-2006 0.05 0.37 88.9 0.03 0.25 88.5
2006-2011 0.27 0.02 8.4 0.27 0.01 4.0
2011-2016 0.11 0.22 67.9 0.04 0.15 81.0
2002-2016 0.04 0.09 68.3 0.03 0.04 59.0
Years Point bar Concave bank
Deposition volume
(106 m3 yr‒1)
Erosion
volume
(106 m3 yr‒1)
Erosion as proportion of total volume change (%) Deposition volume
(106 m3 yr‒1)
Erosion volume
(106 m3 yr‒1)
Erosion as proportion of total volume change (%)
Bend 9
1991-1996 0.94 0.47 33.4 0.34 0.33 49.4
1996-1998 1.59 0.85 34.8 1.58 0.30 15.8
1998-2002 0.46 0.11 18.6 0.74 0.32 30.1
1991-2002 0.86 0.11 11.1 0.43 0.08 14.8
2002-2006 0.34 0.74 68.3 0.38 0.33 46.4
2006-2011 0.34 0.13 28.2 0.43 0.16 27.0
2011-2016 0.19 0.46 70.9 0.11 0.46 81.3
2002-2016 0.13 0.27 66.9 0.12 0.14 53.4
Bend 10
1991-1996 1.28 0.63 32.7 0.21 0.27 56.2
1996-1998 5.47 1.45 20.9 1.29 0.48 27.0
1998-2002 2.42 1.24 33.9 1.30 0.74 36.3
1991-2002 1.56 0.17 9.7 0.35 0.01 2.4
2002-2006 0.52 2.47 82.5 0.08 0.46 85.0
2006-2011 2.26 0.71 24.0 0.16 0.30 65.2
2011-2016 0.88 1.83 67.5 0.02 0.67 96.6
2002-2016 0.60 0.94 61.1 0.01 0.40 96.9
Bend 11
1991-1996 1.29 0.07 5.4 0.55 1.01 64.9
1996-1998 3.94 0.05 1.2 3.39 0.91 21.1
1998-2002 0.26 0.81 75.9 1.30 0.74 36.3
1991-2002 1.08 0.00 0.2 0.61 0.24 28.3
2002-2006 0.18 0.78 81.0 0.25 1.81 88.0
2006-2011 2.26 0.71 24.0 1.27 0.40 23.9
2011-2016 0.25 0.78 75.9 0.90 0.62 40.9
2002-2016 0.16 0.59 79.1 0.49 0.52 51.7
Bend 12
1991-1996 0.39 0.67 63.1 2.70 0.96 26.2
1996-1998 2.10 1.65 44.1 4.36 1.21 21.7
1998-2002 0.40 0.75 65.0 1.80 0.66 26.9
1991-2002 0.39 0.57 59.3 2.14 0.37 14.6
2002-2006 0.05 1.64 96.8 0.25 1.81 88.0
2006-2011 0.33 0.96 74.3 1.07 0.19 15.4
2011-2016 0.11 2.30 95.3 0.75 0.41 35.5
2002-2016 0.08 1.54 95.3 0.82 0.20 19.6
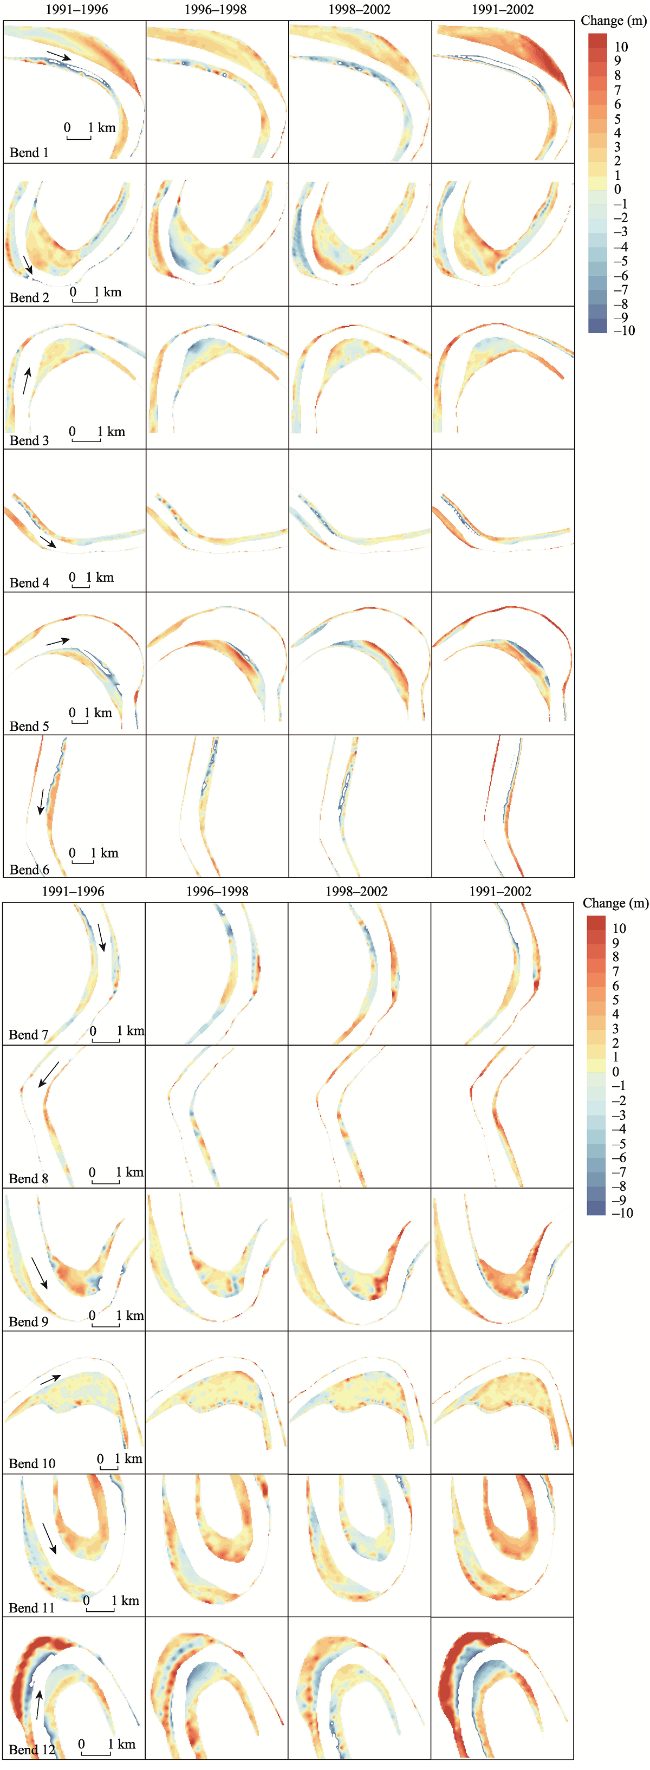
Figure 5 Morphological changes of the point bars and concave banks at bends 1-12 in the Lower Jingjiang Reach from 1991 to 2002
After the TGP (2002-2016), most point bars and concave banks experienced significant net erosion in 2002-2006. In spite of individual concave banks (bends 2 and 9) in equilibrium state of scouring and silting (Table 6 and Figure 6), erosion dominated in the whole point bars and concave banks of the upstream lobes. However, in 2006-2011, most concave banks (except Bend 10) experienced a net deposition, and the proportion of deposition ranged from 66.3% to 96%. The main deposition dominated on the platforms of point bars 8-11, especially the downstream of apexes while the heads and platforms of point bars in other bends were undergoing significant erosion. In 2011-2016, deposition occurred on the point bars 2-3, which was located at the edge of point bar 2 and the total platform of the point bar 3. Point bars and concave banks of remaining bends mainly experienced erosion. The point bar of Bend 5 experienced a net erosion from 2002 to 2016 (max ~85.6%), indicat- ing that the mobility of middle channel bar in Bend 5 probably provided a boundary condition to promote the extension of point bar. In addition, benches near the upstream concave banks had gradually developed, especially in the high sinuosity of bends 2, 11 and 12, ignoring the two flanks of benches scouring after the TGP.
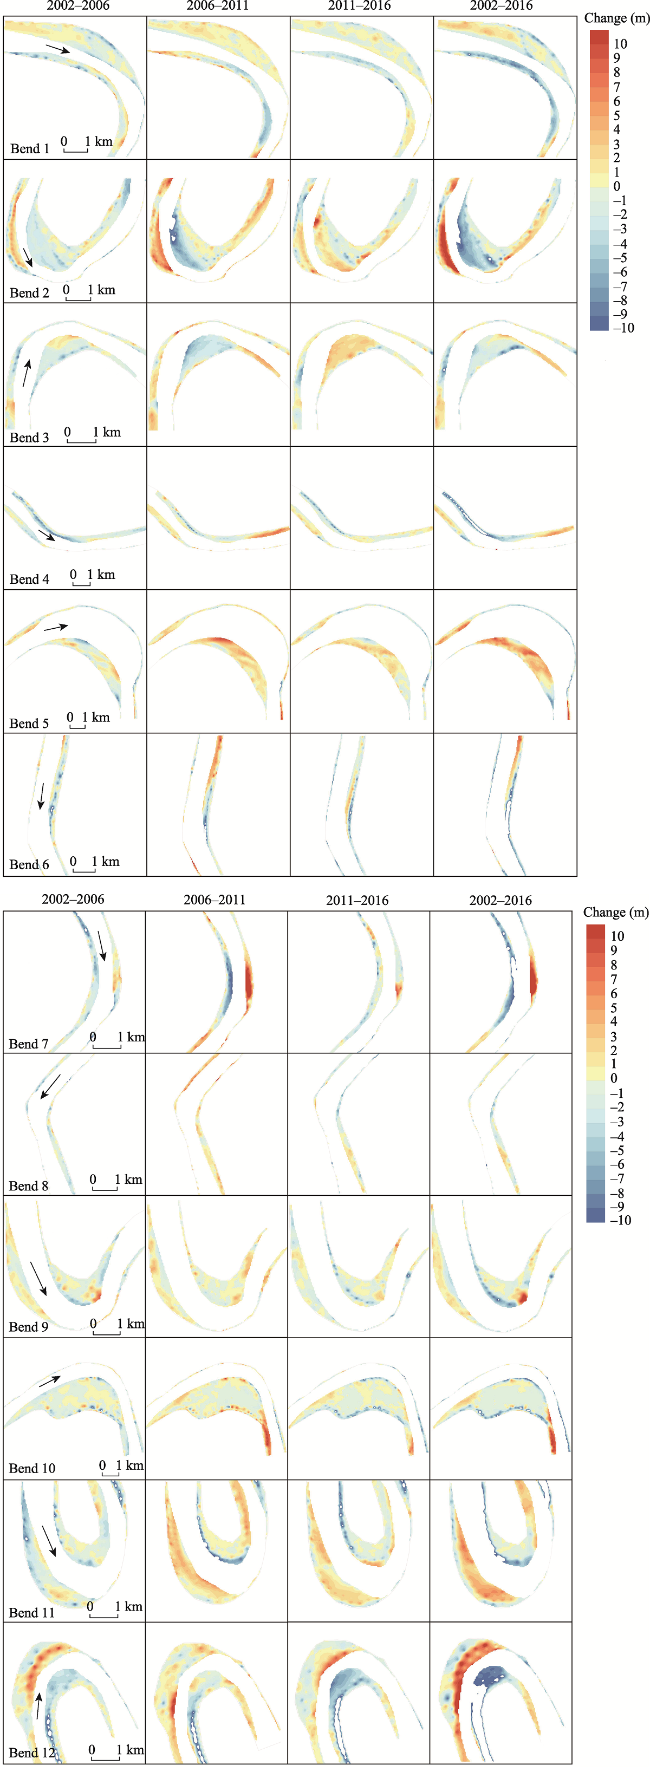
Figure 6 Morphological changes of the point bars and concave banks at bends 1-12 in the Lower Jingjiang Reach from 2002 to 2016

4.2 Response of point bars and banks to flow discharge and sediment flux

4.2.1 Temporal changes of flow and sediment regimes

The frequencies of discharges with different magnitudes in the LJR had been altered by the TGP operation (Table 7). The frequency of bankfull flow (>22,000 m3 s‒1) reduced from 12.1% (1991-2002) to 8.2% (2003-2016), indicating a decrease of 14 days yr‒1, yet the average annual duration of base (<10,000 m3 s‒1) and medium (10,000-15,000 m3 s‒1) flows after the TGP recorded an increase of 11 days yr‒1 compared to a slight increase (3 days yr‒1) in duration of medium flow (15,000-22,000 m3 s‒1).
Table 7 Temporal variation of flow frequency at the Jianli hydrological station before and after the TGP
Average duration
(days)
Before TGP After TGP
1991-
1996
1997-
1998
1999-
2002
1991-
2002
2003-
2006
2007-
2011
2012-
2016
2003-
2016
<10,000 m3 s‒1 186 191 186 187 204 198 176 192
10,000-15,000 m3 s‒1 65 79 66 68 63 72 86 74
15,000-22,000 m3 s‒1 74 45 64 66 67 63 74 69
>22,000 m3 s‒1 40 50 49 44 31 32 29 30
In addition, the average annual runoff at the Jianli hydrological station in 2003-2016 was 3657 billion m3 yr‒1, which was 4.2% less than that in 1991-2002 (Figure 7a). The proportion of average runoff during flood season from 2003 to 2016 had decreased to 70.5% compared with that (74.4%) in 1991-2002. Nevertheless, the average annual sediment flux at the Jianli hydrological station had dropped to just 72.2 Mt yr‒1 from 2003 to 2016, which was 77.1% less than that from 1991 to 2002. But sediment transport was always concentrated in the flood season.
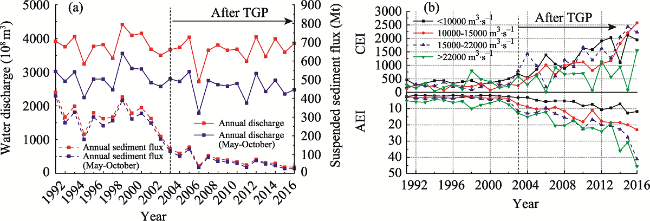
Figure 7 Annual water discharge and sediment flux before and after TGP (a); Temporal variations in erosion intensity of different discharge classes (b) at the Jianli hydrological station
The TGD has not only retained most of the upstream sediment but has altered the frequency of discharges with different magnitude in the LJR. Therefore, the AEI values of different discharge intervals at Jianli station were less than 10 before the TGP, while these values increased gradually to 10-50 in 2016 (Figure 7b). Moreover, the values of AEI increased as the discharge grades, especially at discharges more than 15,000 m3 s‒1 after 2003. However, the values of CEI at different levels of discharges, which were all lower than 500, maintained a modest fluctuation in the pre-dam period. The averaged-annual value (474) of CEI at bankfull discharges (>22,000 m3 s‒1) after the TGP had been the lowest compared with that (828) of medium flows (15,000-22,000 m3 s‒1) and that (902) of low flows (<10,000 m3 s‒1). It can be inferred that the flow discharge below the bankfull discharge (22,000 m3 s‒1) had contributed more to cumulative geomorphic adjustment of the LJR after TGP.

4.2.2 The influence of flow discharge

To quantify the geomorphic impact of different flow discharge classes (taking 2000 m3 s‒1 as the discharge interval) before and after the TGP operation, the QmJP index proposed by Makayev (1955) was used. The correlation coefficients (r) between each flow discharge class and erosion volume changes of point bars and concave banks are presented in Figure 8. The results showed that the highest correlation occurred for discharge of 20,000 m3 s‒1 (concave banks) in the 12 bends of the LJR before the TGP operation, and the contributive water discharge was negatively correlated (r=-0.35; p<0.05) with the erosion volume changes of concave banks. But it was not statistically significant for the point bars (p>0.05). However, after damming, the greatest geomorphic impact on point bar and concave bank corresponded to discharges of 18,000 m3 s‒1 and 16,000 m3 s‒1, respectively. Moreover, the highest contributive water discharges were both positively correlated with erosion volume changes of point bars (r=0.42; p<0.01) and concave banks (r=0.43; p<0.01).
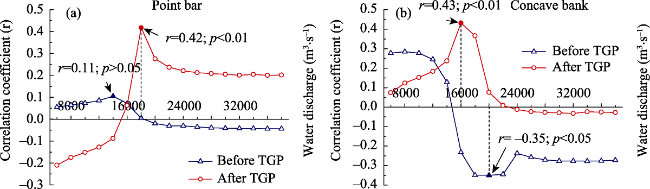
Figure 8 Correlation between the QmJP index and the erosion volume changes of point bars and concave banks in the Lower Jingjiang Reach
During multi-class discharges, depth-averaged velocity vectors and stream power of the local area in bends 2 and 3 were shown in Figure 9. Overall, with the increase of discharge, the high velocity core (HVC) and high stream power (HSP) gradually shifted to point bars in the upstream bends, and swung to main channels in the downstream bends. The slow-flow zones formed in the upstream concave banks (CS1, CS2) owing to the submerged bars. It was obvious that active morphological changes of two bends occurred primarily at the convex banks from campaign 1 to campaign 2 (Figure 9). In the campaign 3 (bankfull discharge) and campaign 1 (medium discharge), the erosion areas of upstream point bars (CS1, CS2) experienced the HSP (8-17 W m‒2) and HVC (1.0-1.6 m s‒1), and the low stream power (2-9 W m‒2) dominated the deposition areas of downstream point bars (CS6, CS7). However, due to declining water depth, the velocity and stream power (<8 W m‒2) on upstream erosion areas and downstream deposition areas were greatly reduced in the campaign 2 (low discharge). According to Kleinhans and Berg (2011), chutes usually formed under stream powers over 8-20 W m‒2 in sandy rivers. Therefore, the high and medium discharges had a key role in shaping point bars of bends in the LJR. However, after the TGP, the redistribution of flow during the year led to the decrease (Table 7) of high flow frequency, and it might explain why the highest correlations between discharges of 16,000-18,000 m3 s‒1 and volume changes of point bars and banks were found.
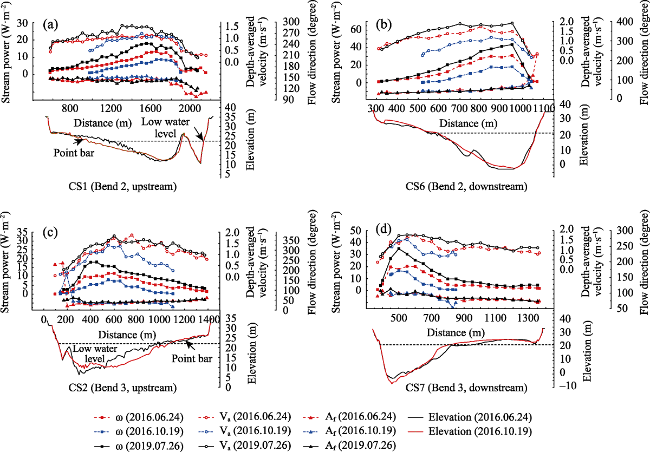
Figure 9 Stream power (ω), depth-averaged velocity (Va), the directions (Af, degrees from North) of the depth-averaged flow velocities, and the morphological changes for the surveyed transects from campaign 1 to campaign 2

4.2.3 The impact of sediment flux

The importance of sediment supply in spatial and temporal scales of meandering behavior in the LJR was shown in Figure10, and the Pearson correlation coefficients (r) provide the measures of significance for correlations. For point bars and concave banks in the LJR, the relationships between the proportions of erosion over volume changes and sediment flux presented both significant negative correlations (point bars: r=-0.451, p<0.01; concave banks: r=-0.513, p<0.01) (Figure 10a), and most of the bends (67%) underwent more upstream planform deformation (MSI <0.95). In addition, there was a positive correlation between MSI index and sediment transport (r=0.34, p<0.01) (Figure 10b) from 1991 to 2016, and bends with sediment flux > 0.2 Mt m-1 yr-1 increase their MSI more rapidly than those with lower sediment load, reflecting more upstream planform deformation tended to occur in sediment-lack reaches of the LJR.
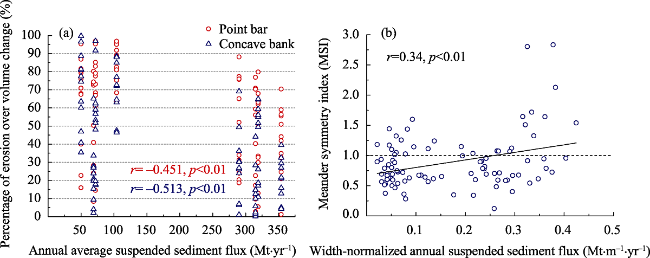
Figure 10 Scatter plots between the volume of erosion as proportion of total volume change for point bars and concave banks in bends 1-12 and the annual average sediment flux of different periods from 1991 to 2016 (a); The meander symmetry index (MSI) of bends 1-12 plotted against width-normalized annual suspended sediment flux (megatons per metre of bankfull channel width per year) (b)

4.3 Meander bend characteristics compared with morphological changes

For point bars and concave banks, the erosion amounts were compared with sinuosity and planform types (Figure 11). In 2002-2016, the proportion of erosion over volume change on point bars and concave banks were all not statistically significant with sinuosity or planform types in the 12 bends (p>0.05). However, in 1991-2002, the proportion of erosion on point bars had significant negative correlations with sinuosity (r=-0.589, p=0.05), while the proportion of erosion volume on concave banks was significantly positively correlated with sinuosity (r=0.731, p<0.01). In terms of planform types, the proportion of erosion over volume change on the point bars in simple symmetric bends reached a higher value before the TGP (1991-2002), followed by simple asymmetric, elongated simple asymmetric, and compound asymmetric bends (r=-0.469, p>0.05; t-test: α<0.01). Conversely, erosion of concave banks occupied a smaller proportion of the total volumetric change in the simple symmetric bend and the largest proportion in one compound asymmetric bend, with a positive correlation coefficient (r=0.764, p < 0.01; t-test: α < 0.02).
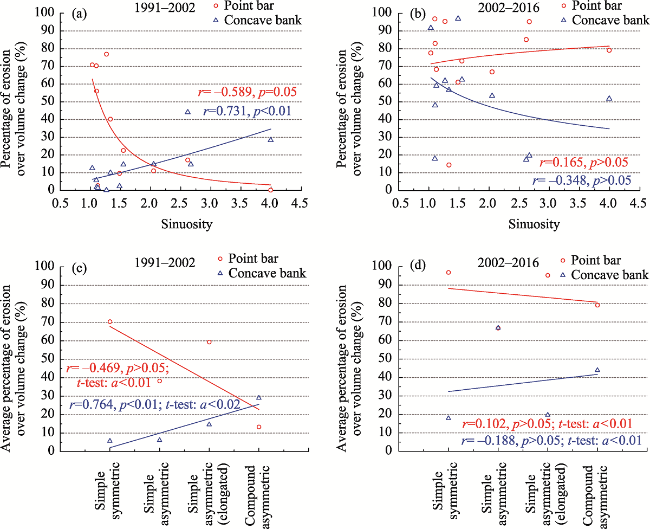
Figure 11 Scatter plots between the volume of erosion as proportion of total volume change for point bars and concave banks in bends 1-12 and sinuosity and planform type in 1991-2016
Although reach-median MSI values for each period ranged from 0.64 to 0.94 before the TGP and varied from 0.66 to 0.83 after TGP, bends characterized by MSI >1.05 before the TGP occupied 31% of all meanders compared to 20% after the TGP (Figure 12). The reached-median MSI was both negatively correlated with sinuosity (before the TGP: r=-0.282, p=0.05; after the TGP: r=-0.288, p<0.05). In addition, frequency distributions of MSI values for each bend in different sub-periods illustrated that most bends experienced more upstream planform deformation (0.33 <MSI < 0.95) after the TGP, especially for high sinuosity (>2.0). More downstream planform deformation (1.05 < MSI < 2.48) or retraction (0.95 < MSI < 1.05) bends usually had a low sinuosity below 1.5, and the MSI values were generally low after TGP.
Figure 12 The meander symmetry index (MSI) of bends 1-12 plotted against sinuosity before and after the TGP

5 Discussion

5.1 Influences of flow and sediment regimes on bends evolution processes

Previous studies have stated that discharge and sediment supply are affected by upstream damming which can significantly modify the river hydro-morphology, leading to non-equilibrium fluvial processes (Nilsson, 1976; Brandt, 2000; Petts and Gurnell, 2005; Ibisate et al., 2013).
Before the TGP operation, the bankfull channels and point bars of meander bends in the LJR had experienced a net deposition, especially on point bars (Figure 5), and the proportions of eroded volume in total volume changes were merely 32.1% and 37.5%, respectively (Table 5). Our results showed that a dominant discharge (20,000 m3 s‒1) for the concave banks in the pre-TGP periods were close to the bankfull discharge (Figure 8b). Although no significant correlations between volume changes of point bar and flow discharges were detected, a deposition tendency of point bars corresponding to the flow exceeding bankfull discharges could be observed in most bends of the LJR (Figure 8a). It was consistent with Kasvi et al. (2015), who suggested that the longer inundation period of point bar could cause it to experience a net deposition in the absence of dams impacts on channel mobility. During bankfull discharges, the mainstream deviated from the channel thalweg towards inner bank, owing to the enhanced stream power (Dietrich and Smith, 1983; Frothingham and Rhoads, 2003; Lotsari et al., 2014), but the shoaling effect of point bar on the current often caused flow dispersion, leading to a rapidly decreasing of stream power (Termini and Piraino, 2011; Engel and Rhoads, 2012). The results were that reduced sediment carrying capacity of flow induced that the deposition occurred on point bars.
According to Nilsson (1976), dams and reservoirs can impound sediment yields by more than 50%, reducing the turbidity of downstream river. After the TGP operation (2002-2016), the average annual sediment flux of the LJR had sharply reduced by 77.1% relative to that in 1991-2002 (Figure 7a). Therefore, the effective sediment carrying capacity of current had been enhanced due to sediment depletion by the TGP operation (Ma et al., 2012; Xia et al., 2016). Our results showed that the values of annual CEI were remaining a continuous increase from 2003 to 2016 (Figure 7b), resulting in an eroded volume proportion of 73% in total volume change of bankfull channel in the LJR. Whereas degradation of point bars was also obvious with an average erosion rate of 4.6 million m3 yr‒1 in 2002-2016 (Table 5). Previous studies indicated that intermediate flows could play an important role in shaping the river channels after upstream damming (Knighton, 1998; Brandt, 2000; Li et al., 2018). Our results presented that there were the highest correlations between the flow discharges of 16,000-18,000 m3 s‒1 and geomorphic adjustments of point bars and banks (Figure 8). Therefore, it means that there is a high scouring potential for the medium discharges (16,000-18,000 m3 s‒1) that inundate point bar after the TGP, contributing to the highest erosion for point bars in the LJR.
McGowen and Garner (1970) illustrated that contributive flow discharges might result in a chute channel on point bar platform, which would be padded by coarse particles during decreasing discharges. However, inadequate sediment supply from upstream had weakened the filling, leading erosion to dominant on the point bars of the LJR (Figure 6). According to Lyu et al. (2020), the impact of the TGD on geomorphic adjustments decreased with distance from the dam and greatly weakened in the LJR during the early stage of dam operation. Therefore, we observed more severely morphological adjustment from 2006 to 2011 (Figure 3), especially in some bends with high sinuosity (Figure 4). It was inferred that continuous erosion on upstream point bar weakened the topography impact of point bar on the flow trajectory, impelling the mainstream to shift towards the inner bank (Figure 9). Accordingly, the near-bank velocity and stream power of upstream concave bank would also evidently diminish, resulting in deposition on concave banks. The sedimentary body might grow to a submerged bar, which could be helpful to form slow-flow zone and further promote the deposition.

5.2 Self-regulation capacity of meander bends under bank control

The self-regulation capacity of meander bends is closely related to flow magnitude, sediment load and riverbed boundary (Schumm and Khan, 1972; Gaeuman et al., 2005; Zhang et al., 2016).
Several decades before the TGP, the LJR constantly adjusted itself towards equilibrium in both of the lateral and vertical directions (Huang et al., 2014; Lyu et al., 2019). Abruptly reduced sediment flux because of the TGP had destroyed the intrinsic balance between sediment carrying capacity of flow and sediment load. To restore the quasi-equilibrium conditions, the stream will erode the bed or bank to gain sediment needed (Zhang et al., 2016). However, due to extensive bank revetments (Figure 1), it was mainly manifested as a state of deepening and degradation in the channel adjustment of the LJR after the TGP operation (Table 5 and Figure 3), supporting the other earlier studies (Begueria et al., 2006; Ollero, 2010; Ibisate et al., 2013), who suggested that a regional trend towards reduced river dynamism in the rivers of Ebro basin (Spain) due to dams and hydropower plants.
Previous studies emphasized that point bar head and margin were marked as characteristic by active deposition or erosion, but the point bar tail always maintained a sedimentary pattern (Hooke, 2007; Kasvi et al., 2015; Ahmed et al., 2019). We detected similar deposition pattern of point bar tail in the LJR (Figures 5 and 6). Dietrich and Smith (1983) explained that sediment impounded on point bar promotes its growth to drive sediment transport and bank erosion, resulting in the meander deformation. However, revetments had restricted the erodibility of bank materials, which could lead to a significant decrease of bars area (Ollero, 2010). The head and edge of upstream point bar in the LJR generally experienced a high net erosion because of the downstream sediment starvation, thus upstream point bars could be the source of sediment. Our results revealed a distinct relationship between sediment supply and meander deformation in the LJR (Figure 10b), driven by sediment exchange over point bars (Figure 10a). Erosion of point bar and sediment loads presented a negative correlation, thus rivers with greater sediment loads could deposit this material as shoals over the point bar, resulting in outward and downstream bar growth (Frothingham and Rhoads, 2003). Furthermore, the morphological adjustment of point bars and banks suggested that erosion and deposition patterns of point bar can dominate the growth or removal of bank blocks, controlling the direction of meander deformation (Braudrick et al., 2009; Constantine et al., 2014).
In the pre-TGP period, the channel evolution of bends in the LJR was generally under a micro-deformation state with an average median MSI of around 0.97 (Figure 12), and higher sinuosity or compound bends usually experienced a higher deposition on the point bar, but higher erosion on the concave bank (Figure 11). After the TGP operation, the average median MSI dropped to 0.8, the impacts of sinuosity and planform types became unpredictable on aggradation and degradation patterns of point bar and concave bank, but the suddenly reduced sediment load should be responsible for it. Due to the destruction of balance between sediment carrying capacity of flow and sediment loads, the hydrodynamics of inflow and sediment transportation had a more major impact on the morphological adjustment of meandering rivers after the TGP, compared to sinuosity and planform types. According to Hooke and Yorke (2011), bends with high sinuosity usually produced a great channel width near the apexes, implying that the zone was more easily affected by flow migration, and thus high sinuosity or compound bends supported the formation of benches near the concave bank (Figure 4). Previous work had demonstrated that bends with low sediment loads or sinuosity greater than 2.6 were predominantly upstream-skewed (Ahmed et al., 2019; Guo et al., 2019). Our results suggested that the high sinuosity (>2.0) bend was more likely to experience more upstream planform deformation in the LJR (Figure 12), especially for the low sediment load (Figure 10b).

6 Conclusions

Detailed hydrological and topographic datasets were used to reveal the bank and point bar morphodynamics of multiple consecutive meander bends (spatially and temporally) in the LJR. The main conclusions are as follows:
(1) Before the TGP operation (1991-2002), the bankfull channel of the LJR mainly experienced a net deposition, and the point bars equally accreted with a net deposition rate of 3 million m3 yr‒1. Construction of the TGP had greatly altered the flow and sediment regimes in the LJR, the atrophy of point bars was significant especially on the upstream heads and margins, and the average net eroded rate was 4.6 million m3 yr‒1. Extensive bank protection in the LJR restricted the erosion on concave banks, resulting in deepening for upstream point bars and low-channel at the vertical scale after damming (2003-2016). Whereas the most significant morphological adjustment of point bars and banks occurred in 2006-2011, reflecting a delayed response of the channel evolution of the LJR to the TGP operation.
(2) The morphological adjustment of point bars and banks in the LJR were closely related to the altered flow and sediment regimes by the TGD. After the completion of TGP, the weakened the frequency of bankfull discharges and inadequate sediment supply impelled the continuous increase of cumulative erosion intensity at medium discharges below 22,000 m3 s‒1, and the medium discharges ranging between 16,000 m3 s‒1 and 18,000 m3 s‒1 had made the greatest contribution to shape the morphology of point bars and banks in the LJR.
(3) The sediment supply determined how point bars and banks evolved in response to meander deformation. Our results presented that a connection between sediment supply and meander deformation in the LJR, driven by sediment exchange over point bar. After damming, low sediment flux caused more erosion on the upstream point bar, and the bends of the LJR with high sinuosity (>2.0) were predominantly more upstream planform deformation. The relationship between meander deformation and sinuosity was manifested through the geometric adjustment range of point bars. Highly curved or compound bends of the LJR usually had a large WDR, it meant that flow process was easier to be influenced by the morphological changes of point bars, thus easier to form concave-bank bars after the TGP operation.
[1]
Ahmed J, Constantine J A, Dunne T, 2019. The role of sediment supply in the adjustment of channel sinuosity across the Amazon Basin. Geology, 47(9): 807-810.

DOI

[2]
Bagnold R A, 1980. An empirical correlation of bedload transport rates in flumes and natural rivers. Proceedings of the Royal Society A Mathematical, 372(1751): 453-473.

[3]
Begueria S, Lopez-Moreno J I, Gomez-Villar I, et al., 2006. Fluvial adjustments to soil erosion and plant cover changes in the central Spanish Pyrenees. Geografiska Annaler, 88(3): 177-186.

[4]
Brandt S A, 2000. Classification of geomorphological effects downstream of dams. Catena, 40 (4): 375-401.

DOI

[5]
Braudrick C A, Dietrich W E, Leverich G T, et al., 2009. Experimental evidence for the conditions necessary to sustain meandering in coarse-bedded rivers. Proceedings of the National Academy of Sciences of the United States of America, 106(40): 16936-16941.

DOI PMID

[6]
Brice J C, 1974. Evolution of meander loops. Geological Society of America Bulletin, 85(4): 581-586.

DOI

[7]
Bridge J S, Jarvis J, 1976. Flow and sedimentary processes in the meandering river South Esk, Glen Clova, Scotland. Earth Surface Processes, 1(4): 303-336.

DOI

[8]
Cao G J, Wang J, 2015. Measurements and Studies of Hydrological and Sediment Data in the Three Gorges Project. Beijing: Science Press. (in Chinese)

[9]
Crosato A, Mosselman E, 2009. Simple physics-based predictor for the number of river bars and the transition between meandering and braiding. Water Resources Research, 45(3).

[10]
Changjiang Water Resources Commission (CWRC), 2017. Analysis of channel degradation in the reach downstream of the Three Gorges Dam. Wuhan Scientific Report of CWRC. (in Chinese)

[11]
Dietrich W E, Smith J D, 1983. Influence of the point bar on flow through curved channels. Water Resources Research, 19(5): 1173-1192.

DOI

[12]
Engel F L, Rhoads B L, 2012. Interaction among mean flow, turbulence, bed morphology, bank failures and channel planform in an evolving compound meander loop. Geomorphology, 163/164: 70-83.

DOI

[13]
Fang H W, Han D, He G J, et al., 2012. Flood management selections for the Yangtze River midstream after the Three Gorges Project operation. Journal of Hydrology, 432/433: 1-11.

DOI

[14]
Frothingham K M, Rhoads B L, 2003. Three-dimensional flow structure and channel change in an asymmetrical compound meander loop, Embarras River, Illinois. Earth Surface Processes and Landforms, 28(6): 625-644.

DOI

[15]
Gaeuman D, Schmidt J C, Wilcock P R, 2005. Complex channel responses to changes in stream flow and sediment supply on the lower Duchesne River, Utah. Geomorphology, 64(3/4): 185-206.

DOI

[16]
Gautier E, Brunstein D, Vauchel P, et al., 2010. Channel and floodplain sediment dynamics in a reach of the tropical meandering Rio Beni (Bolivian Amazonia). Earth Surface Processes and Landforms, 35(15): 1838-1853.

DOI

[17]
Ghinassi M, Ielpi A, Aldinucci M, et al., 2016. Downstream-migrating fluvial point bars in the rock record. Sedimentary Geology, 334: 66-96.

DOI

[18]
Guo X, Chen D, Parker G, 2019. Flow directionality of pristine meandering rivers is embedded in the skewing of high-amplitude bends and neck cutoffs. Proceedings of the National Academy of Sciences, 116(47): 23448-23454.

DOI

[19]
Hickin E J, 1974. The development of meanders in natural river-channels. American Journal of Science, 274(4): 414-442.

DOI

[20]
Hooke J M, 1984. Changes in river meanders: A review of techniques and results of analyses. Progress in Physical Geography, 8(4): 473-508.

[21]
Hooke J M, 2007. Spatial variability, mechanisms and propagation of change in an active meandering river. Geomorphology, 84(3/4): 277-296.

DOI

[22]
Hooke J M, Yorke L, 2011. Channel bar dynamics on multi-decadal timescales in an active meandering river. Earth Surface Processes and Landforms, 36(14): 1910-1928.

DOI

[23]
Huang H Q, Deng C Y, Nanson G C, et al., 2014. A test of equilibrium theory and a demonstration of its practical application for predicting the morphodynamics of the Yangtze River. Earth Surface Processes and Landforms, 39 (5): 669-675.

DOI

[24]
Ibisate A, Díaz E, Ollero A, et al., 2013. Channel response to multiple damming in a meandering river, middle and lower Aragón River (Spain). Hydrobiologia, 712(1): 5-23.

DOI

[25]
Ibisate A, Ollero A, Díaz E, 2011. Influence of catchment processes on fluvial morphology and river habitats. Limnetica, 30(2): 169-182.

DOI

[26]
Kasvi E, Vaaja M, Alho P, et al., 2012. Morphological changes on meander point bars associated with flow structure at different discharges. Earth Surface Processes and Landforms, 38(6): 577-590.

DOI

[27]
Kasvi E, Vaaja M, Kaartinen H, et al., 2015. Sub-bend scale flow-sediment interaction of meander bends: A combined approach of field observations, close-range remote sensing and computational modelling. Geomorphology, 238: 119-134.

DOI

[28]
Kleinhans M G, Berg J H V D, 2011. River channel and bar patterns explained and predicted by an empirical and a physics-based method. Earth Surface Processes and Landforms, 36(6): 721-738.

DOI

[29]
Knighton D A, 1998. Fluvial Forms and Processes: A New Perspective. London: Arnold, 383pp.

[30]
Lenzi M A, Mao L, Comiti F, 2006. Effective discharge for sediment transport in a mountain river: Computational approaches and geomorphological effectiveness. Journal of Hydrology, 326(1-4): 257-276.

DOI

[31]
Li S, Li Y, Yuan J, et al., 2018. The impacts of the Three Gorges Dam upon dynamic adjustment mode alterations in the Jingjiang reach of the Yangtze River, China. Geomorphology, 318: 230-239.

DOI

[32]
Lotsari E, Vaaja M, Flener C, et al., 2014. Annual bank and point bar morphodynamics of a meandering river determined by high-accuracy multitemporal laser scanning and flow data. Water Resources Research, 50(7): 5532-5559.

DOI

[33]
Lyu Y, Fagherazzi S, Tan G, et al., 2020. Hydrodynamic and geomorphic adjustments of channel bars in the Yichang-Chenglingji Reach of the Middle Yangtze River in response to the Three Gorges Dam operation. Catena, 193: 104628.

DOI

[34]
Lyu Y, Zheng S, Tan G, et al., 2019. Morphodynamic adjustments in the Yichang-Chenglingji Reach of the Middle Yangtze River since the operation of the Three Gorges Project. Catena, 172: 274-284.

DOI

[35]
Ma Y, Huang H Q, Nanson G C, et al., 2012. Channel adjustments in response to the operation of large dams: The upper reach of the lower Yellow River. Geomorphology, 147/148: 35-48.

DOI

[36]
Makayev, 1955. Bankfull discharge (in Russian). Zhou Z H. trans. (in Chinese), 1957. Yangtze River, 11: 54-55. (in Chinese)

[37]
McGowen J H, Garner L E, 1970. Physiographic features and stratification types of coarse-grained point bars: Modern and ancient examples. Sedimentology, 14(1/2): 77-111.

DOI

[38]
Nilsson B, 1976. The influence of Man’s activities in rivers on sediment transport. Hydrology Research, 7(3): 145-160.

DOI

[39]
Ollero A, 2010. Channel changes and floodplain management in the meandering middle Ebro River, Spain. Geomorphology, 117(3/4): 247-260.

DOI

[40]
Osterkamp W R, 2004. Bankfull discharge. In: GoudieA S (ed.). Encyclopedia of Geomorphology. London: Routledge, 52-54.

[41]
Parker C, Simon A, Thorne C R, 2008. The effects of variability in bank material properties on riverbank stability: Goodwin Creek, Mississippi. Geomorphology, 101(4): 533-543.

DOI

[42]
Petts G E, Gurnell A M, 2005. Dams and geomorphology: Research progress and future directions. Geomorphology, 71(1/2): 27-47.

DOI

[43]
Schumm S A, Khan H R, 1972. Experimental study of channel patterns. Geological Society of America Bulletin, 83(6): 1755-1770.

DOI

[44]
Termini D, Piraino M. 2011. Experimental analysis of cross-sectional flow motion in a large amplitude meandering bend. Earth Surface Processes and Landforms, 36(2): 244-256.

DOI

[45]
Williams G P, Wolman M G, 1984. Downstream effects of dams on alluvial rivers. U.S. Geological Survey Professional Paper 1286. U.S. Government Printing Office, Washington, DC.

[46]
Xia J, Deng S, Zhou M, et al., 2016. Geomorphic response of the Jingjiang Reach to the Three Gorges Project operation. Earth Surface Processes and Landforms, 42(6): 866-876.

DOI

[47]
Xia J Q, Zong Q L, Deng S S, et al., 2014. Seasonal variations in stability of composite riverbanks in the Lower Jingjiang Reach, China. Journal of Hydrology, 519: 3664-3673.

DOI

[48]
Yan T, Yang Y P, Li Y B, et al., 2019. Possibilities and challenges of expanding dimensions of waterway downstream of Three Gorges Dam. Water Science and Engineering, 12(2): 136-144.

DOI

[49]
Yu W C, 2017. Exploration and Consideration of the Yangtze River Channel. Beijing: China Water and Power Press. (in Chinese)

[50]
Yu W C, Lu J Y, 2008. Bank Erosion and Protection in the Yangtze River. Beijing: China Water and Power Press. (in Chinese)

[51]
Zhang X, Wang S, Wu X, et al., 2016. The development of a laterally confined laboratory fan delta under sediment supply reduction. Geomorphology, 257: 120-133.

DOI

[52]
Zhu L L, Xu Q X, Xiong M, 2017. Fluvial processes of meandering channels in the Lower Jingjiang River reach after the impoundment of Three Gorges Reservoir. Advances in Water Science, 28(2): 193-202. (in Chinese)

[53]
Zuo L Q, Lu Y J, Liu H X, et al., 2020. Responses of river bed evolution to flow-sediment process changes after Three Gorges Project in middle Yangtze River: A case study of Yaojian reach. Water Science and Engineering, 13(2): 1674-2370.

Outlines

/