Research Articles

Simulating the development of resilient human settlement in Changsha

  • TANG Lisha , 1, 3 ,
  • LONG Hualou , 2, 3, 4, *
Expand
  • 1. School of Business, Hunan First Normal University, Changsha 410205, China
  • 2. School of Public Administration, Guangxi University, Nanning 530004, China
  • 3. Institute of Geographic Sciences and Natural Resources Research, CAS, Beijing 100101, China
  • 4. College of Resources and Environment, University of Chinese Academy of Sciences, Beijing 100049, China
* Long Hualou (1971-), PhD and Professor, specialized in urban-rural development and land use transition, rural restructuring. E-mail:

Tang Lisha (1983-), PhD and Associate Professor, specialized in urban-rural resilient development, human settlement. E-mail:

Received date: 2021-10-14

  Accepted date: 2021-12-30

  Online published: 2022-10-25

Supported by

National Natural Science Foundation of China(42101214)

Natural Science Foundation of Guangxi Zhuang Autonomous Region(2018GXNSFDA281032)

China Postdoctoral Science Foundation(2021M703177)

Abstract

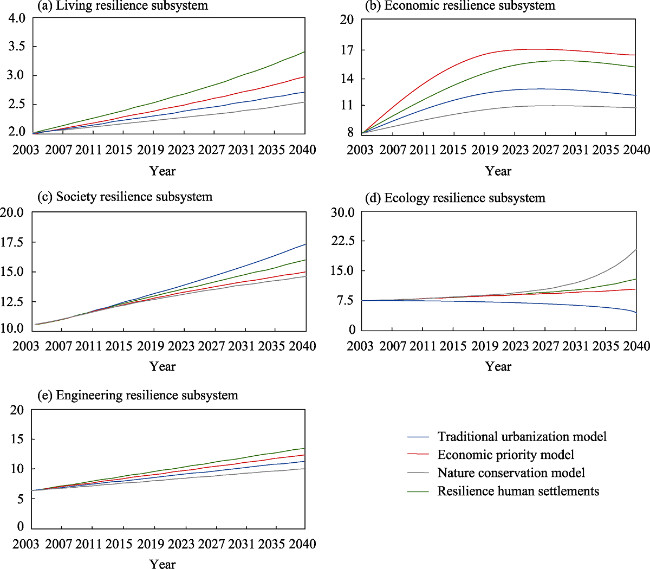
Using the system dynamics simulation software Vensim PLE, we built a model to simulate the development of resilient human settlement in Changsha. This model includes five subsystems: living, economy, society, ecology and engineering. The model simulates various scenarios, based on different parameter settings to predict the trend of human settlement from 2019-2040 in Changsha. It puts forward four development programs under different simulation scenarios. The results show that the current system of human settling lacks self-regulation and feedback, where simple increases in the economy and urbanization cannot drive the internal system to progress positively. In contrast, the resilient human settlement program is more reasonable and scientific, up to the year 2040, the production, living and ecological environment of residents will be markedly improved in terms of per capita disposable income, per capita floor space and medical insurance coverage; these will increase by 98.9%, 39.7%, and 170.7%, respectively. This system of developing resilient human settlement provides feedback according to the internal relation loops and thus drives itself to adjust and recover, achieving harmonious and sustainable development. In the forthcoming development, we should take the initiative to optimize economic development and upgrade industrial structures, establish emergency plans and response mechanisms to enhance human quality of life.

Cite this article

TANG Lisha , LONG Hualou . Simulating the development of resilient human settlement in Changsha[J]. Journal of Geographical Sciences, 2022 , 32(8) : 1513 -1529 . DOI: 10.1007/s11442-022-2008-3

1 Introduction

Given the dramatic ongoing changes to the world’s natural and social environments, disturbances brought by climate change, and the havoc caused by epidemics and economic fluctuations, the construction further of human settlement needs to be undertaken with far more care than has been the case previously. In the past 20 years, urbanization has nearly doubled from 36% in 2000 to 60% in 2019, and per capita disposable income has increased nearly 10-fold. However, with the upgrade of urbanization and increase in people’s income, total energy consumption has raised three-fold and average house prices have increased more than ten-fold. At the same time, due to the contradiction between urbanization and the resources, the contrast of human settlement in urban versus rural areas become obvious (Long, 2020; Long and Chen, 2021). Phenomena such as high-density populations, increasing contradictions between land use, serious traffic congestion and rising housing costs become more prominent (Ye et al., 2021). These factors bring unprecedented challenges and restrictions to the development of new human settlement (Radley et al., 2021). Human settlement are an important embodiment of people’s material and spiritual life, as well as an important feature with which to measure regional economic development, and material and spiritual life (Choguill, 1999; Ma et al., 2016; Wu, 2019). In China with an ever greater abundance of material items, people’s expectations of the settlements in which they reside now extend beyond food and clothing to many other multi-level demands (Ning and Zha, 1999; Long et al., 2018; Tian et al., 2021). Urban residents have higher demands than rural residents do. These expectations give rise to new demands for the sustainable development of human settlement that increase people’s sense of security, happiness, fulfillment and satisfaction, to provide more convenient and healthy living facilities and to create fairer living space (Klopp and Petretta, 2017; Fumiko et al., 2021; Sara et al., 2021). Understanding the development of urban human settlement, formulating resilient routes of settlement development (Shekhar et al., 2019; Laura and Ulf, 2020) has become the new focus and are of crucial significance.
The study of human settlement overseas started with the Science of Urban Planning. Here are some groundbreaking examples and their related theories: “Garden City” from Howard, Ekistics from Dioxides (Khera, 1973; Johnstone, 1979). The research on human settlement in European and American countries has gone through the stage of “emphasis on quantity, emphasis on quality, emphasis on both quantity and quality, emphasis on the quality of ecological environment” (Zhang et al., 2013; Allmond, 2017). The construction of current human settlements pays most attention to people and aspects of the natural environment, planning and design, the construction of living blocks and infrastructures, governance and protection of the environment, etc. (Greber and Shelton, 1987). Different countries have different priorities. Britain lays emphasis on the sustainable development of satellite towns; France advocates a “Green Revolution” in residential areas; Germany established the concept of the sustainable community; Sweden carried out ecological cycle city plans; the US made “Policies on Guiding the Design of Sustainable Development” to be applied to settlements (Alberti and Waddell, 2000). As the development of settlements becomes more complicated and changeable, foreign scholars have been researching what factors have changed urban settlement (Stefan et al., 2021). There is no doubt that human activities, climate change and social factors have directly influence on the evolution of human settlements (Mcbean and Ajibade, 2014; Arce et al., 2020), and the traditional approach cannot satisfy the evaluation of human settlement. Thus a new research direction has focused on the development of various dynamic simulation models, such as UrbanSim, Tranus and Cubeland, in order to provide early warning to natural hazard and some extreme events, so as to find a better way to develop human settlements (Desouza and Flanery, 2013; Cariolet, 2019). To provide efficient support for future settlement development, model predictions are generated with regards to the growth trend of the future regional space, manifesting the spatial characteristics of different scales over time, and presenting these scenarios using geovisualization techniques (Sakamoto and Fukui, 2004; Tarennom et al., 2021).
In China, the purposes of human settlements and social progress have gradually been unified. The establishment of various facilities has arisen from people’s basic demand for good quality settlements and a harmonious society, so the emphasis on settlements enhances overtime (Wu et al., 2020; Fang, 2021). Scholars in China have studied the influencing factors and mechanisms of settlements, mainly urbanization, ecology and environment, natural resources, population migration, and economic development (Hao et al., 2020; Jiang et al., 2021). To evaluate the sustainable or evolving situation of settlements, statistical data on the economy, society and environment, and large-scale questionnaire surveys, are quantitatively assessed (Wang and Zhao, 2012; Hu and Wang, 2020). Some scholars try to provide a digital platform with simulations, experiments, analyses and controls for settlements, based on suitability assessments of settlements to predict the result of optimal population distributions (Ma et al., 2014; Duan and Tian, 2020).
To sum up, the existing research on human settlement mainly has the following shortcomings: (1) The implication of resilient urban human settlement is not clear enough. Because the concept of resilience has been widely used by many disciplines, many studies directly put the word resilient before the research name, but the actual research content does not reflect the connotation of resilient; (2) The internal mechanism of Changes in the quality of urban human settlement is not completely clear, and the trend of human settlement quality change is not analyzed from multiple factors. (3) Due to the difficulty in collecting urban micro data, qualitative analysis is the main way to optimize and control the quality of future urban human settlement while only a few studies focus on quantitative analysis. It is difficult to dynamically simulate and predict the future development trend and path of urban human settlement.
Therefore, this paper defines the implication of human settlement from a resilient perspective. Based on the system dynamics simulation software Vensim PLE and having chosen Changsha as the case study, we build and operate a model for human settlement in Changsha from five subsystems: living, economy, society, ecology and engineering (Tang et al., 2017), establishing causal relationships and feedback loops between them. Through parameter adjustment, the models simulate various scenarios including the evolution of factors and structural functions of system from 2019-2040, to predict the upcoming and developing trends of human settlements, the plans can be continuously adjusted and adapted in the pursuit of more open, fair, inclusive and sustainable urbanization.

2 Methodology and data

2.1 Methodology

System Dynamics is a discipline that analyzes and studies the feedback of complicated system information. It is also a comprehensive discipline that identifies and solves problems within the system (Kiss and Kiss, 2021; Tarannom et al., 2021). Forrester (1994) predicts and analyzes human settlement in Changsha with this approach. In considering the hierarchy, time sequence, dynamics, convenience and controllability of human settlement in Changsha, the boundary for the settlement is determined as the city area of Changsha. The simulation of human settlement is established using Vensim PLE 8.1, based on residential, economic, social, natural environment and infrastructure data for the human settlements in Changsha from 2003 to 2019.

2.1.1 Systematic structure and feedback mechanisms

From the perspective of resilience, the system of human settlement in Changsha is composed of five subsystems: Living Resilience, Economy Resilience, Society Resilience, Ecology Resilience and Engineering Resilience. According to study “Introduction to Sciences of Human Settlements” by Wu Liangyong, and based on the division of human settlement system of Mr. Wu, this paper also incorporates some relevant contents of The Evaluation Index System of China Habitat Environment Award (2016) as well. We at first assessed the interactions and restrictions among the five subsystems that form causal structures with multiple feedback mechanisms (Figure 1). The major causal relationships are listed as follows:
(1) Total population→+Urbanization→+Urban infrastructure→+Total population
(2) GDP→+Per capita GDP→+Per capita disposable income→‒Registered unemployment rate→+GDP
(3) GDP→+Proportion of education expenditure in fiscal expenditure→+Sum of educational resources→+GDP
(4) Total population→+Population density→‒Per capita green space→‒Green coverage rate→‒Environmental quality→‒Total population
(5) GDP→+Added value of the tertiary industry→+Communication facilities→+Social security facilities→+GDP
(6) Total population→+Sewage discharge→‒Pollution factors→‒Quality of natural environment→‒Total population.
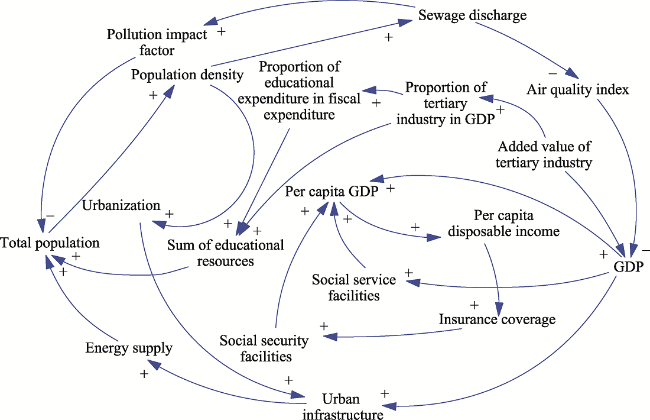
Figure 1 The causal relationship and feedback mechanism of the system of human settlement in Changsha
The positive feedback of causal relationship (1) is that growth of the total population in Changsha causes population density to increase within the limited settlement area, the influx of more people to cities increases the urbanization and improves the quality of infrastructure, and this promotes the population growth. The positive feedback of causal relationship (2) is that the development of the urban economy is in proportion to per capita disposable income of the residents, economic growth increases and the registered unemployment ratio declines correspondingly. Causal relationships (3) and (5) indicate that economic growth will drive the development of social security facilities and communication facilities. As the proportion of tertiary industry increases, spending on education grows. The educational resource that people have becomes fairer and better, therefore the overall quality of urban residents increases. The negative feedback of causal relationships (4) and (6) shows that growth of the population creates a demand for more housing, which reduces the per capita green areas and leads to lower green coverage. At the same time, residents will emit more pollution, increasing overall settlement pollution levels. These changes will adversely affect the natural environment and restrict the healthy growth of population.

2.1.2 Subsystem models

(1) Living resilience subsystem
Living conditions are the most important part of human settlement, directly reflecting the basic living standards of urban residents. This subsystem includes Total population, Per capita floor space, Population density, Number of public buses per 10,000 people, Per capita practical road area and average commuting time. Living standards are the reflection of a resident’s income and a manifestation of whether a resident is healthy. In the process of rapid urbanization, per capita floor space and investment into urban housing are both associated with the ongoing increase in overall living standards in China. But there are a certain number of people who experience a poor quality of urban life and their living conditions need prompt improvement. The resilient living condition is not only reflected in the per capita floor space, but also in the living facilities and amenities, the right to participate in the decision-making of the community, and the good health and well-being of residents.
(2) Economy resilience subsystem
Economic support is the basis of settlements. In the process of humans settling, economies experience the process: maladaptation—adaption—coordination. Economic resilience subsystem includes GDP, Proportion of tertiary industry, Engel coefficient, Per capita disposal income and Urbanization. Per capita GDP that is in line with the law of economic development, reasonable industrial structure, relatively advanced tertiary industry, residents with abundant disposable income, higher employment rates and urbanization are all direct indicators of a city’s economic level. In addition to supporting human settlements in quantity, resilient economy pays more attention to the input of investment, especially to the R&D of science and technology, and environmental governance, which will promote the green, healthy and sustainable development of human settlement.
(3) Society resilience subsystem
The two major concerns of society resilience subsystems are education and a harmonious society. Society resilience subsystem includes Education expenditure, Households of low-income housing, Basic endowment insurance coverage, Basic medical insurance coverage, Expenditure on social security and employment, Employment ratio and Employment ratio. Medical insurance, registered unemployment rates and the coverage of low-income housing are universal concerns of residents. Residents are helped by getting a better education, an upgrade in human comprehensive quality and having a sense of belonging. People are the basic unit of society. The better the material conditions are, the more problems people will consider in education, culture, self-improvement, social contribution rate and other aspects, expand all fields of social services, and improve the quality of living, study, and work, to meet individualized and equalized needs for social services.
(4) Ecology resilience subsystem
The ecological environment is a crucial part of human settlement. With the acceleration of urbanization, increasing levels of pollution such as air pollution, water pollution and waste treatments will directly curtail development of the ecological environment. The resilience subsystem includes Air quality Index, Average yearly temperature, Afforestation coverage rate, Energy consumption per unit GDP and Energy efficiency. The growth of resident population, increases in industrial emissions and exhaust fumes, reduced green space, and deforestation all directly influence air quality. The resilient ecological subsystem should pay attention to its own metabolism, accept the polluted waste generated by life and production, and at the same time purify it through its own functions, continuously improve the carrying capacity of the ecological subsystem, and achieve sustainable development.
(5) Engineering resilience system
Engineering resilience was manifested mainly on providing infrastructure for human settlement—the “hard” environment. The resilience subsystem includes Percentage of internet usage, Gas coverage, Rate of urban sewage disposal, Decontamination rate of urban refuse and Capacity of emergency shelters. The construction and investment of infrastructure will not only promote economic growth but also accelerate urbanization, industrialization and IT infrastructure. Infrastructure development has become a powerful driving force for the sustainable and steady development of human settlements and an important indicator for evaluating their quality.

2.2 Data

2.2.1 System dynamic models data

We chose different dependent variables in each subsystem, these dependent variables not only operate in internal subsystem, but also across each subsystem to operate simulation. According to analyze the boundary of space and the structure of five subsystems of the model, it constructs the system dynamic model of human settlement which includes the living, economy, society, ecology and engineering resilience subsystem. This model consists of variables, state, rate and auxiliary variables.
State variables include GDP, total population, education expenditure, expenditure on social security and employment, and number of subscribers with broadband internet access. Rate variables are the added value of the above state variables. Using the formulas to computed the variables then test the model (Table 1).
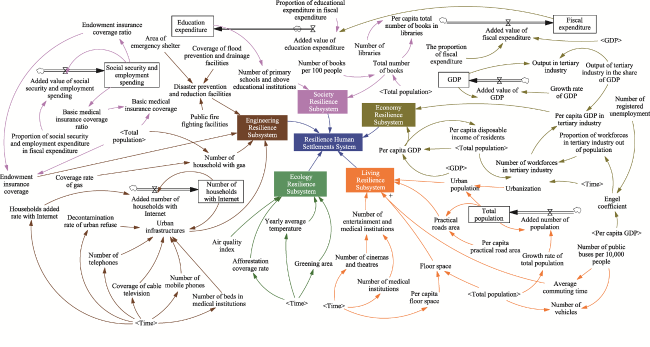
Figure 2 The system dynamic model of human settlement
Table 1 Variable calculation formulas of the system of human settlement
Subsystem Dependent variables Formula Attribute
Living resilience subsystem Total population INTEG (total population growth) –/+
Growth rate of total population Constants –/+
Total population growth Total population×growth rate of total population –/+
Per capita floor space Total floor space/total population (m2/person) +
Population density Total area/total population (person/m2) –/+
Number of public buses per 10,000 people Number of public buses/total population (person) +
Per capita practical road area Usable road area/total population (m2) +
Average commuting time Average commuting distance/average commuting speed (min)
Economy resilience subsystem GDP INTEG (increase of GDP) +
Growth rate of GDP Constants +
Growth of GDP GDP×growth rate of GDP (10,000 yuan) +
Per capita GDP GDP/total population (yuan) +
Proportion of tertiary industry Constants +
Output of tertiary industry GDP×proportion of tertiary industry (%) +
Engel coefficient Expenditure on food/total expenses +
Per capita disposal income (gross family income-paid income tax-personal social security expenditure-charge-up allowance)/size of family (yuan)
Urbanization Number of urban residents (non-agriculture people)/total population×100% (%) +
Society resilience subsystem Education expenditure INTEG (increased fiscal expenditure) +
Proportion of education expenditure Constants +
Added value of education expenditure Education expenditure×proportion of education expenditure (100,000,000 yuan) +
Households of low-income housing Number of households of urban residents×coverage rate of low-income housing (household) +
Basic endowment insurance coverage Regional total population×basic endowment coverage (people) +
Basic medical insurance coverage Regional total population×basic medical insurance coverage (people) +
Expenditure on social security and employment INTEG (growth of social security and employment) +
Proportion of expenditure on social security and employment Constants +
Added value of expenditure on social security and employment Expenditure on social security and employment×proportion of expenditure on social security and employment +
Employment ratio ((Total population–number of unemployed people)/total population)×100% (%) +
Total number of books in libraries Total number of books in libraries/number of libraries +
Ecology resilience subsystem Air quality Index Days of good air quality/total days of the year×100% (%) +
Average yearly temperature Sum of ambient temperature each day/365 (℃) –/+
Afforestation coverage rate Projected areas of afforestation of the city/areas of the city×100% (%) +
Energy consumption per unit GDP (increase/decrease) Total energy consumption/domestic (regional) GDP (+/-%)
Energy efficiency Designed building energy consumption/basic building energy consumption×100% (%) +
Subsystem Dependent variables Formula Attribute
Engineering resilience subsystem Percentage of internet usage INTEG (additional number of households with internet) +
Added rate of households with internet Constants +
Added number of households with Internet Number of households with internet added rate of households with internet (household) +
Gas coverage Number of households with gas/total number of households×100% (%) +
Rate of urban sewage disposal Purified water after treatment/sewage disposal×100% (%) +
Decontamination rate of urban refuse Decontaminated garbage after treatment/amount of urban refuse×100% (%) +
Capacity of emergency shelters Area of shelters/number of people×100% (%) +

2.2.2 Model data test and sensitivity analysis

After the building of system dynamic models, tests should be conducted to ensure the model’s validity and that it reasonably reflects the practical situation of human settlement in Changsha. We chose total population, GDP, urbanization, per capita disposable income of residents, air quality, per capita floor space, the Engel coefficient, rates of medical insurance coverage and area of afforestation as the testing variables for comparing the simulation data of the model with historical data (Appendix I) and then calculating the error rates of each variable. The results show that the errors of the simulated values from 2003 to 2019 are all less than 10% compared with historical data, indicating that this simulation model is in accordance with the requirements of the system dynamic model and that it can simulate the actual development of resilient settlements in Changsha.
To test the stability of the system dynamic model, we compared the actual values with the simulation values, calculating the error rate each year to reflect the changing extent and influence of the nine variables. We analyzed the sensitivity of nine variables in the model, which covered all the subsystems of population, economy, society, ecology and engineering. Analysis of the sensitivity of these variables (Figure 3) shows that the average sensitivity of all testing variables is 2.3%. Because they are less than 5%, this means that the model is not sensitive to variation in the values of the testing variables and is relatively stable. The sensitivity of GDP is relatively high, at about 5.3%, while the sensitivities of total population, per capita disposable income, air quality rate and Engel coefficient are all above 2%. In order of decreasing sensitivity, the least sensitive variables are rate of medical insurance coverage, afforestation area, urbanization and per capita floor space.
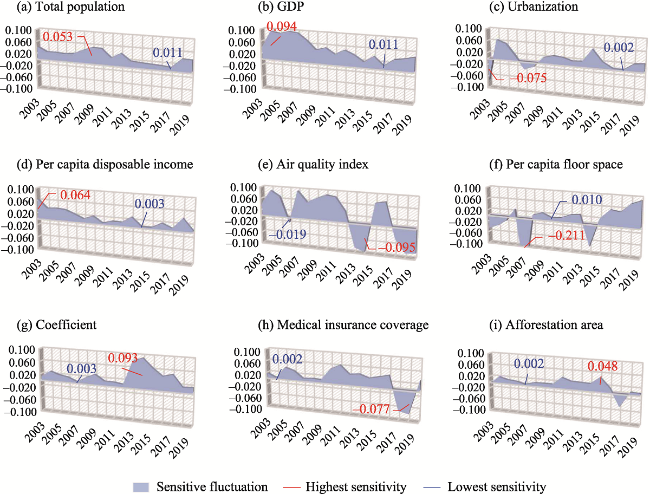
Figure 3 Sensitivity analysis of a system dynamic model of human settlement in Changsha

3 Results and analysis

3.1 Model simulation and prediction

In order to improve the accuracy of prediction, we will try to ensure the basic data duration corresponds to the predicted data duration. Setting the starting year as 2003-2019 and simulating analysis of the major factors of human settlement in Changsha, the simulation length is 1 year, and the simulation progresses until 2040, and used historical data is used to provide the major variables with starting values. By combining the system simulating process with changes to the target variables, four simulation programs were built: a traditional ur- banization program, an economy priority program, a nature protection program and a resilient human settlement program.
Different main variables are chosen in each subsystem to predict the predicted values in different scenario models. We simulated system dynamics to analyze predicted values of outcome variables under different scenarios (Table 2), and then identified and chose the best development program with key factors within different simulated scenarios to provide a reference for the sustainable development of human settlement in Changsha.
Table 2 The values of the main variables in the dynamic model of human settlement for the present (2019) and for the predicted future (2040)
Major variables Present data (2019) Predicted data (2040)
Initiative value (standard) Traditional urbanization (+/-) Economy priority (+/-) Nature protection (+/-) Resilient human settlements (+/-)
Total population (10,000 people) 839 (1) 930.24 (0.11) 922.83 (0.10) 941.42 (0.20) 916.32 (-0.00)
GDP (100,000,000 yuan) 11574 (1) 12589 (0.09) 15350 (0.33) 11963 (-0.22) 14109 (-0.08)
Urbanization (%) 79.56 (1) 86.11 (0.08) 82.23 (0.03) 74.51 (-0.09) 80.47 (-0.02)
Per capita disposable income (yuan) 55211 (1) 84657 (0.53) 111326 (1.01) 65093 (-0.41) 109793 (0.01)
Air quality (%) 75.3 (1) 83.35 (0.11) 85.4 (0.13) 40.55 (-0.53) 45.25 (-0.47)
Per capita floor space (m2) 43.1 (1) 50.52 (0.17) 58.11 (0.34) 44.23 (-0.24) 60.2 (0.04)
Engel Coefficient 25.78 (1) 21.67 (-0.16) 14.33 (-0.44) 16.46 (0.15) 14.58 (0.02)
Medical insurance coverage (%) 31.69 (1) 50.68 (0.60) 80.34 (1.55) 45.65 (-0.43) 85.78 (0.07)
Afforestation area (ha) 15633 (1) 16033 (0.03) 15902 (0.02) 18521 (0.16) 17441 (0.10)

3.2 Program setting and selection

3.2.1 Traditional urbanization program

The urbanization of China has reached a new stage. While simply registering farmers as permanent urban residents provides a valuable measure of urbanization, it also bears many shortcomings for quantitatively assessing changes in urbanization. Taking the year 2019 as the starting point, urbanization will reach 86.11% by 2040 under the traditional urbanization program; urbanization is undoubtedly progressing rapidly. But in the process of economic development, natural protection and resilience development, urbanization should be encouraged in terms of emphasizing the harmonious relationships between people and land, integrating urban and rural areas, low-carbon solutions, etc. By 2040, the total population will have increased by nearly 11% based on our simulations. The Chinese seventh national census shows that the Chinese population is aging, that is a challenge to economic development. Though GDP and per capita disposable income will continue to rise, the rates will slow. Traditional urbanization program emphasizes the leading role of urban development to a certain extent, neglects the sustainable development of rural areas. This leads to the compression of space for production, living and the natural environment, which is contrary to the aim of rural-urban integration.

3.2.2 Economy priority program

The economy has been fundamental in the development of settlements, providing “hardware”, and the right to housing is an important facet of “hard” human settlements. In the settlement program that prioritized the development of the economy, GDP keeps rising over time and investment on real estate increases, thus the per capita floor space expands, reaching 58.11 m2/person, an increase of more than 13% and meeting the standard set out by UN-Habitat1(1 https://unhabitat.org/cn/node/2969UN-Habitat.). Investment in medical care also increases as the coverage of medical insurance increases to 80%. Per capita disposable income continues to grow rapidly, doubling between 2019 and 2040, bringing the Engel coefficient down to 14.3%. However, this economy priority program can quickly drive the overall economy to grow, it may cause adverse effects in that the economy and the natural environment cannot both be sustained. For instance, the coverage rate of good air quality and afforestation will decline in a short period of time and then threaten the sustainable development of settlements.

3.2.3 Nature protection program

Nature is the foundation of the human settlement development, and for this reason we should improve the quality of settlements by protecting the natural environment and emphasizing a harmonious relationship between people and land, focusing on environmental friendliness, optimizing air quality, expanding forested areas and reducing industrial pollution. Compared with the traditional urbanization program and economy priority program, the air quality of the nature protection program is clearly better, the average index of air quality reaching excellent2(2 Air Quality Guidance from WHO (World Health Organization).). Air quality is the important facet of human settlements that receives universal attention. To protect nature, the growth of the economy will slow, the growth rate of GDP and per capita floor space will be 3.36 and 2.62%, respectively, while the growth rate of per capita disposable income will be less than 20%; these are the slowest growth rates of the four programs. As the integration of rural and urban spaces accelerates, and more urban residents choose to live in rural areas, urbanization will show negative growth (declining to 74.51% in 2040 from 79.56% in 2019). The nature protection program protects nature as the foundation of human settlement, but this creates a conservative development program that cannot fully meet the growing material and cultural needs of people in the short term.

3.2.4 Resilient human settlement program

Integrating resilience development theory and principles into the development process of settlements is the major feature of the resilient human settlement program. According to the simulation, the population will grow to 9.16 million by 2040, a growth rate of less than 10%, which is a significant slowdown. Although the growth rate of GDP and per capita disposable income is lower than that of the economy priority program, these still represent marked growth. Particularly, per capita disposable income almost doubles, and the per capita floor space increases significantly, reaching 60.2 m2/person. When the available material life fully meets basic needs, people’s demand for an improved spiritual life continues; the coverage of good air quality and afforestation maintain a strong increase over time, basically realizing the coordinated development of “hard” environment and “soft” environment. Hard environment refers to physical human settlement, including roads, housing and other public infrastructures, it is a human settlement constructed by tangible issues. While soft environment, on the other hand, is the intangible human settlement, including resident’s quality, traditional customs and other spiritual categories, it is constructed by intangible issues.
This model, through constantly adapting to the changes brought by urban infrastructure, increased social security, economic development, education and culture, medical care etc., enables these factors to self-adjust and thus realizes sustainable development to the greatest extent even in scenarios when various perturbations are encountered such as natural disasters, climate change and extreme events. This program is the most effective of all the settlement development programs.
The four programs are ranked based on the data analysis, situation and evolutionary trends of 5 subsystems (Figure 4), then choose the best program of different subsystems under different scenarios (Table 3).
Table 3 Ranking analysis of resilient human settlement in Changsha by subsystem priority
Subsystem Rank
Program
Traditional
urbanization
Economy
priority
Nature
protection
Resilience human
settlement
Living 3rd 2nd 4th 1st
Economy 3rd 1st 4th 2nd
Society 1st 3rd 4th 2nd
Ecology 4th 3rd 1st 2nd
Engineering 3rd 2nd 4th 1st
Figure 4 Evolutionary trend of human settlement subsystems in Changsha (2003-2040)

4 Discussion and conclusions

4.1 Discussion

Urban human settlement is a complex and giant system, affected by policy, economy, society, ecology and other aspects. This paper uses the system dynamic model to simulate around the above mentioned deficiencies in the research of human settlement domestic and overseas from the perspective of resilience. Firstly, although ‘resilience’ is widely used, the study of resilient human settlement in this paper has been applied to specific indicators, such as Average Commuting time, Energy consumption per unit GDP, Energy efficiency and Capacity of emergency shelters. These indicators are quite consistent with that of Rockefeller Foundation on the construction of resilient urban which integrates the connotation of resilience into human settlement. Secondly, the human settlement system model constructed by Vensim, clarified the internal relationship of human settlement and established the connection between various factors. Thirdly, we use dynamic simulation and qualitative analysis to predict the future development trend of urban human settlement, and choose the resilient human settlement as the best program, which provides reference for the resilient development of urban human settlement.
Under the traditional urbanization program, the evolutionary trend of society subsystems ranks first. By 2040, the urbanization of Changsha will reach 85%, urban residents will increase greatly and population density will reach 787 persons/km2, which matches or even exceeds the population densities of megacities. Overcrowded people, a reduced sense of belonging and concerns about immigration are not conducive to the sustainable development of urban spaces. On the other hand, traditional urbanization takes the urban human settlement as a priority, while rural human settlements were neglected, which is bad for the integration of rural-urban development. While such a program can achieve better economic and social benefits in a short time, it results in various over-capacity problems brought about by the expansion of cities without limits.
Under the economy priority program, the economy subsystem ranked first and the living subsystem ranked second. The GDP of urban spaces reaches 153.5 trillion yuan by 2040, a 32.6% increase over the present GDP. Per capita disposable income exceeds 100,000 yuan, which is sufficient for residents to improve their living standards. However, this program pursues economic benefits in a disorderly fashion, which will cause some damage to the natural environment. Environmental pollution and wasted resources resulting from an improved economy will be more serious than under any other development program—the economy priority program can only achieve benefits in the short term, and cannot achieve long-term sustainable benefits.
The nature protection program is in line with the development concept of ecological protection and harmonious relationships between people and land. In this program, the ecology subsystem ranked first and the rate of air quality continually improved. The Air Quality Index reaches 40.55 by 2040, and air quality improves from 60% mild pollution to almost no pollution, and afforestation coverage increases by 18%—the overall ecological and environmental quality of Changsha improves greatly. Changsha is a resource saving and environmentally friendly demonstration city in China. This program, based on ecological protection, explores and utilizes natural resources in a rational way, though inevitably these conflicts with the objective of rapid economic development. Balancing the competing demands of natural protection and economic development is a challenge for this program.
Resilient human settlement programs run under the concept of resilient cities. The development of resilient urban human settlement not only provides residents with good infrastructure and public services but also improves their sense of satisfaction and belonging. In this program, the living and engineering subsystem ranked first while the economy, society and ecology subsystems ranked second. Per capita disposable income will reach 100 000yuan, per capita floor space will reach 60m2/person and meet the average level for developed countries, the Engel coefficient will be low and medical insurance coverage will be above 85%. In addition to improving the residents' quality of life and economic development, this program also focuses on reducing the damage to the natural environment, meeting the extensive and personalized needs of residents, and realizing flexible development within the system. It is a comprehensive and balanced program of housing, economy, society, ecology and engineering.

4.2 Conclusions

(1) It is feasible to build and analyze urban human settlement from a resilient perspective view. Resilient human settlement build and analyze urban settlements from a new perspective. This system is composed of five subsystems: living resilience, economy resilience, society resilience, ecology resilience and engineering resilience, each subsystem covers a number of factors. Through a system dynamic model, six causal relationships between the system and the subsystems are determined, which means that there exist causal relationships within the system and among systems. The current urban human settlement lack self-adjustment and feedback—pure economic growth and urbanization cannot drive the system to develop effectively and may even cause resource waste and environmental pollution. When the development of one particular subsystem is disturbed or threatened, the resilient human settlement can adjust and recover gradually through causal relationships and feedback, and realize the coordinated and sustainable development of the overall system.
(2) A system dynamic model can simulate the developing trends of the system of human settlement in Changsha. This paper, based on system dynamic model, determined the initial variables and rate variables to build causal flow diagrams of human settlement in Changsha, and test whether the model is reasonable. Through predictions of actual and simulation values as well as sensitivity analysis, this model is assessed as stable and effective. Four simulation programs are set up to predict the development of all variables of human settlement: a traditional urbanization program, an economy priority program, a nature protection program and a resilient human settlement program. The results show that the total population in Changsha will increase but the rate will slow; the growth of economic factors like GDP and per capita disposable income result in the growth of other factors such as urbanization, per capita floor space and medical care coverage. In different scenarios, differences in growth rate can have certain effects on the natural environment, the blind pursuit of urban expansion and economic growth causes natural factors like air quality and afforestation to deteriorate. How to balance the relationship between economic growth and the natural environment is the key to further optimize the environment of human settlement in the future.
(3) A resilient human settlement program is a more scientific and reasonable program. Comparing and analyzing the four programs under simulated scenarios, this paper holds that the resilient human settlement program is better than the other three programs and is suitable for the sustainable development of human settlement in Changsha. The program shows that by 2040, with the growth of the population and economy, the production and living environment of residents will be significantly improved, especially in terms of per capita disposable income, per capita floor space and medical insurance coverage (these growth rates are 98.9%, 39.7% and 170.7%, respectively). At the same time, air quality and afforestation will also have developed in a more balanced way. Only in a harmonious environment between man and nature, combined with the concept of resilience development, can human settlement be truly transformed and upgraded. In the future, urban human settlement should take the initiative to optimize economic development and industrial structures, improve science and technology, protect nature, enhance policy guidance and effective treatment for hazards, and optimize emergency plans and response mechanisms so as to improve the green, harmonious and resilient development of human settlement.

Appendix

Appendix I Comparison between the simulated and actual data concerning human settlement systems in Changsha
Year Total population (10,000 persons) GDP (100,000,000 yuan) Urbanization (%)
Actual value Simulation value Error Actual value Simulation value Error Actual value Simulation value Error
2003 601 625.64 0.041 928 965.13 0.040 49.16 45.47 -0.075
2004 610 626.06 0.026 1108 1211.78 0.094 51.19 54.5 0.065
2005 620 636.48 0.027 1519 1653.97 0.089 53.87 56.75 0.053
2006 631 646.55 0.025 1790 1963.73 0.097 56.5 57.41 0.016
2007 637 654.9 0.028 2190 2396.61 0.094 60.2 58.59 -0.027
2008 641 667.59 0.041 3000 3217.19 0.072 61.25 60.34 -0.015
2009 646 680.34 0.053 3744 3907.16 0.044 62.63 63.77 0.018
2010 650 683.78 0.052 4547 4788.75 0.053 67.69 69.51 0.027
2011 656 672.1 0.025 5619 5813.86 0.035 68.49 70.15 0.024
2012 660 687.55 0.042 6399 6723.89 0.051 69.38 70.41 0.015
2013 662 674.67 0.019 7153 7423.66 0.038 70.6 71.81 0.017
2014 671 682.21 0.017 7824 7965.12 0.018 72.34 76.57 0.058
2015 680 690.13 0.015 8510 8841.33 0.039 74.38 75.91 0.021
2016 696 705.33 0.013 9292 9397.13 0.011 75.99 76.21 0.003
2017 708 715.56 0.011 10210 10552.41 0.034 77.59 77.72 0.002
2018 728 757.21 0.040 11003 11428.33 0.039 79.12 80.91 0.023
2019 839 806.62 0.039 11574 12109.45 0.046 79.56 81.63 0.026
Year Per capita disposable income (yuan) Air quality index (%) Per capita floor space (km2)
Actual value Simulation value Error Actual value Simulation value Error Actual value Simulation value Error
2003 9933 10567 0.064 115.5 120.45 0.043 18.17 18.61 0.024
2004 11021 11414 0.036 87.75 95.5 0.088 18.8 19.21 0.022
2005 12434 12908 0.038 70.38 75.24 0.069 21.26 21.33 0.003
2006 13924 14421 0.036 87.19 85.5 -0.019 21.4 22.4 0.047
2007 16153 16548 0.024 59.75 65.35 0.094 21.64 22.8 0.054
2008 18282 18490 0.011 85.56 90.43 0.057 21.23 23.3 0.098
2009 20238 20710 0.023 84.94 91.17 0.073 29.33 28.2 -0.039
2010 22814 22892 0.003 63.69 69.21 0.087 30.88 30.41 -0.015
2011 26451 26772 0.012 72.5 78.46 0.082 33.1 32.62 -0.015
2012 30288 30637 0.012 77.5 80.33 0.037 33.08 34.6 0.046
2013 32634 33635 0.031 91.75 84.13 -0.083 41.42 37.6 -0.092
2014 36826 36940 0.003 115.5 104.55 -0.095 46.74 43.61 -0.067
2015 39961 40118 0.004 70.5 75.56 0.072 45.34 45.73 0.009
2016 43294 44132 0.019 72.7 78.42 0.079 44.77 46.21 0.032
2017 46948 47251 0.006 72.2 69.33 -0.040 45.48 46.11 0.014
2018 50792 52832 0.040 77.2 70.67 -0.085 42.72 46.73 0.094
2019 55211 54937 0.005 75.3 69.14 -0.082 43.1 47.01 0.091
Year Coefficient Medical insurance coverage (%) Afforestation area (ha)
Actual value Simulation value Error Actual value Simulation value Error Actual value Simulation value Error
2003 31.56 31.9 0.011 10.35 10.51 0.015 6720 6678 -0.006
2004 33.41 34.4 0.030 12.67 12.69 0.002 6949 7090 0.020
2005 33.43 34.1 0.020 13.16 13.7 0.041 7368 7460 0.012
2006 32.6 33.1 0.015 14.43 14.88 0.031 7876 7953 0.010
2007 34.88 35 0.003 16.79 16.92 0.008 8541 8561 0.002
2008 36.88 37.6 0.020 18.63 18.83 0.011 8818 8910 0.010
2009 32.29 33.3 0.031 20.36 20.54 0.009 9304 9410 0.011
2010 34.14 33.7 0.013 21.09 22.11 0.048 9857 9967 0.011
2011 35.96 36.4 0.012 21.46 22.83 0.064 10235 10612 0.037
2012 36.3 36 0.008 22.42 23.21 0.035 10729 11010 0.026
2013 29.49 31.9 0.082 22.83 23.72 0.039 11206 11490 0.025
2014 26.45 28.9 0.093 23.42 24.08 0.028 11813 12097 0.024
2015 26.01 27.7 0.065 24.55 25.42 0.035 12278 12863 0.048
2016 24.95 26.01 0.042 25.09 26.17 0.043 12828 13019 0.015
2017 24.68 25.93 0.051 29.54 27.48 -0.070 14877 14224 -0.044
2018 25.89 25.51 0.015 32.41 29.93 -0.077 15157 15270 0.007
2019 25.78 25.33 0.017 31.69 32.82 0.036 15633 15725 0.006

Data sources: Hunan Statistics Yearbook 2003-2009, Changsha Statistics Yearbook 2003-2020, National Economy And Social Development Statistics Bulletin in Changsha.

[1]
Alberti M, Waddell P, 2000. An integrated urban development and ecological simulation model. Integrated Assessment, 1(3): 215-227.

DOI

[2]
Allmond G, 2017. The First Garden City? Environment and utopianism in an Edwardian institution for the insane poor. Journal of Historical Geography, 56: 101-112.

DOI

[3]
Arce S, Jeanneret C, Gales J, et al., 2020. Human behaviour in informal settlement fires in Costa Rica. Safety Science, 142: 105384.

DOI

[4]
Cariolet J, Vuillet M, Diab Y, 2019. Mapping urban resilience to disasters: A review. Sustainable Cities and Society, 51: 101746.

DOI

[5]
Choguill C, 1999. Toward sustainability of human settlements. Habitat International, 20: v-viii.

[6]
Desouza K, Flanery T, 2013. Designing, planning, and managing resilient cities: A conceptual framework. Cities, 35: 89-99.

DOI

[7]
Duan X, Tian F, 2020. Regionalization of urban population growth control based on suitability level for human settlements: A case study of Nanjing City. Scientia Geographica Sinica, 30(1): 45-52. (in Chinese)

[8]
Fang C, 2021. China’s urban agglomeration and metropolitan area construction under the new development pattern. Economic Geography, 41(4): 1-7. (in Chinese)

DOI

[9]
Forrester J W, 1994. System dynamic, system thinking and soft OR. System Dynamics Review, 10(2): 245-256.

DOI

[10]
Fumiko O, János K, Kimmo K, et al., 2021. Ecology of the digital world of Wikipedia. Scientific Reports, 11: 18371.

DOI PMID

[11]
Greber K, Shelton G, 1987. Assessment of neighborhood satisfaction by residents of three housing types. Social Indication Research, 19(3): 303-315.

[12]
Hao Q, Shan J, Deng L, 2020. Evaluation on natural suitability of human settlement in the context of territorial space planning. China Land Science, 34(5): 86-93. (in Chinese)

[13]
Hu Q, Wang C, 2020. Quality evaluation and division of regional types of rural human settlements in China. Habitat International, 105: 102278.

DOI

[14]
Jiang W, Zeng Z, Zhang Z, et al., 2021. Simulation of carbon emission system of urban water and land resources utilization based on system dynamics model: A case of Tianjin. Journal of Safety and Environment, 21(2): 882-892. (in Chinese)

[15]
Johnstone I, 1979. Ekistics and energetics: A sustainable future planning approach. Urban Ecology, 4(3): 227-233.

DOI

[16]
Khera I, 1973. Business, government, and the science of human settlements. Business Horizons, 16(4): 65-72.

[17]
Kiss T, Kiss V, 2021. Develop resilience: A system-level dynamic indicator for testing the long-term impact of planned projects based on a watershed and a city strategy example. Ecological Indicators, 129: 107970.

DOI

[18]
Klopp J, Petretta D, 2017. The urban sustainable development goal: Indicators, complexity and the politics of measuring cities. Cities, 63: 92-97.

DOI

[19]
Laura A, Ulf A, Sune L, 2020. The scales of human mobility. Nature, 587: 402-407.

DOI

[20]
Long H, 2020. Land Use Transitions and Rural Restructuring in China. Singapore: Springer Nature, 132-137.

[21]
Long H, Chen K, 2021. Urban-rural integrated development and land use transitions: A perspective of land system science. Acta Geographica Sinica, 76(2): 295-309. (in Chinese)

DOI

[22]
Long H, Ge D, Zhang Y, et al., 2018. Changing man-land interrelations in China’s farming area under urbanization and its implications for food security. Journal of Environmental Management, 209: 440-451.

DOI

[23]
Ma R, Wang T, Zhang W, et al., 2016. Overview and progress of Chinese geographical human settlement research. Journal of Geographical Sciences, 26(8): 1159-1175.

DOI

[24]
Ma R, Zhang W, Yu J, et al., 2014. Overview and prospect of research on human settlement of Chinese geographers. Scientia Geographica Sinica, 34(12): 1470-1479. (in Chinese)

[25]
McBean G, Ajibade I, 2014. Climate change, related hazards and human settlements, Current Opinion in Environmental Sustainability, 1(2): 179-186.

DOI

[26]
Ning Y, Zha Z, 1999. The study of evaluation and for human settlement in the metropolitan areas take Shanghai as an example. City Planning Review, 34(12): 1470-1479. (in Chinese)

[27]
Radley M Horton, Alex de Sherbinin, David Wrathall, 2021. Michael Oppenheimer. Assessing human habitability and migration. Science, 372: 1279-1283.

DOI PMID

[28]
Sakamoto A, Fukui H, 2004. Development and application of a livable environment evaluation support system using Web GIS. Journal of Geographical Systems, 6(2): 175-195.

[29]
Sara G, Chloe J, Gales J, et al., 2021, Human behaviour in informal settlement fires in Costa Rica. Safety Science, 142: 105384.

DOI

[30]
Shekhar H, Schmidt A, Wehling H, et al., 2019. Exploring wellbeing in human settlements: A spatial planning perspective. Habitat International, 87: 66-74.

DOI

[31]
Stefan H, Stefan V, Finn L, et al., 2021. Differences in the dynamics of community disaster resilience across the globe. Scientific Reports, 11: 17625.

DOI

[32]
Tang L, Ruth M, He Q, et al., 2017. Comprehensive evaluation of trends in human settlements quality changes and spatial differentiation characteristics of 35 Chinese major cities. Habitat International, 70: 81-90.

DOI

[33]
Tarannom P, Ingrid B, Jan E, et al., 2021. Dynamic probabilistic risk assessment of decision-making in emergencies for complex systems, case study: Dynamic positioning drilling unit. Ocean Engineering, 237: 109653.

DOI

[34]
Tian S, Li X, Yang J, et al., 2021. Spatio-temporal coupling coordination and driving mechanism of urban pseudo and reality human settlements in the three provinces of Northeast China. Acta Geographica Sinica, 76(4): 781-798. (in Chinese)

DOI

[35]
Wang Y, Zhao W, 2012. Information theory for human settlements research and its info-spectrum images system. Acta Geographica Sinica, 67(2): 253-265. (in Chinese)

DOI

[36]
Wu L, 2001. Introduction to Sciences of Human Settlements. Beijing: Architecture and Building Press. (in Chinese)

[37]
Wu L, 2019. High quality development of human settlements and modernization of urban and rural governance. Human Settlements, (4): 3-5. (in Chinese)

[38]
Wu W, Wu L, Shi X, et al., 2020. Human settlements and high-quality development. City Planning Review, 44(1): 99-104. (in Chinese)

[39]
Ye C, Yu J, Zhang Q, et al., 2021. From governance to rural-urban co-governance: Research frontiers, trends, and the Chinese paths. Progress in Geography, 40(1): 15-27. (in Chinese)

DOI

[40]
Zhang W, Chen L, Yang Y, 2013. Research progress on human settlement evolution. Progress in Geography, 32(5): 710-721. (in Chinese)

DOI

Outlines

/