Research Articles

Spatiotemporal evolution of national development zones and their impact on urban land growth in China

  • WANG Zhihan , 1 ,
  • KONG Xuesong , 1, 2, * ,
  • CHENG Peng 1
Expand
  • 1. School of Resource and Environmental Sciences, Wuhan University, Wuhan 430079, China
  • 2. Key Laboratory of Geographic Information System, Ministry of Education, Wuhan University, Wuhan 430079, China
* Kong Xuesong (1979-), Associate Professor, E-mail:

Wang Zhihan (1998-), E-mail:

Received date: 2022-03-28

  Accepted date: 2022-05-07

  Online published: 2022-10-25

Supported by

The National Key Research and Development Program of China(2018YFD1100801)

Abstract

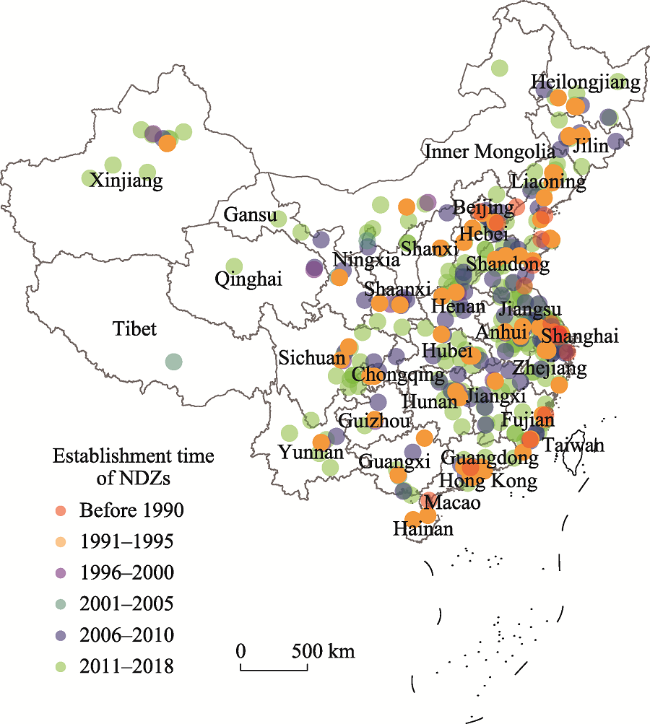
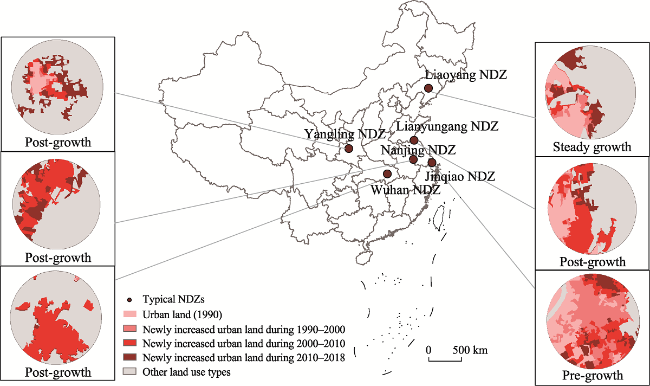
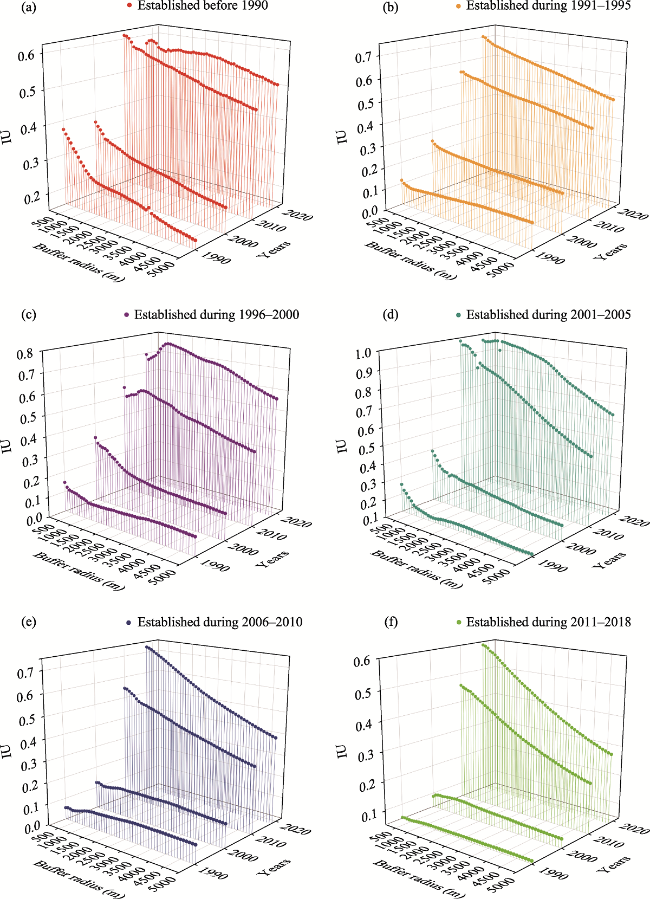
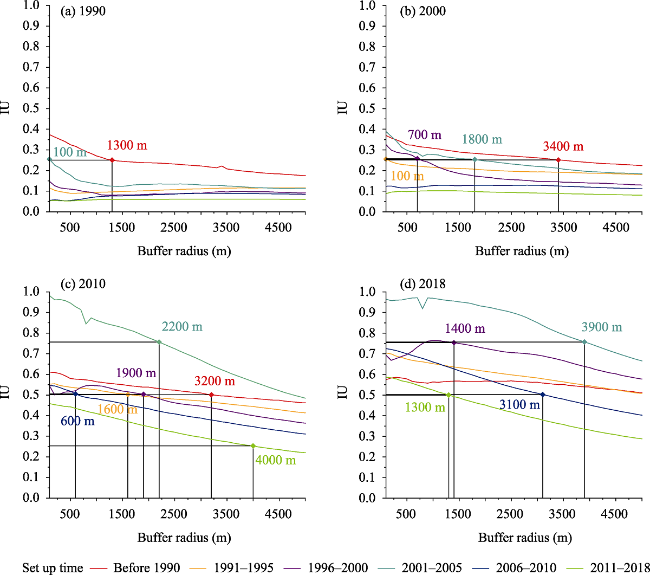
Development zones are important growth poles for promoting regional economic development. However, the spatiotemporal relationship between development zone construction and urban land growth is still unclear. This paper analyzes the spatiotemporal changes of national-level development zones (NDZs), approximately 219 national economic development zones, and 156 high-tech development zones during 1990-2018 in China. The impact of development zone establishment on the growth of surrounding urban land was quantitatively explored using circle buffering analysis and time series comparative analysis. The results show that China’s NDZs spread from the southeast coast to the inland area from 1990 to 2018, and the establishment of the development zones has an obvious promoting effect on the surrounding urban land growth. The scope and intensity of influences of the development zone established in different periods present distinct nonstationarity in space and time. Overall, the impact on urban land (IU) of China’s NDZs established in different years was mostly highest at the 100 m buffer zone radius, while the slope of the IU was mostly negative, which meant that the 100 m buffer zone radius of the development zone center was the most efficient scale to promote urban land growth. In the meantime, the curve of IU of NDZs established before 1990, during 1996-2000 and 2001-2005 has a clear inflection point, which indicates that the most efficient scales of NDZs established before 1990, during 1996-2000, and 2001-2005 are 1300 m, 900-1000 m, and 800 m, respectively. NDZs established in other periods do not have the most obvious efficient scale. The development zone played the greatest role in promoting urban land growth from 2000 to 2010. Three association modes, including post-growth, pre-growth and steady-growth, were identified based on the differences in geographical location, establishment time, and type of development zones. We quantitatively identify the impact of the growth pole of NDZs on urban land growth from the perspective of spatiotemporal evolution. The findings would provide decision-making support for optimizing the spatial relationship between development zone construction and urban land growth.

Cite this article

WANG Zhihan , KONG Xuesong , CHENG Peng . Spatiotemporal evolution of national development zones and their impact on urban land growth in China[J]. Journal of Geographical Sciences, 2022 , 32(8) : 1451 -1470 . DOI: 10.1007/s11442-022-2005-6

1 Introduction

Development zones refer to the areas designated in cities with certain development prospects after scientific planning and approval of the government to facilitate rapid and open development under special policies (Chen and Guo, 2004). Ireland established the world’s first export processing zone in 1959, mainly engaged in foreign trade and enterprise trade, which was the first development zone in a substantial sense (Zhang, 2002). After the 1970s, this form was introduced by Asian countries to gradually establish their own export processing zones, which became the dominant form of development zones. At the end of the 1970s, the third scientific and technological revolution led by information technology broke out, prompting developed countries to take the lead in establishing science parks and industrial science parks (Raheem, 2011). Some industrialized countries and regions also established science parks in succession to promote the upgrading of industrial structures and the transformation of development forms of development zones. The establishment of development zones played an important role in promoting the economic development and social reform of these countries (Park, 1997; Wei, 1999).
The development zone construction in China was born with the reform and opening-up. In 1980, China established special economic zones in Shenzhen, Zhuhai, Shantou, and Xiamen on the southeast coast and achieved rapid results within a few years (Jones et al., 2003; Zheng et al., 2016). At the beginning of 1984, the Chinese government learned from the successful experience of special economic zones, established national-level economic and technological development zones in open cities in coastal areas to attract the injection of foreign capital, promote the development of international trade, and further strengthened its opening to the outside world (Walcott and Xiao, 2000; Demurger et al., 2002; Deng, 2003). The first batch of high-tech zones was established due to the implementation of China’s Torch Plan. From 1991 to 1992, 57 state-level development zones were established, accounting for 68.7% of the total from 1991 to 2000. After China joined the WTO in 2001, under the influence of economic development and the adjustment of national macroeconomic policy, NDZs entered a period of rapid development. The growth of urban land during 2000-2010 was significantly higher than during 1990-2000 and 2011-2018 (Shen and Sun, 2016). After more than 40 years of development, China’s development zones are currently classified into economic and technological development zones, high-tech industrial development zones, special customs supervision zones, border/cross-border economic cooperation zones, and other types of development zones. Since establishing development zones in China, various types of development zones have played an important role in infrastructure construction, cultivating talent, promoting social and economic development, and attracting foreign investment (Huang et al., 2017). However, with the continuous development of society and the economy, the construction of development zones has caused problems such as low land-use efficiency, unreasonable use of space scale, and chaotic space development, resulting in waste of land resources and repeated construction (Cheng et al., 2017).
To address these issues, the Chinese government has carried out macrocontrol on the spatial and geographic location of development zones, including providing tax incentives and adjusting industrial structure (Cai and Lu, 2019). These policies have played a key role in macrocontrol measures; however, the government has ignored the spatial effects of the development zones in promoting the development of surrounding urban land. Blind construction of development zones cannot bring equal benefits (Quan et al., 2015). China is currently in a critical period of urbanization transformation and development (Usman et al., 2015; Qiao et al., 2019; Rao et al., 2021), and the development zone affects the economic development and functional transformation of its surrounding areas through industrial agglomeration, population agglomeration, and urban land expansion (Wang et al., 2021). This means that the effective construction of development zones has greatly promoted the local urbanization process (Liu et al., 2019). Therefore, it is necessary to quantitatively analyze the effect of development zone construction on urban land use, which will help us deeply understand the spatiotemporal relationship between development zones and the surrounding urban land and provide decision support for the governments in constructing development zones and guiding urban land use.
With the establishment and rapid development of development zones, research on development zones has become a hot topic in management, economics, geography, and other disciplines (Jiao et al., 2018). Reese and Fasenfest (2003) evaluated the planning process of Federal Economic Development Zones in the United States. Heiduk and Pohl (2001) conducted empirical studies on the technology management and spatial interaction of the Wuhan National Development Zone. Numerous studies have focused on the evolution and driving forces of development zones (Wang and Xu, 2008; Zhang and Shi, 2011; Gao and Jin, 2015), economic growth, and efficiency evaluation (Huang et al., 2017; Liu, 2019; Sun et al., 2020), industrial spatiotemporal pattern characteristics (Fu et al., 2020; Tang et al., 2020; Tian et al., 2020) and future development trends (Yang, 2006; Wei, 2015; Qiu, 2018), which have demonstrated the effects caused by the establishment of development zones. However, in terms of the relationship between development zone construction and urban land, although Lin (2007) affirmed the important role of a development zone in promoting land urbanization, Liu (2019) analyzed the relationship between urban land expansion and the spatial economic policy of the Tianjin development zone, the quantitative discussion of the relationship between development zone construction and urban land expansion, and the spatiotemporal effect of the construction of a development zone on the surrounding urban land is not clear. In addition, scholars have mostly focused on typical areas such as the Yangtze River Economic Belt (Guan et al., 2020) and metropolitan areas (Su, 2006; Zhu et al., 2019; An, 2020), and macroresearch on large-scale national development zones across the country is insufficient.
Establishing development zones is an important way to promote urban land growth, while urban land growth is usually measured by urban land expansion (Li et al., 2014; Zubair, 2021). However, based on the literature, there was a lack of qualitative and quantitative research on the relationship between national-level development zones (NDZs) and their surrounding urban land growth. As one of the means for the Chinese government to manage the market and promote urban development, the measurement of the national development zones on the surrounding urban land growth will directly affect the urban land supply (Wang, 2016). The urban land supply was of great significance in promoting the development of urbanization in China (Xu, 2018). Therefore, it is necessary to focus on the relationship between the national-level development zone construction and the surrounding urban land growth first and then further measure the influence of the national-level development zone construction on the urban land growth in China.
Against the background described in earlier sections, this paper takes the economic and technological development zones and high-tech industrial development zones approved in the China Development Zone Audit Announcement Catalog (2018 Edition) as China’s NDZs. The impact of development zone establishment on the growth of surrounding urban land was quantitatively explored by using circle buffering analysis and time series comparative analysis to solve the following two issues:
(1) What are the spatiotemporal relationships between NDZ construction and surrounding urban land expansion from 1990 to 2018?
(2) How do NDZs affect the expansion of surrounding urban land, and how can it be quantitatively measured?

2 Data and methods

2.1 Study area and data sources

In China, NDZs refer to various development zones approved by the State Council to be established in urban planning areas that implement specific national preferential policies (Zhang et al., 2021). Considering that this paper mainly studies the spatial evolution of land use in development zones across the country, the selected development zones need to meet the conditions of a wide range of distribution and the requirements of data acquisition; the NDZs in this study include 219 economic and technological development zones, and 156 high-tech industrial development zones, namely, a total of 375 NDZs. We used the Baidu Map API to query and obtain the geographic coordinate data of each development zone one by one. Then, we took the geometric center point as a result to perform coordinate correction, and the data of each NDZ were spatially processed through ArcGIS 10.2 software to establish an “NDZ geospatial database”. To explore the spatiotemporal impact of NDZs established in different periods on surrounding urban land use, we divided the 375 NDZs into six types, including those established before 1990 and those established during 1991-1995, 1996-2000, 2001-2005, 2006-2010, and 2011-2018. The geographic locations of the NDZs established at different times are shown in Figure 1.
Figure 1 The geographic location of China’s national-level development zones (NDZs)
The land use data used in this paper were acquired from the Resource and Environmental Science Data Center of the Chinese Academy of Sciences (www.resdc.cn), including data in 1990, 2000, 2010 and 2018, with a resolution of 30 m. After random sampling by line inspection and kappa coefficient inspection, the accuracy rate of urban land data was not less than 95%, which met the accuracy of this study (Liu et al., 2014), and it underwent geographic coordinate correction and spatial projection calibration.

2.2 Methodology

2.2.1 Kernel density analysis

Density analysis is one of the important factors in the spatial characteristics of geographic element distribution (Tian et al., 2020). Using kernel density analysis, we can analyze the accumulation of samples in the area through the continuous density surface formed by known sample points (Berke, 2004). This paper explores the changes in the agglomeration centers of NDZs in 1990, 2000, 2010, and 2018 through kernel density analysis. The formula of the kernel density estimation is listed as follows:
$f(x)=\frac{1}{n{{h}^{d}}}\sum\nolimits_{i=1}^{n}{K\left( \frac{x-{{x}_{i}}}{h} \right)}$
where $K\left( \frac{x-{{x}_{i}}}{h} \right)$ is the kernel density function; h is the search bandwidth; n is the number of points in the known development zone i within the search bandwidth; and d is the dimension of the data.

2.2.2 Circle buffering analysis

In early research, the circle buffering analysis method was mainly applied to urban expansion. The division of the urban circle was centered on the city center to establish a series of equidistant buffer zones, which were used as the basic unit to describe the spatial differentiation of urban expansion, calculate relevant spatial indicators and analyze the spatial characteristics reflected in the process of urbanization in different periods (Li et al., 2003; Jiao, 2015). According to the approved scope and information in the China Development Zone Audit Announcement Catalog (2018 Edition), the average radius of the NDZs in this study is less than 5000 m. Therefore, we divided the development zone into different buffer circles by taking the center of each development zone as the center. A total of 50 buffer zones were built based on a 100 m buffer unit. We calculated the construction rate of the urban land of each buffer zone of the NDZs established in different periods and carried out statistical analysis to identify the linkages between the NDZs and their surrounding urban land.

2.2.3 Urban land expansion intensity index (ULEII)

The urban land expansion intensity index (ULEII) is defined with reference to the urbanization intensity index (UII) (Li et al., 2003). UII refers to the percentage of the expansion area of urban land used by a certain spatial unit in the unit period of its total land area. The index can standardize the average annual growth rate of urban land use in different spatial units, making the growth rates in different periods comparable. Similarly, the ULEII is used to compare the average annual growth rate of urban land in NDZs established during different periods. The formula is as follows:
$ULEI{{I}_{i}}=\frac{ULA_{i}^{t2}-ULA_{i}^{t1}}{TL{{A}_{i}}\times \Delta t}$
where ULEIIi is the annual average urban land expansion index of unit i; $\text{ }\!\!~\!\!\text{ }ULA_{i}^{t2},\ ULA_{i}^{t1}$ are the urban land areas of unit i at times t2 and t1, respectively; TLAi represents the total area of space unit i; and Δt represents the time span of the study.

2.2.4 Measurement of the impact of NDZs on urban land expansion

The urban land construction rate (ULCR) represents the percentage of urban land in a certain range to the total land-use area in the range at a certain time (Guan et al., 2012). This indicator indicates the level of urbanization development in a certain area. It can be compared to the extent of the impact of the development zone’s different distances on the surrounding urban land use. The formula is as follows:
$ULCR=\frac{{{A}_{urban}}}{{{A}_{total}}}\times 100\%$
where ULCR represents the urban land construction rate within a certain range at a certain time. Aurban represents the urban land area within a certain buffer radius, and Atotal represents the total land-use area within a certain buffer radius.
However, the ULCR cannot accurately identify the effect of NDZ establishment on surrounding urban land change. Urban land usually has a certain increase in non-NDZs, which means urban land growth is not necessarily brought about by NDZ construction (Huang et al., 2013; Quan et al., 2015). Based on this, we proposed using the difference between the ULCR and the ULCR of the non-NDZs in the same district to quantitatively identify the effect of NDZ construction on the surrounding urban land. The non-NDZs are bounded by 5000 m, as determined in the circle buffering analysis. The equations are as follows:
$IU=ULC{{R}_{NDZs}}-ULC{{R}_{non-NDZs}}$
$ULC{{R}_{non-NDZs}}=\frac{\mathop{\sum }_{i=1}^{n}A_{urban}^{i}-\mathop{\sum }_{i=1}^{m}A_{5km-urban}^{i}}{\mathop{\sum }_{i=1}^{n}A_{total}^{i}-\mathop{\sum }_{i=1}^{m}A_{5km-total}^{i}}$
where IU represents the impact of the NDZs on surrounding urban land; ULCRNDZs represents the urban land construction rate of the NDZs within a certain buffer radius at a given time point, which can be obtained by Formula (3); ULCRnonNDZs represents the urban land construction rate of the administrative district where the development zone is located minus the urban land construction rate of the NDZs of 5 km at a given time point (t); n represents the number of administrative districts with NDZs; m represents the number of established NDZs; $\sum\nolimits_{i=1}^{n}{A_{urban}^{i}}~$ represents the sum of the urban land area of each administrative district; $\sum\nolimits_{i=1}^{n}{A_{total}^{i}}$ represents the total land area of each administrative district; $\sum\nolimits_{i=1}^{m}{A_{5km-urban}^{i}}$ represents the total urban land area within 5 km of each established development zone at a certain moment; and $\sum\nolimits_{i=1}^{m}{A_{5km-total}^{i}}$ represents the sum of the total land area within 5 km of each development zone in a certain area.

3 Results

3.1 Spatial evolution characteristics of NDZs

Figure 2 shows the agglomeration of NDZs in 1990, 2000, 2010, and 2018. In 1990, NDZs were mainly concentrated in the eastern coastal area. There were no NDZs inland. The ker-nel density value of the Yangtze River Delta is the largest, indicating that the Yangtze River Delta developed rapidly and effectively under the influence of China’s reform and opening-up policy during this period. From 1990 to 2000, NDZs spread inland from coastal areas, and agglomeration of various degrees appeared in many provinces. From 2000 to 2018, the number of NDZs increased significantly, and NDZs were more widely distributed in space. However, compared with western China, more NDZs in eastern China were established during 2010-2018, which fully demonstrated that eastern China experienced rapid development in this period. Overall, from 1990 to 2018, the NDZs developed obviously with the development of the economy and society in China. There were more NDZs in eastern China than in western China, but they all drove China’s economic development as a whole (Wang, 2018). The findings indicated that there was a mutually reinforcing relationship between NDZ establishment and the development of China.
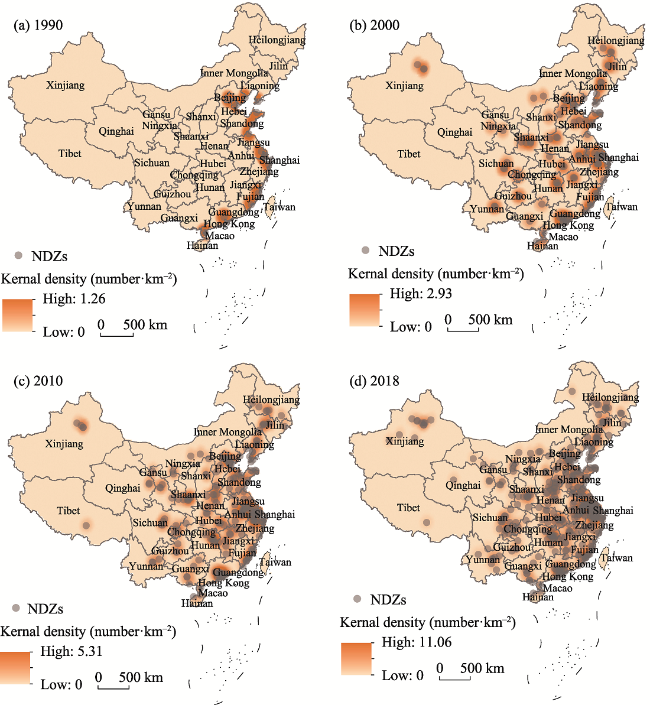
Figure 2 Kernel density of national-level development zones established in China during 1990-2018

3.2 Spatial influence of NDZs on the expansion intensity of urban land

Figure 3 shows the changes in the ULEII of NDZs established in different periods from 1990 to 2018. The overall ULEII increases with the expansion of the buffer zone, and the slope of the curve continues to increase, indicating that the NDZs present an extensional expansion mode within the 5000 m buffer. The lowest ULEII was observed during 1990-2000, while urban land expanded fastest from 2000 to 2010. The main reason was that China enjoyed a good development environment since joining the World Trade Organization (WTO) in 2001, and IU also increased significantly in this period.
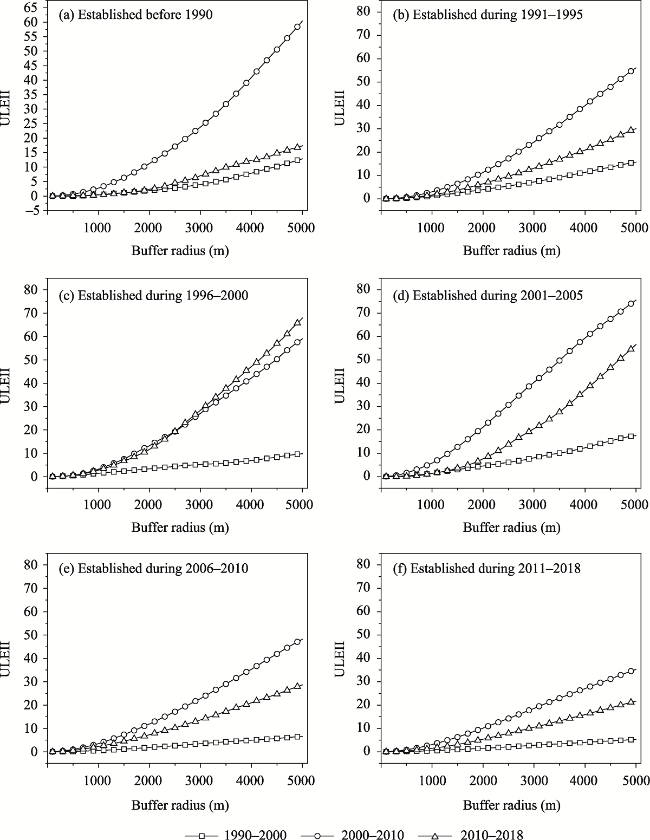
Figure 3 Diagram of ULEII changes in the national-level development zones of China
Considering the differences in geographical location, establishment time, and the type of development zones, we took the Lianyungang High-tech Industrial Development Zone (Lianyungang NDZ), Liaoyang High-tech Industrial Development Zone (Liaoyang NDZ), Nanjing High-tech Industrial Development Zone (Nanjing NDZ), Shanghai Jinqiao Economic and Technological Development Zone (Jinqiao NDZ), Wuhan Economic and Technological Development Zone (Wuhan NDZ), and Yangling Agricultural High-tech Industrial Development Zone (Yangling NDZ) as examples to analyze the changes in the intensity of urban land expansion from 1990 to 2018 (Figure 4). Three growth modes, including post-growth, pre-growth, and steady-growth, were identified based on the changes in urban land within different buffers. From 1990 to 2018, the urban land in these 6 typical NDZs was effectively developed, and changes in newly increased urban land in NDZs under different growth patterns varied with time. Figure 5 shows the newly increased urban land between 1990 and 2018 in 6 typical NDZs within the buffer zone radius of 5,000 m, which can also verify the differences among the three modes.
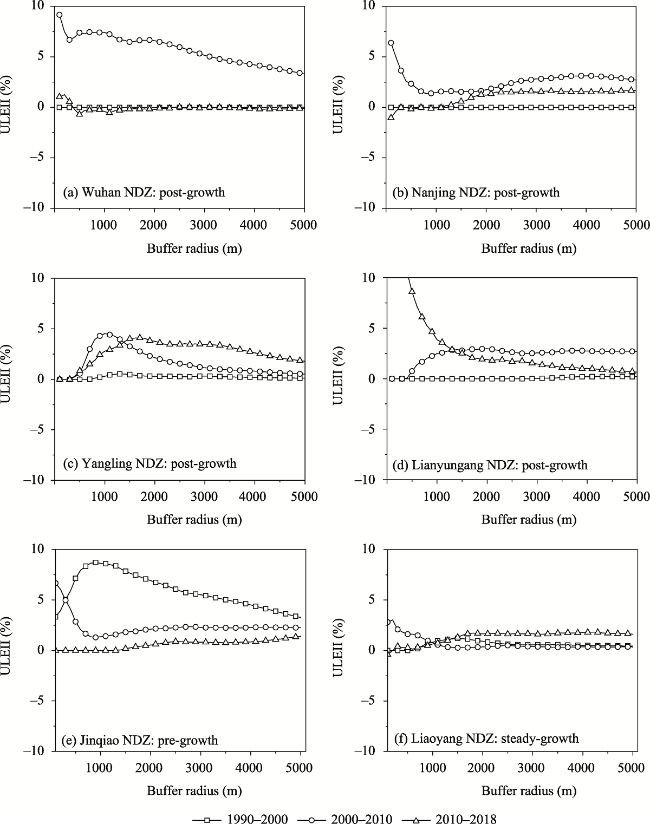
Figure 4 Diagram of the ULEII in 6 typical national development zones of China
Figure 5 Urban land expansion within 5 km buffers of 6 typical national development zones during 1990-2018
(1) Post-growth
Post-growth was represented by Wuhan NDZ, Nanjing NDZ, Yangling NDZ, and Lianyungang NDZ (Figures 4a-4d). The ULEII of post-growth remained stable from 1990 to 2000 and changed obviously from 2000 to 2018. There was no obvious new urban land growth during 1990-2000; however, a large scale of newly increased urban land was found during 2000-2018. In terms of the spatial distribution of urban land development, the urban land post-growth was relatively small and concentrated in the middle or one side of the 5000 m buffer zone (Figure 5).
(2) Pre-growth
Pre-growth was represented by Jinqiao NDZ (Figure 4e). The ULEII of the pre-growth mode changed faster from 1990 to 2010 than that during 2010-2018. The urban land of the pre-growth mode reached a relatively large scale in 2000, while the changes in urban land from 2010 to 2018 were small. The pre-growth urban land was widely distributed within the 5000 m buffer zone, indicating that the NDZs played a key role in spurring urban land expansion.
(3) Steady-growth
The third model was steady-growth, represented by Liaoyang NDZ (Figure 4f). The ULEII of the steady-growth mode changed smoothly from 1990 to 2018, which indicated a steady trend of urban land expansion. The urban land of steady-growth was relatively smaller than that of pre-growth. Unlike the other two modes, the NDZs of steady growth have a moderate impact on the surrounding land.
Different development modes meant that NDZs had different changes in the ULEII in different periods. The main reason was that NDZs were established at different times with different industrial types and locations. On the whole, the establishment of NDZs promoted the development of urban land around them to varying degrees, and promoted the transformation of China's urban land growth.

3.3 Effect of national development zones on urban land growth

Figure 6 shows the changes in the IU of NDZs established in different periods from 1990 to 2018. Overall, the establishment of NDZs promoted the expansion of surrounding urban land. In 1990, the IU of the NDZs established before 1990 was significantly higher than that of the NDZs established after 1990, while the NDZs established during 2006-2010 and 2011-2018 were not yet established, indicating that the establishment of the NDZs promoted the development of their surrounding urban land.
Figure 6 IU changes over time of China’s national-level development zones established in different periods
After a certain time of development, the IU increased to at least 50%, and the IU of some buffer areas around NDZs reached more than 75%. For example, in 2010, the IU of the buffer areas less than 2000 m of NDZs established during 2001-2005 reached 75%, while in 2018, the IU of the buffer areas less than 1400 m of NDZs established during 1996-2000 and 3900 m of NDZs established during 2001-2005 also reached 75%. The fastest growth of IU was observed during 2000-2010 due to the joining of the WTO. From 2010 to 2018, the IU of each NDZ was still rising, but the development speed was different: the IU of the NDZs established during 2006-2010 and 2011-2018 was growing faster than the NDZs established before, and the IU of the NDZs established before 1990 gradually tended to be saturated without a significant increase. The results showed that the promoting effect of the NDZs on the development of the surrounding urban land tended to decline during 1984-2010 after the establishment of NDZs.
To further identify the promotion effect brought by the establishment of NDZs on the development of the surrounding urban land, we mapped the relationship between the IU and the buffer radius of the NDZs in 1990, 2000, 2010, and 2018. The radius buffers where the IU reached 25%, 50%, and 75% are marked in Figure 7. Overall, the IU around the NDZs decreased with increasing buffer zone radius since the establishment of NDZs. In 2000 and 1990, the IU of the NDZs established during 1991-1995 and 2001-2005 reached 25% in the 100 m buffer zone radius, respectively, indicating that the 100 m buffer was the core area of the NDZs.
Figure 7 IU changes and important national-level development zone nodes established in different periods
The IU of the NDZs established before 1990 reached 25% at a 1300 m buffer radius, and the curve slope was higher before 1300 m and became smoother after 1300 m, indicating that the most efficient buffer radius to promote surrounding urban land development before 1990 was 1300 m. In addition, in 1990, the IU in NDZs established before 1990 appeared to have an inverted V shape in the buffer radius of 3400 m, while in 2000 and 2010, the buffer radii of 25% and 50% were 3400 m and 3200 m, respectively. This result indicated that 3400 m might be the maximum buffer radius of the NDZs established before 1990 to promote the surrounding urban land growth. In 2010 and 2018, the IU curve of the NDZs established from 1996 to 2000 showed an overall trend of “decline-upgrade-decline”, indicating that there were two maximum points. The first extreme point was the 100 m buffer radius in 2010 and 2018. The second extreme point is the buffer radius of 900 m and 1000 m in 2010 and 2018, respectively, indicating that the promotion effect of the development zone on urban land around the NDZs established from 1995 to 2000 is the largest under buffer radii of 100 m and 900-1000 m. In 1990 and 2000, the IU in NDZs established from 2001 to 2005 declined rapidly before the 600-700 m buffer zone radius, and there was an abnormal decline point of 800 m in 2010 and 2018, showing a V shape, which meant that the 800 m buffer radius might be the boundary for the development of the development zone in the region. The 800 m buffer radius was the core area with stable development, and the 800 m buffer radius was the area with continuous expansion. Therefore, it is obvious that the establishment of NDZs can promote the development of surrounding urban land. The most efficient buffer radius of all NDZs to promote surrounding urban land development was 100 m, and the most efficient buffer radii of NDZs established before 1990, 1996-2000, and 2001-2005 were 1300 m, 900-1000 m, and 800 m, respectively.
For the radius of the buffer zone over 4000 m, the slope of the IU was still negative, while the IU of the NDZs was mostly lower than the observed values of 25%, 50%, and 75%, indicating that the urban land growth promotion brought by the NDZs after 4000 m was not as obvious as the radius of the buffer zone before 4000 m.

4 Discussion

The construction of NDZs in China is a typical regional development mode driven by policies and planning. The NDZs have clear policy planning (Zhang and Wang, 2019). The kernel density analysis indicated that the NDZs spread from the east coast to the inland during 1990-2018. Several typical agglomeration areas, such as the Beijing-Tianjin-Hebei development region, the Yangtze River Economic Belt, and the Pearl River Delta, were concentrated in the regions with the most rapid economic development. In contrast, the NDZs of the central and western regions were less and widely distributed in space. The spatial characteristics coincide with China’s economic development policy. The establishment of NDZs and economic increases complement each other and jointly promote China’s development (Wang et al., 2020). The number of NDZs increased rapidly with the active policy of China, which fully showed that the establishment of NDZs was subject to the macrocontrol of national policies (Ma, 2018; Zhang and Wang, 2020).

4.1 Promotion effects of the establishment of national development zones on surrounding urban land growth

Urban land growth in China is influenced by changes in urban land use (Li et al., 2014). We calculated the change in urban land use by IU, and there were significant differences in IU around the NDZs in different periods. In 1990, the IU of NDZs established before 1990 was significantly higher than that of NDZs established in other periods under each buffer zone radius. In 1990 and 2000, the IU of the NDZs established during 2006-2010 and 2011-2018 was lower than that of the NDZs established in other periods. The findings showed that the development of the surrounding urban land of the NDZs was obviously different before and after the establishment of the NDZs. The IU was low before the establishment of NDZs. In contrast, after establishing the development zone, the IU was significantly improved, indicating the obvious urban land growth caused by the establishment of the NDZs.
From the perspective of space, the establishment of the NDZs had a clear agglomeration range in promoting the development of surrounding urban land. On the whole, the promotion effect of the established NDZs on the surrounding urban land decreased with the expansion of the buffer zone radius, and the majority of NDZs were lower than the observed value (25%, 50%, and 75%) after 4000 m, which indicated that the establishment and construction scale of the NDZs should be controlled according to the most efficient scale of development. In the existing research, there was not the most efficient scale for the NDZs to promote the growth of the surrounding urban land. We plotted the IU change curve of NDZs established in different years. Then, by observing the point of inflection, we determined that the most efficient buffer zone radii were 1300 m, 900-1000 m and 800 m for the NDZs established before 1990 and during 1996-2000 and 2001-2005, respectively. The results can provide a theoretical basis for the government to determine a reasonable scale when establishing new development zones.
The promotion effect of establishing the NDZs on the surrounding urban land changed over time. However, due to insufficient development time since the establishment of the NDZs, it was impossible to accurately identify whether the NDZs established in recent years had reached the threshold level. From the IU of the NDZs established before 1990, the IU changed gently with the expansion of the buffer radius in 2010 and 2018 and was not significantly changed in 2018, indicating that the urban land had developed to a relatively stable level during 2010-2018. The maximum establishment time of the NDZs was 34 years (1984-2018), but the IU of the NDZs established in 1984 was not obviously changed in 2010, which meant that the maximum time limit for the NDZs to promote the surrounding town urban land was approximately 26 years (1984-2010). Since the changes in urban land use in NDZs established after 1990 were still relatively obvious, there were no further data to analyze the promotion effect of the time of NDZ establishment on the surrounding urban land use.
Based on the above analysis, the NDZs effectively promoted urban land growth. With the calculation of the IU of the NDZs established at different times, we found that the spatial promotion of NDZs on surrounding urban land growth can be quantified, which made up for the lack of research on the relationship between development zones and surrounding urban land growth. However, since the establishment time of NDZs varied, there was not enough data to show that there was an obvious time threshold. The time threshold will be one of the focuses of future research on the relationship between the development zones and urban land growth.

4.2 The relationship between the ULEII and buffer radius of national development zones

For the NDZs as a whole, the ULEII maintained a stable level of low growth within the radius of the 500 m buffer zone. After 500 m, the ULEII rose with the continuous expansion of the buffer zone radius, which showed that the development of the NDZs was relatively stable and expanded outward. The ULEII in the majority of NDZs was the largest within the radius of each buffer zone from 2000 to 2010, which was closely related to the economic easing policy adopted by China after its accession to the WTO, indicating that the surrounding urban land of the NDZs developed quickly during this period. The ULEII of the NDZs established during 1996-2000 was also significantly affected by the economic easing policy adopted by China. The ULEII from 2011 to 2018 was greater than that from 2001 to 2010, which also showed that the policy had the greatest impact on the NDZs established in 1996-2000 and that the development of the NDZs was affected by the macro policy.
As seen from the ULEII of the NDZs established at different periods, for the NDZs established before 1990 and during 1991-1995, the ULEII under each buffer zone radius during 2010-2018 was close to the ULEII during 1990-2000. For the NDZs established after 1996, the ULEII under each buffer zone radius during 2010-2018 was closer to the ULEII during 2000-2010. It showed that for the NDZs established before 1995, the level of urban land expansion from 2010 to 2018 was close to that from 1990 to 2000, while for the NDZs established after 1996, the level of urban land expansion remained at a relatively high level from 2010 to 2018, indicating that the urban land expansion in the NDZs also had a certain timeliness.

4.3 How to promote the development of national development zones more efficiently

4.3.1 Comprehensive consideration of the location factor layout

Since the establishment of China’s NDZs in 1984, their geographical locations have changed with changes in social and economic development needs. However, in the context of China’s urbanization, the urbanization of various administrative units accelerated, and disorderly urbanization had a certain negative impact on social and economic development (Li et al., 2020). Therefore, adapting to the new social and economic development needs will help promote the establishment and development of NDZs in the future.
Among the 375 NDZs studied in this paper, 176 were established during 2011-2018, accounting for 47%, which means that the NDZs have increased rapidly in recent years because of the development of society and economy in China. To adapt to the needs of the society and economy in China, it was necessary to consider new agglomeration points except for the Yangtze River Delta and the Pearl River Delta. More consideration should be given to areas with weak domestic development and gradually build a network of NDZs. In addition, the Chinese government should make full use of existing resources, should not blindly establish new NDZs, and should avoid wasting resources for the development of NDZs in the future, which may be useful for NDZs and society to develop sustainably.

4.3.2 Coordination of the urban land supply

NDZs usually had the most efficient scale for promoting surrounding urban land, while the most efficient scales of NDZs established at different periods were different, and disorderly expansion of NDZs could not guarantee simultaneous improvement of development efficiency (Wu and Yang, 2021). In contrast, the excessive scale of development zones strained the urban land supply (Shen et al., 2018). The shortage of urban land supply aggravated the contradiction between man and land and made the phenomenon of idle land more serious. In addition, the tight supply of urban land affected the efficiency of urban development and was not conducive to the sustainable development of society (Hsu et al., 2017; Kong et al., 2022). To solve this problem, it is necessary to rationally utilize urban land resources, and the Chinese government should exercise the rights of market players, and fully consider the scale of the development zone, which will not only improve the development efficiency of the development zone but also ensure the supply of urban land to a certain extent.

4.3.3 Innovation of national support policies

The development of the NDZs was strongly supported by national policies; however, after a long period of development, the policy effects of the NDZs were weakened. In addition, the findings on the intensity of urban land expansion showed that the expansion of urban land in the NDZs accelerated with the expansion of the buffer zone radius, indicating that the external area of the NDZs was developing increasingly faster, and the government chose to continuously expand the area of the development zone instead of optimizing the interior of the development zone. They aim to absorb new resources to expand the effectiveness of NDZs. Therefore, it is necessary to pay attention to the NDZs’ own resources and avoid ineffective expansion. The government should improve the original policies, such as grading and optimizing tax reduction and exemption policies, improving the development level of an open economy, promoting foreign trade, foreign investment, and industrial transfer, and consolidating the internal development level of the existing areas in the NDZs.

5 Conclusion

This paper analyzed the spatiotemporal relationships between NDZ construction and surrounding urban land growth from 1990 to 2018. We systematically explored the promotion effects of the surrounding urban land caused by establishing the development zone and its most efficient scale. The results showed that the 100 m buffer radius was the core of the land around all the NDZs. In addition, the most efficient scales of the NDZs established before 1990, 1996-2000, and 2001-2005 were 1300 m, 900-1000 m, and 800 m, respectively. According to the ULEII around the NDZs, it was found that the ULEII around the NDZs increased with the expansion of the buffer radius, and the ULEII of the NDZs was the highest during 2000-2010. We identified three urban land expansion models: post-growth, pre- growth, and steady-growth. To promote the development of NDZs, maximize their important role in social and economic development, and coordinate the urban land supply, we suggest that the government comprehensively evaluate factors in the locations, internal resources, development efficiency, and supporting policies of NDZs in the future.
[1]
An G, 2020. Research on economic operation efficiency of Wuhan urban circle development zone[D]: Wuhan: Central China Normal University (in Chinese)

[2]
Berke O, 2004. Exploratory disease mapping: Kriging the spatial risk function from regional count data. International Journal of Health Geographies, 3: 1-11.

[3]
Cai S Z, Lu L, 2019. The evolution of China’s national economic and technological development zones and their industrial spatial structure. Scientia Geographica Sinica, 39(3): 415-423. (in Chinese)

[4]
Chen L G, Guo L F, 2004. Status quo, causes and countermeasures of land utilization in development zones in my country. Journal of China Agricultural Resources and Regional Planning, 25(3): 1-5. (in Chinese)

[5]
Cheng H, Liu Y T, He S J et al., 2017. From development zones to edge urban areas in China: A case study of Nansha, Guangzhou city. Cities, 71: 110-122.

DOI

[6]
Demurger S, Sachs J D, Woo W T et al., 2002. The relative contributions of location and preferential policies in China’s regional development: Being in the right place and having the right incentives. China Economic Review, 13(4): 444-465.

DOI

[7]
Deng F F, 2003. Development zones and urban land reform in China. Asian Geographer, 22(1/2): 5-25.

DOI

[8]
Fu J, Li J, Jia H W, et al., 2020. Temporal and spatial changes of development zones and industries in western China. Arid Land Geography, 43(4): 1136-1145. (in Chinese)

[9]
Gao C, Jin F J, 2015. Spatial pattern and industrial characteristics of economic technological development areas in eastern coastal China. Acta Geographica Sinica, 70(2): 202-213. (in Chinese)

DOI

[10]
Guan D J, He X J, Chen L, 2020. Characteristics and spatial difference of urban scale expansion in different scales in the Yangtze River Economic Belt. Journal of Chongqing Jiaotong University (Natural Science), 39(6): 108-116. (in Chinese)

[11]
Guan X L, Fang C L, Zhou M, et al., 2012. Analysis on the spatial and temporal characteristics of urban land expansion in Wuhan urban agglomeration. Journal of Natural Resources, 27(9): 1447-1459. (in Chinese)

[12]
Heiduk G, Pohl N, 2001. Empirical evidence from Wuhan’s state-level economic development zones. Journal of the Asia Pacific Economy, 6(2): 244-260.

DOI

[13]
Hsu W T, Li X L, Tang Y, et al., 2017. Determinants of urban land supply in the People’s Republic of China: How do political factors matter? Asian Development Review, 34(2): 152-183.

DOI

[14]
Huang Q H, Li M C, Liu Y X, et al., 2013. Using construction expansion regulation zones to manage urban growth in Hefei city, China. Journal of Urban Planning and Development, 139(1): 62-69.

DOI

[15]
Huang Z J, He C F, Zhu S J, 2017. Do China’s economic development zones improve land use efficiency? The effects of selection, factor accumulation and agglomeration. Landscape and Urban Planning, 162: 145-156.

DOI

[16]
Jiao B B, Zhang Z H, Xiao X J, et al., 2018. A study on the development stages and temporal and spatial distribution characteristics of China’s development zones. Science Research Management, 39(10): 50-60. (in Chinese)

[17]
Jiao L M, 2015. Urban land density function: A new method to characterize urban expansion. Landscape and Urban Planning, 139: 26-39.

DOI

[18]
Jones D C, Cheng L, Owen A L, 2003. Growth and regional inequality in China during the reform era. China Economic Review, 14(2): 186-200.

DOI

[19]
Kong X S, Fu M X, Zhao X, et al., 2022. Ecological effects of land-use change on two sides of the Hu Huanyong Line in China. Land Use Policy, 113: 105895.

DOI

[20]
Li H, Wei Y H D, Huang Z J, 2014. Urban land expansion and spatial dynamics in globalizing Shanghai. Sustainability, 6(12): 8856-8875.

DOI

[21]
Li X W, Fang J Y, Piao S L, 2003. The expansion intensity, pattern and spatial characteristic of urban land use in Shanghai. Journal of Natural Resources, 18(4): 412-422. (in Chinese)

[22]
Li X W, Fang J Y, Piao S L, 2003. Spatial characteristics and comparison of urban land expansion in Shanghai and surrounding major cities and towns. Geographical Research, 22(6): 769-779, 813-814. (in Chinese)

[23]
Li Y J, Kong X S, Zhu Z Q, 2020. Multiscale analysis of the correlation patterns between the urban population and construction land in China. Sustainable Cities and Society, 61(4): 102326.

DOI

[24]
Lin G C S, 2007. Reproducing spaces of Chinese urbanisation: New city-based and land-centred urban transformation. Urban Studies, 44(9): 1827-1855.

DOI

[25]
Liu J J, 2019. Research on the measurement of land use efficiency in development zones and improvement countermeasures[D]: Beijing: China University of Geosciences. (in Chinese)

[26]
Liu J Y, Kuang W H, Zhang Z X et al., 2014. Spatiotemporal characteristics, patterns, and causes of land-use changes in China since the late 1980s. Journal of Geographical Sciences, 24(2): 195-210.

DOI

[27]
Liu Z G, Zhang J Y, Golubchikov O, 2019. Edge-urbanization: Land policy, development zones, and urban expansion in Tianjin. Sustainability (Switzerland), 11(9): 2538.

DOI

[28]
Ma R Z, 2018. The status quo and research of development zones in China. Modern Business, 20: 159-160. (in Chinese)

[29]
Qiao W F, Wang Y H, Ji Q Q, et al., 2019. Analysis of the evolution of urban three-dimensional morphology: The case of Nanjing city, China. Journal of Maps, 15(1): 30-38.

DOI

[30]
Qiu W, 2018. Talking about the redevelopment of the urban inefficient land in Nanchang economic and technological development zone. Science & Technology Information, 16(1): 212-213. (in Chinese)

[31]
Quan B, Bai Y J, Römkens M J M, et al., 2015. Urban land expansion in Quanzhou city, China, 1995-2010. Habitat International, 48: 131-139.

[32]
Raheem A A, 2011. Impact of special economic zone (SPZ) on human development and poverty reduction: An Indian experience. International Journal of Multidisciplinary Research, 1(7): 177-188.

[33]
Rao Y, Dai J, Dai D, et al., 2021. Effect of urban growth pattern on land surface temperature in China: A multi-scale landscape analysis of 338 cities. Land Use Policy, 103: 105314.

DOI

[34]
Reese L A, Fasenfest D, 2003. Planning for development: An assessment of the economic development district planning process. Economic Development Quarterly, 17(3): 264-279.

DOI

[35]
Shen L, Sun Y Z, 2016. Review on carbon emissions, energy consumption and low-carbon economy in China from a perspective of global climate change. Journal of Geographical Sciences, 26(7): 855-870.

DOI

[36]
Shen X Y, Huang X J, Li H, et al., 2018. Exploring the relationship between urban land supply and housing stock: Evidence from 35 cities in China. Habitat International, 77(August 2017):80-89.

DOI

[37]
Su W Z, 2006. Dynamic changes of urban land use patterns in the fringe of metropolis: Taking Nanjing City as an example. World Regional Studies, 15(3): 75-81. (in Chinese)

[38]
Sun Y F, Ma A B, Su H R, et al., 2020. Does the establishment of development zones really improve industrial land use efficiency? Implications for China’s high-quality development policy. Land Use Policy, 90(129): 104265.

DOI

[39]
Tang C L, Chen W Y, Wu J M, et al., 2020. Research on the spatial distribution and industrial agglomeration characteristics of development zones in the Yangtze River economic zone. Scientia Geographica Sinica, 40(4): 657-664. (in Chinese)

[40]
Tian Y, Chen J, Dong Y, et al., 2020. Type and spatial evolution of the leading industries in the Yangtze River Economic Belt: A case study of the national and provincial development zones. Economic Geography, 40(12): 100-108. (in Chinese)

[41]
Usman M, Liedl R, Shahid M A, et al., 2015. Land use/land cover classification and its change detection using multi-temporal MODIS NDVI data. Journal of Geographical Sciences, 25(12): 1479-1506.

DOI

[42]
Walcott S M, Xiao W B, 2000. High-tech parks and development zones in metropolitan Shanghai: From the industrial to the information age. Asian Geographer, 19(1/2): 157-179.

DOI

[43]
Wang J S, 2016. Urban and rural construction land economic benefit analysis of Weihai City: Taking Weihai port economic development zone as an example[D]: Lanzhou: Lanzhou Jiaotong University. (in Chinese)

[44]
Wang M X, Zhou G H, Wang Y M, 2020. Analysis of the influence and mechanism of development zone construction on regional economic development: Taking Hunan province as an example. Resources and Environment in the Yangtze Basin, 29(3): 580-587. (in Chinese)

[45]
Wang M, Krstikj A, Koura H, 2021. The potential of special zone development as a tool in land-use control: A case study of Yinchuan city, western China. Journal of Asian Architecture and Building Engineering, 20(4): 477-491.

DOI

[46]
Wang X P, Xu J, 2008. The development and evolution of China’s urban development zone group: Taking Nanjing as an example. China City Planning Review, 3(3): 25-32. (in Chinese)

[47]
Wang Z B, 2018. Land spatial development based on carrying capacity, land development potential, and efficiency of urban agglomerations in China. Sustainability, 10(12): 4701.

DOI

[48]
Wei G, 1999. Special economic zones and the opening of the Chinese economy: Some lessons for economic liberalization. World Development, 27(7): 1267-1285.

DOI

[49]
Wei Y D, 2015. Zone fever, project fever: development policy, economic transition, and urban expansion in China. Geographical Review, 105(2): 156-177.

DOI

[50]
Wu S P, Yang Z, 2021. Government behavior on urban land supply: Does it follow a prospect preference? Journal of Real Estate Finance and Economics. https://link.springer.com/article/10.1007/s11146-021-09832-6#citeas.

[51]
Xu L D, 2018. Study on evaluation and promotion of land intensive use in new urbanization: A case study of Hangzhou high-tech zone[D]: Zhejiang: Zhejiang University. (in Chinese)

[52]
Yang Y P, 2006. The historical turning point and future trend of the development of my country’s development zone. On Economic Problems, (2): 10-12. (in Chinese)

[53]
Zhang K Y, Wang W Q, 2020. Has the expansion of the development zone promoted regional economic growth? Based on the comparative analysis from the macro and meso perspectives. Journal of Southwest University (Natural Science Edition), 42(8): 117-128. (in Chinese)

[54]
Zhang R R, Liu W D, Song Z Y, 2021. Research on the spatio-temporal evolution process and driving forces of China’s national development zone based on geographic detector. Journal of Natural Resources, 36(10): 2672-2683. (in Chinese)

DOI

[55]
Zhang X, Wang X P, 2019. A study on the characteristics of the policy evolution of China’s development zones in the past 40 years of reform and opening up. Urban Planning Forum, (2): 61-67. (in Chinese)

[56]
Zhang X P, 2002. The development characteristics and motive mechanism of my country’s economic and technological development zones. Geographical Research, 21(5): 655-656. (in Chinese)

[57]
Zhang Z B, Shi A L, 2011. Development zones and evolvement of urban spatial structure: A case study on Lanzhou city. Procedia Environmental Sciences, 11(Part C):1529-1534.

DOI

[58]
Zheng G, Barbieri E, Di Tommaso M R, et al., 2016. Development zones and local economic growth: Zooming in on the Chinese case. China Economic Review, 38(59): 238-249.

DOI

[59]
Zhu X H, Zhang P F, Wei Y G, et al., 2019. Measuring the efficiency and driving factors of urban land use based on the DEA method and the PLS-SEM model: A case study of 35 large and medium-sized cities in China. Sustainable Cities and Society, 50(6): 101646.

DOI

[60]
Zubair O A, 2021. Investigating urban growth and the dynamics of urban land cover change using remote sensing data and landscape metrics. Papers in Applied Geography, 7(1): 67-81.

DOI

Outlines

/