Research Articles

The drivers and spatial distribution of economic efficiency in China’s cities

  • CAO Yanni , 1, 2 ,
  • WU Tong 1 ,
  • KONG Lingqiao 1 ,
  • WANG Xuezhi 3 ,
  • ZHANG Lufeng 2 ,
  • OUYANG Zhiyun , 1, *
Expand
  • 1. State Key Laboratory of Urban and Regional Ecology, Research Center for Eco-Environmental Sciences, CAS, Beijing 100085, China
  • 2. University of Chinese Academy of Sciences, Beijing 100049, China
  • 3. Computer Network Information Center, CAS, Beijing 100190, China
* Ouyang Zhiyun (1962-), PhD and Professor, E-mail:

Cao Yanni (1990-), PhD and Postdoctoral Researcher, E-mail:

Received date: 2021-06-21

  Accepted date: 2021-12-22

  Online published: 2022-10-25

Supported by

Key Project of National Natural Science Foundation of China(71533005)

The Strategic Priority Research Program of the Chinese Academy of Sciences(XDA19050504)

Abstract

This study analyzes cities in China at the prefecture level and above to calculate indices for “urban economic efficiency” (the relationship between input factors and output) and “urbanization economic efficiency” (the relationship between newly increased output and increased economic input), based on the Stochastic Frontier Analysis (SFA) method. We compare and analyze the factors influencing change and their spatial distributions. The results show that capital and labor rather than urban land could effectively improve urban and urbanization economic efficiency. And, although the proportion of wages to GDP has a significant negative impact on urban economic efficiency, for social equity and stability, the proportion should be increased; if appropriate, it would not significantly reduce urbanization economic efficiency. Additionally, population density, population urbanization rate, and government fiscal expenditure significantly positively impact urban and urbanization economic efficiency. However, we also found that increases in the degree of industrial structure deviation and urban landscape fragmentation are harmful to urbanization economic efficiency. In terms of spatial distribution, the urbanization economic efficiency of most of China’s northeastern and eastern coastal areas is significantly lower than that of other regions; at the same time, the urban economic efficiency of most of these cities has been decreasing, especially in the northeast, which warrants greater policy attention.

Cite this article

CAO Yanni , WU Tong , KONG Lingqiao , WANG Xuezhi , ZHANG Lufeng , OUYANG Zhiyun . The drivers and spatial distribution of economic efficiency in China’s cities[J]. Journal of Geographical Sciences, 2022 , 32(8) : 1427 -1450 . DOI: 10.1007/s11442-022-2004-7

1 Introduction

According to the National Bureau of Statistics (2001, 2016), China’s population urbanization rate was 36.22% in 2000 and 56.1% in 2015, indicating an average annual growth rate of nearly 1.33%: this data indicates the rapidity of urbanization. This also marks the fastest development stage in the process of urbanization (Chen and Luo, 2006; Deng et al., 2015), and previous studies show that when the urbanization rate reaches 50%, cities see an escalation of urban problems (Liu and Wang, 2004; Zhao and Zhao, 2012; Wang et al., 2021). In 2011, China’s urbanization rate exceeded 50% for the first time, reaching 51.27%, which indicates that China has entered the stage where urban problems are likely to multiply and intensify. The rate of urbanization will decelerate in the future, indicating that there should be a shift in China’s urbanization model, from speed oriented development mode to quality oriented development mode. According to the United Nations’ prediction, China’s urban population will reach at least one billion by 2050. At the end of 2018, the country’s urban population was approximately 830 million, which means there is an expected increase of at least 170 million urban residents over the next three decades. These will intensify the challenges faced by urban development, making the improvement of urban economic structure an urgent policy concern. This requires a clear understanding of how to effectively improve urban economic efficiency and urbanization economic efficiency - the challenges that this study aims to address.
Apart from challenges in urban development, China is currently facing the risk of “middle-income trap” (Woo, 2012; Zeng and Fang, 2014). Researchers have proposed that measures should be taken to improve total factor productivity, expand the accumulation of human capital (Cai, 2012), adjust industrial structure (Zeng and Fang, 2014), and improve wage distribution levels (Islam, 2014), with the ultimate goal of improving the economic efficiency of cities. However, the above suggestions are far from sufficient for the government to formulate direct intervention policies. First, China is vast in territory, and the specific developmental conditions of regions and cities can differ markedly. Second, when policies are being designed and implemented, a crucial but often underappreciated question is: which factors should receive priority attention? Should these factors be increased or decreased? What should the strength of regulations be? This study will analyze the spatial variation characteristics of urban economic efficiency and urbanization economic efficiency to answer these research questions.

2 Literature review

2.1 Urban economic efficiency

Some studies use the effective labor market of cities to measure urban economic efficiency (Sridhar, 2020), while others have used commercial office rent as an indicator (Drennan and Brecher, 2012). In this study, “urban economic efficiency” refers to the relationship between input and output factors. More specifically, the essential input factors include capital, labor force, and land; the output factor is GDP-related indicators. However, the existing research does not yet have a consensus on the selection of indicators (Li et al., 2005; Fang et al., 2012; Zhang et al., 2012; Piña and Martínez, 2016; Jin et al., 2018). Urban economic efficiency is only one aspect of urban efficiency (Ren et al., 2018; Shang et al., 2020). In particular, for some studies, the meaning of urban economic efficiency is equivalent to urban efficiency (Zhang and Liu, 2011; Xi, 2012; Chen et al., 2016; Zhan et al., 2018; Liu et al., 2020). Also, in recent years, due to the importance of “ecological civilization” (or more generally the imperatives of sustainable development) in China, there has been an outpouring of research on urban ecological efficiency, which is the study of urban economic efficiency that also considers resources, energy consumption, and pollution (Yin et al., 2014; Bai et al., 2018; Zhao et al., 2018; Tang et al., 2020; Wang et al., 2020). There are also studies on urban land use economic efficiency, which considers environmental indicators and is consistent with urban ecological efficiency (Xie and Wang, 2015a).

2.2 Urbanization economic efficiency

According to most existing studies, “urbanization economic efficiency” is urban economic efficiency, but incorporates the change of relevant factors with time (Jin et al., 2018) (because the original data used in calculations are the annual data). Because “urban economic efficiency” refers to the relationship between annual economic output and factor inputs, “urbanization economic efficiency” should naturally refer to the relationship between newly increased economic output and newly increased factor inputs. This means the influencing factors of urban economic efficiency and urbanization economic efficiency are the same, but their connotation and mechanisms differ. It is necessary to study urban economic efficiency and its changes as well as urbanization economic efficiency.

2.3 Index selection and optimization

The existing literature on influencing factors can be divided into single-factor (Wei and Yang, 2012; He, 2014; Wei and Yu, 2018) and total-factor research (Hou et al., 2012; Xu et al., 2018). This paper argues that single-factor research is not adequate to guide the formulation of urban economy macro-control policies. For example, some studies state that urban economic efficiency will increase alongside increases in population size (Kim et al., 2014); Mera (1973) argues that even the largest cities had, at that time, not yet reached the ideal size. However, urban and urbanization economic efficiency result from the combined effect of population-scale and other factors. To improve urban economic efficiency, we need to adjust and control these other factors in addition to population scale. Therefore, this study uses the total-factor approach.
Existing research can be further divided into two categories depending on whether environmental factors are considered. Research considering environmental factors includes the pollution emission index in the input and output factors (Lu et al., 2011; Xie and Wang, 2015a; Zhang et al., 2016). In the context of the construction of ecological civilization (Hu, 2014; Feng, 2019) and China’s “new normal” of slower but “higher-quality” economic development (Wang, 2015), pollution reduction and zero emissions have become crucial (Zhu and Gao, 2014; Xu and Cheng, 2016). A large amount of capital is required for pollution reduction, and there is often conflict between the achievement of ecological benefits and economic benefits. Therefore, the Chinese government has promulgated and put into effect laws and regulations regarding environmental protection (Jones, 1988; Bayer, 2006). This study argues that national policy has been clear on coping with the relationship between economic development and pollution discharge. Therefore, this study does not consider the pollution emission index in the analysis.
Existing research has shown diversity in the selection of factor indexes. For example, land, an indispensable input factor, has been overlooked in many studies (Yu et al., 2006; Halkos and Tzeremes, 2009; Xuan and Nakamura, 2013; Wang et al., 2016). Many researchers use fixed asset investment as the capital investment index (Yu et al., 2006; Xie and Wang, 2015a; Zhang et al., 2016; Yan et al., 2017), in fact, using fixed capital stock would be more accurate. Furthermore, many studies on administrative regions at the prefecture level and above use data for municipal districts rather than data for entire cities (Zhang et al., 2016; Yan et al., 2017). However, a close relationship exists between municipal districts and surrounding county-level administrative regions in terms of logistics and the flow of people and capital, among other aspects, and these factors are integrated and exert mutual effects (e.g., in the generation of “polarization” and “trickle-down” effects). Therefore, when considering the overall development of cities, researchers should use data for the whole city. For labor input indicators, Yu et al. (2006) selected the number of on-the-job employees1(1 On-the-job employees are the personnel who work in, and sign labor contracts with, the unit, and are paid wages, social insurance, and housing accumulation funds, as well as those personnel who have not worked because of studies, illness, injury, maternity leave, etc., but who are still paid by the unit.), Xie and Wang (2015a) selected the number of secondary and tertiary industry employees2(2 Secondary and teritary industry employees are those aged above 16 years, have the ability to work, and are engaged in the social labor of the secondary industry (mainly mining, manufacturing, and construction) and the tertiary industry (service industry) to obtain labor remuneration or business income.), and Zhang et al. (2016) selected the number of unit employees3(3 Unit employees are those who work in the unit on the last day at the end of the reporting period and receive wages or other forms of labor remuneration.). Based on whether a contribution is made to GDP, it can be seen that the scope of “staff and workers” is too narrow, and that the scope of “employees” is too wide. Also, GDP is composed of the output value of three major industries, and laborers in the primary industry can also contribute as “secondary and tertiary industry employees.” Therefore, it is more reasonable to consider “unit employees.” Furthermore, most researchers overlook the fact that “urban individual workers” contribute to GDP through taxation and should therefore be included in the labor force. It is more accurate to consider labor force as the combined number of regional unit employees and urban individual workers. In studying urbanization economic efficiency, Dai (2010a) includes the cost of labor (remuneration) and the cost of capital (depreciation of fixed assets) as input elements, which can better reflect the reality of the situation. According to existing research, input factors include three basic items: land, capital, and labor; cost factors may also be considered.
When selecting indicators for output factors, most studies choose GDP (Yu et al., 2006; Zhang et al., 2016), per-capita GDP, or the output value of the secondary and tertiary industries (Xie and Wang, 2015a), while others consider local fiscal revenue (Zhang et al., 2016). However, from a holistic perspective, the most representative indicator of a city’s economic output is still GDP. Urban and urbanization economic efficiency are also affected by random factors. Dai (2010a, 2010b) has provided relatively comprehensive analyses in this regard. He chose population structure, spatial agglomeration level, industrial structure, urban scale, local consumer market scale, infrastructure level, location conditions, and urban functions. However, in his study, the population structure is expressed as the ratio of non-agricultural employees in urban areas to the non-agricultural population in the municipal area; it overlaps with the labor input index. Therefore, it is more meaningful to choose a new indicator and adopt the population urbanization rate. Also, the proportion of built-up area to urban area cannot measure the level of urban spatial agglomeration, but the fragmentation index of urban landscape can. Besides, urban functions are greatly influenced by natural resource endowments and geographic constraints, which form objective development conditions that are difficult to change; therefore, it is unnecessary to consider it as an influencing factor.

3 Methodology

3.1 Methods

DEA (Data Envelopment Analysis) is the most widely used method in the study of urban and urbanization economic efficiency, which includes many models, such as the BCC (Zhang et al., 2016), CCR (Yang and Gao, 2014), super efficiency DEA (Dai, 2010b), Malmquist (Yu et al., 2006; Wang et al., 2016), and three-stage DEA (Zhuoma and Wu, 2014). After DEA, the second most widely used method is Stochastic Frontier Analysis (SFA), which also includes a variety of models (Coelli et al., 2005), such as the 1993 model (Xuan and Nakamura, 2013) and the 1995 model, both proposed by Battase and Coelli (Dai, 2010a); the bilateral model (Zhang, 2016), and the C-D production function (Li and Zheng, 2019). Furthermore, there is the comprehensive scoring method (Yan et al., 2017), the slack based model (SBM) (Xie and Wang, 2015b), the sequential slacks-based model (SSBM) (Xie and Wang, 2015a), and the hybrid directional distance function model (Chen et al., 2015). Through comprehensive considerations, a choice was made between the DEA and SFA methods. The SFA is a parametric method, while the DEA is nonparametric. A limitation of the nonparametric method is its inability to verify the goodness-of-fit of samples or the action direction of elements based on statistical test results. Compared to the DEA method, the SFA considers random factors’ influence on output. Additionally, the DEA attributes the actual output being lower than the frontier output to technical efficiency, neglecting the influence of random factors. Also, the SFA method is more suitable for the prediction of large sample data than the DEA method (Zhao et al., 2018). The SFA method can therefore be considered more appropriate than the DEA method. The SFA method is suitable for efficiency calculations with only one output factor, while the DEA method can be used for efficiency calculations with multiple outputs. Generally, a research method is selected according to the specific research context. As only one output index was used in this study, the SFA method was chosen, and Battese and Coelli’s 1996 SFA model was selected: it was developed to analyze the influencing factors of the technical efficiency of Indian farmers (Coelli and Battese, 1996), and is based on the Cobb-Douglas production function. The SFA model used in this study is as follows:
$\ln {{Y}_{it}}={{\beta }_{0}}+{{\beta }_{1}}\ln {{k}_{it}}+{{\beta }_{2}}\ln {{l}_{it}}+{{\beta }_{3}}\ln {{L}_{it}}+{{\beta }_{4}}\ln {{h}_{it}}+{{v}_{it}}-{{u}_{it}}$
where the subscripts i and t represent the i-th prefecture-level city and the year for the data, respectively; ln stands for the natural logarithm (Log base e); Y stands for the total output, which is the GDP based on the year 2000, where units are 10 000 yuan; k represents the size of the built-up area in square kilometers; l represents the capital stock based on the year 2000, in units of 10 000 yuan; L represents wage as a percentage of GDP; vit represents the random factor in production efficiency, which is a random variable independent of uit, and obeys N $\left[ 0,\sigma _{v}^{2} \right]$; uit is a non-negative random variable, which represents technical inefficiency, and obeys the truncated normal distribution $\left( {{m}_{it}},\sigma _{u}^{2} \right)$. mit can be defined as:
${{m}_{it}}={{\delta }_{0}}+{{\delta }_{1}}{{o}_{it}}+{{\delta }_{2}}{{p}_{it}}+{{\delta }_{3}}{{q}_{it}}+{{\delta }_{4}}{{r}_{it}}+{{\delta }_{5}}{{s}_{it}}+{{\delta }_{6}}{{w}_{it}}$
where o represents the percentage of local fiscal expenditure in GDP; p stands for urban landscape fragmentation index; q stands for population density (person/km2); r stands for population urbanization rate as a percentage; s stands for the total population, unit: 10 000; w stands for the deviation degree of industrial structure.
When coefficients β_ and δ_ for unknown parameters are to be estimated, variance parameters are in accordance with:
${{\sigma }^{2}}=\sigma _{v}^{2}+\sigma _{u}^{2}$
$\gamma =\sigma _{u}^{2}/{{\sigma }^{2}}\left( 0\le \gamma \le 1 \right)$
γ close to 0 indicates that the difference between actual output and potential maximum output is mainly due to uncontrollable factors; γ close to 1 indicates that the difference is mainly due to uit. Using the computer program FRONTIER 4.1 (Coelli, 1992, 1994), the parameters were estimated by the maximum likelihood method. The production efficiency function is:
$T{{E}_{it}}=\text{exp }(-{{u}_{it}})$
This means that the production efficiency is between 0 and 1, and therefore has a negative correlation with technical inefficiency factors.

3.2 Index setting

3.2.1 Input factors

The input indicators included four aspects: land, capital, labor, and labor cost. We will address each of these four aspects in sequence.
Land input adopts the built-up area of each city: Based on this, we can determine whether we should continue to accelerate or control the development of land urbanization.
Capital investment considers the fixed capital stock, calculated according to the base period (the year 2000), applying the perpetual inventory method, with the formula:
${{K}_{it}}={{K}_{it-1}}\left( 1-\delta \right)+{{I}_{it}}/{{p}_{it}}$
where Kit is the fixed capital stock of a city in year t (the base year is 2000), δ is the depreciation rate, taking 6% (Hall and Jones, 1998; Young, 2000), Iit is the fixed capital investment amount of a city in year t, pit is the fixed capital investment price index of a city based on values in 2000. The calculation of the base year capital stock K2000 was obtained by dividing the fixed capital investment amount of the base year by 10% as the initial capital stock (Young, 2000).
Many related studies have selected the total fixed capital investment for the selection of capital input index. However, it is not only the new capital invested in that year but also the capital stock accumulated over past years that influences the output of urban GDP.
The labor force was calculated as the combined number of unit employees and urban individual workers, represented in units of 10 000. Many studies only consider the number of unit employees, but urban “individual” workers also contribute to the output of GDP, which should be considered.
Labor cost was calculated as the total wages of on-the-job employees as a percentage of GDP. It is almost impossible to accurately calculate all workers’ salaries, especially the wages of individual businesses. However, the percentage of wages of on-the-job employees in GDP is enough to show the trend and direction of the relationship between wages and urban economic efficiency, indicating likely future directions of labor wage adjustment.

3.2.2 Output factor

Urbanization is the engine of China’s economic development, and the key indicator of economic growth is improvement in GDP. As a result, it is the output factor index selected for each city. The 2015 GDP values were inflation-adjusted to prices that can be compared with 2000 levels by using the GDP deflator for each city, eliminating the error between the current price and the actual price.

3.2.3 Influencing factors

For the influencing factors of technical inefficiency, these considerations are mainly combined with the existing relevant research to select the indicators that have a great probability of impact on urban economic efficiency. On the one hand, factors should improve the accuracy of predictions of urban and urbanization economic efficiency. On the other hand, they should help provide a decision-making basis for the formulation of relevant policies. Accordingly, the following six indexes were selected:
Local fiscal expenditure as a percentage of GDP. Local fiscal expenditure reflects the government’s investment in urban infrastructure and other public welfare and symbolizes the level of social development. Due to significant differences in the economic development levels of different cities, it is more instructive to use the data of local fiscal expenditure as a percentage of GDP.
Urban landscape fragmentation index, as calculated by:
$FN=MPS\cdot \left( NF-1 \right)/NC$
where FN is the fragmentation index of the urban landscape, MPS is the average patch area of the whole landscape, NF is the number of urban landscape patches, NC is the ratio of the total area of the study area to the minimum patch area. FN can be between 0 and 1, where 0 means the landscape is not damaged at all and 1 means the landscape has been completely damaged (Wang et al., 1996). The degree of urban landscape fragmentation can reflect the impact of land urbanization on spatial connectivity. Selecting this index as an impact factor is a way that seeks to identify whether urban landscape fragmentation will affect urban economic efficiency by affecting urban traffic efficiency.
Population density (person / km2): Through this index, we can determine whether the urban population density helps to improve urban economic efficiency.
Population urbanization rate: urban permanent population / total population × 100%. Through this index, we can make clear whether the increase of population urbanization contributes to the improvement of urban economic efficiency.
The total population, unit measurement of 10,000 people. Through this index, we can help make clear the relationship between urban scale and urban economic efficiency.
Industrial structure: the deviation degree is used as the index to measure the efficiency of industrial structure, using the formula:
$IS=\mathop{\sum }^{}\left| L \right.-\left. C \right|$
where IS is the deviation degree of industrial structure; L is the proportion of labor force for the primary, secondary, or tertiary industry; and C is the proportion of output value for the primary, secondary, or tertiary industry (Duan, 2016). The larger the deviation index of industrial structure, the lower the efficiency of industrial structure. Through this index, we can help clarify the relationship between industrial structure and urban economic efficiency to guide the direction of industrial structure adjustment in the process of urbanization.

3.3 Data sources

The national land cover data sets for 2000 and 2015, used to calculate the built-up area and urban landscape fragmentation index for each city, were based on 30m resolution data derived from China’s environmental satellites (HJ-1A/B) and US Landsat OLI. Ecosystem classification data came from the China Ecosystem Assessment and Ecological Security Database (http://www.ecosystem.csdb.cn/ecogj/index.jsp). Other data, including data used for calculations, are from the statistical yearbooks for provinces and cities in China and the China Urban Statistical Yearbook.

4 Results and analysis

4.1 Urban economic efficiency in 2000 and 2015

4.1.1 Factors influencing the urban economic efficiency

Maximum likelihood estimation was carried out using Frontier 4.1 software, and the final results are presented in Table 1, which shows that the model passed the significance test at 0.01 significant level, indicating that the model is applicable. As seen in the table, γ=0.883, and is significant at 0.01 level, which means that the variation in the composite error term is mainly caused by technical inefficiency (u). Through the analysis of the model’s frontier production function, we can see that the size of the built-up area has no significant impact on the urban GDP production frontier. The other three input factors, however, do show a significant effect on the urban GDP production frontier at the level of 0.01. Among these three factors, the output elasticity of capital stock and employment is 0.065 and 0.085 respectively, showing that GDP will increase by 0.065 or 0.085 units for every 1 unit increase in urban capital stock or the number of employees, respectively. This shows that the capital stock and the labor quantity of Chinese cities have a scale effect, which can effectively improve urban GDP through increasing capital and labor inputs. The output elasticity of the proportion of wages to GDP is -0.09; that is to say, for every 1 unit increase in the proportion of wages to GDP, GDP will decrease by 0.09 units. This means that the higher the proportion of wages to GDP, the lower the GDP output.
Table 1 Parameter estimation results of SFA method for economic efficiency of cities at prefecture level and above in China in 2000 and 2015
Variables Parameters Coefficients Standard error t value
Stochastic Frontier
Constant term ${{\beta }_{0}}$ 16.858 23.518 0.717
Built-up area ${{\beta }_{1}}$ 0.050 0.034 1.499
Capital stock ${{\beta }_{2}}$ 0.065 0.015 4.329***
Employment ${{\beta }_{3}}$ 0.085 0.031 2.708***
Proportion of wages to GDP ${{\beta }_{4}}$ ‒0.090 0.028 ‒3.220***
Inefficiency Model
Constant term ${{\delta }_{0}}$ 10.450 23.512 0.444
Proportion of local fiscal expenditure in GDP ${{\delta }_{1}}$ 0.225 0.020 11.081***
Fragmentation index of urban landscape ${{\delta }_{2}}$ 0.009 0.027 0.338
Population density ${{\delta }_{3}}$ ‒0.031 0.012 ‒2.626***
Population urbanization rate ${{\delta }_{4}}$ ‒0.676 0.062 ‒10.996***
Total population ${{\delta }_{5}}$ ‒0.851 0.042 ‒20.046***
Industrial structure deviation ${{\delta }_{6}}$ 0.115 0.027 4.259***
Variance Parameters
${{\sigma }^{2}}$ 0.097 0.006 16.596***
$\gamma $ 0.883 0.287 3.072***
Log-likelihood Function ‒130.010
LR test of the one-sided error 431.918***
With number of restrictions 8

Note: ***, **, and * mean that the variables passed the significance tests of 0.01, 0.05 and 0.1 levels respectively.

Afterward, the technical inefficiency function of the model was analyzed. It can be seen that among the six influencing factors for technical inefficiency, the urban landscape fragmentation index has no significant impact. However, the other five factors show a significant impact on the technical inefficiency of GDP at the 0.01 significant level. The ratio of local fiscal expenditure to GDP, and the deviation degree of industrial structure are two factors with negative effects on urban GDP output: the higher the ratio of local fiscal expenditure to GDP and the higher the deviation degree of industrial structure, the more significant the negative effects on urban GDP output. The indicators for population density, population urbanization rate, and total population have a positive effect on urban GDP output: the greater the urban population density, the higher the population urbanization rate, and the bigger the total population, the more positive the impact on urban GDP output.

4.1.2 Distribution and change characteristics of urban economic efficiency

The economic efficiency in 2000 and 2015 for the 258 cities at prefecture level and above included in this study were calculated using Frontier 4.1 software. Table 2 shows the top and bottom five cities rated for urban economic efficiency in 2000 and 2015, and the top and bottom five cities for increased/decreased urban economic efficiency over the 15-year period.
Table 2 Economic efficiency ranking of cities at prefecture level and above in China in 2000 and 2015
Ranking 2000 2015 Increment from 2000 to 2015
City Economic efficiency City Economic efficiency City Economic efficiency
1 Shanghai 0.28956 Shanghai 0.620551 Shanghai 0.330991
2 Guangzhou 0.195545 Beijing 0.321885 Beijing 0.136925
3 Beijing 0.184961 Guangzhou 0.161867 Yulin (Shaanxi) 0.01878
4 Shenzhen 0.142389 Shenzhen 0.150565 Hefei 0.018222
5 Tianjin 0.133857 Tianjin 0.14575 Wuhan 0.015652
…… …… …… …… …… …… ……
254 Tongchuan 0.006861 Qitaihe 0.006341 Quanzhou -0.018191
255 Wuhai 0.006128 Tongchuan 0.006316 Daqing -0.018612
256 Jinchang 0.005781 Wuhai 0.006077 Chongqing -0.021199
257 Sanya 0.004753 Jiayuguan 0.005137 Anshan -0.021386
258 Jiayuguan 0.003206 Jinchang 0.005013 Guangzhou -0.033678
It can be seen that the five cities with the highest economic efficiency were relatively stable in 2000 and 2015. The highest values for 2000 were for Shanghai, Guangzhou, Beijing, Shenzhen, and Tianjin. In 2015, the list was very similar: Shanghai, Beijing, Guangzhou, Shenzhen, and Tianjin. In the 15 years between 2000 and 2015, the five cities with the most significant improvements in urban economic efficiency were Shanghai, Beijing, Yulin (Shaanxi), Hefei, and Wuhan. In 2000, the five cities with the lowest urban economic efficiency scores were, from the lowest, Jiayuguan, Sanya, Jinchang, Wuhai, and Tongchuan; for 2015 the same list comprised Jinchang, Jiayuguan, Wuhai, Tongchuan, and Qitaihe. Within those 15 years, Guangzhou, Anshan, Chongqing, Daqing, and Quanzhou had the most significant decreases in urban economic efficiency.
Statistical analysis shows that the average economic efficiency of cities at prefecture level and above in China was 0.036333 in 2000 and 0.037992 in 2015, with an increase of 0.001659 over the 15 years in between. This represents 4.56% of the average urban economic efficiency in 2000, with an average annual increase of about 0.3%. As the economic efficiency levels of Beijing, Shanghai, and Guangzhou are much higher than those of other cities, these three cities were excluded as outliers, and the economic efficiency data of the other 255 cities in both 2000 and 2015 were analyzed. It was found that the higher the economic efficiency of cities, the smaller the number of cities. Cities with economic efficiency lower than 0.033 accounted for 68.24% and 66.27% of the sample cities in 2000 and 2015, respectively. However, cities with an economic efficiency higher than 0.092 only accounted for 6.27% (for 2000) and 4.31% (for 2015) of the samples. From 2000 to 2015, the number of cities with economic efficiency lower than 0.033 and higher than 0.092 decreased; the number of cities with economic efficiency between the values 0.033 and 0.092 increased from 65 to 75. This indicates that the gaps in economic efficiency between cities in China have decreased (Figures 1a, 1b, and 1c). Based on the distribution analysis of changes from 2000 to 2015, Shanghai and Beijing were excluded from the data as outliers: their economic efficiency had improved much more than other cities over the period of 15 years. The remaining 256 cities were analyzed. We found that the number of cities with an increase in economic efficiency is larger than the number of cities with a decrease. Out of these cities, 140 exhibited improved economic efficiency, accounting for 54.69% of the total number of cities. The other 116 cities with a reduction in economic efficiency accounted for 45.31% of the total (Figures 1d and 1e).
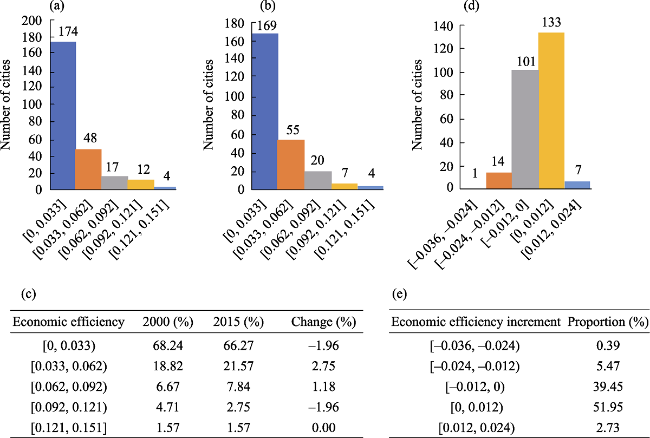
Figure 1 Statistical distribution of economic efficiency and its change of cities at prefecture level and above in China in 2000 and 2015: (a) Urban economic efficiency in 2000, (b) Urban economic efficiency in 2015, (c) Frequency distribution and change of urban economic efficiency, (d) Urban economic efficiency increment from 2000 to 2015, and (e) Frequency distribution of urban economic efficiency increment
ArcGIS was used for a spatial analysis of the cities’ urban economic efficiency. It was found that the spatial distribution patterns of urban economic efficiency were similar in 2000 and 2015. Cities with high economic efficiency (> 0.06) were found to be distributed mainly in the eastern region of China, and had apparent characteristics of centralized and contiguous distribution. These cities’ locations can be divided into six high economic efficiency regions, the most significant of which are the Yangtze River Delta, the Pearl River Delta, and Beijing-Tianjin-Hebei, followed by the Shandong Peninsula and the west coast of the Taiwan Straits area (coastal cities are more efficient), and finally the central and southern Liaoning region. The number of cities with high economic efficiency in the central and western regions is significantly lower than that in the eastern region, and their distribution is relatively scattered. Harbin, Daqing, and Changchun in the northeast, and Chengdu and Chongqing in the southwest, are respectively grouped together. The other cities with high economic efficiency are distributed in a more scattered pattern. This includes Zhengzhou, Wuhan, and Changsha in the central region, and Xi’an and Kunming (where economic efficiency dropped from above 0.06 in 2000 to below 0.06 in 2015) in the western region (Figures 2a and 2b). Based on the spatial analysis of changes in economic efficiency of cities between 2000 and 2015, it was found that the cities with significantly reduced economic efficiency are mainly distributed in Heilongjiang, Jilin, and Liaoning provinces; Liaodong Peninsula, Shandong Peninsula, the west coast of the Taiwan Straits, and the Pearl River Delta; and some cities in the south of Hebei province, northeast Hubei province, and eastern portion of Sichuan province (Figure 2c).
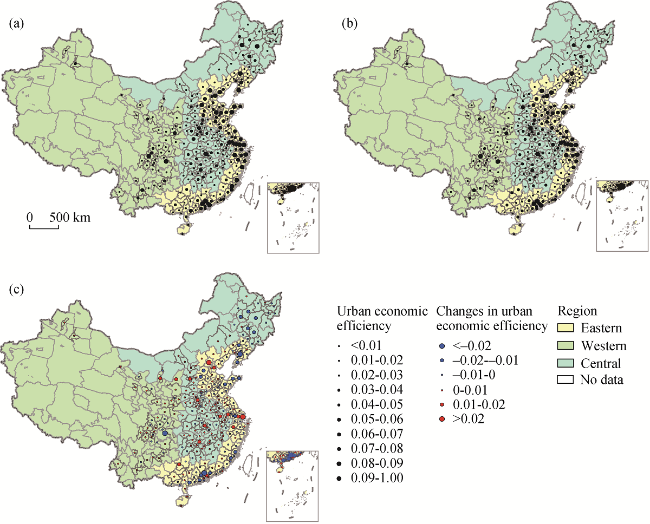
Figure 2 Spatial distribution of economic efficiency and its change of cities at prefecture level and above in China: (a) Urban economic efficiency in 2000, (b) Urban economic efficiency in 2015, and (c) Changes in urban economic efficiency from 2000 to 2015

4.2 Urbanization economic efficiency in 2000-2015

4.2.1 Factors influencing the urbanization economic efficiency

Table 3 shows the estimation results from Frontier 4.1: the model passed the significance test at the 0.01 level, indicating that the model is applicable. As γ=0.986, and is significant at the 0.01 level, the variation in the synthesis error is almost entirely due to technical inefficiency (u). Analysis of the frontier production function of the model shows that, among the four input factors, only new capital input and new jobs have a significant effect on the production frontier of urban GDP. These two factors passed the significance test at 0.01 and 0.05 levels and with output elasticities of 0.312 and 0.16, respectively. However, the other two factors (new built-up area and the increase in wage for GDP) had no significant impact on the urban GDP production frontier.
Table 3 Parameter estimation results of SFA method for urbanization economic efficiency of cities at prefecture level and above in China from 2000 to 2015
Variables Parameters Coefficients Standard error t value
Stochastic Frontier
Constant term ${{\delta }_{0}}$ 8.344 0.610 13.679***
New built-up area ${{\delta }_{1}}$ 0.052 0.049 1.060
New Capital investment ${{\delta }_{2}}$ 0.312 0.047 6.673***
New employment ${{\delta }_{3}}$ 0.160 0.066 2.429**
The increment of wage share in GDP ${{\delta }_{4}}$ ‒0.067 0.041 ‒1.651
Inefficiency Model
Constant term ${{\delta }_{0}}$ 3.244 1.190 2.726***
The increment of the proportion of local fiscal expenditure in GDP ${{\delta }_{1}}$ ‒2.594 0.895 ‒2.900***
Urban landscape fragmentation index increment ${{\delta }_{2}}$ 3.414 1.240 2.752***
Population density increment ${{\delta }_{3}}$ ‒1.937 0.673 ‒2.876***
Population urbanization rate increment ${{\delta }_{4}}$ ‒2.038 0.852 ‒2.393**
Total population growth ${{\delta }_{5}}$ 0.491 0.807 0.609
Industrial structure deviation degree increment ${{\delta }_{6}}$ 1.602 0.739 2.167**
Variance Parameters
${{\sigma }^{2}}$ 4.167 0.299 13.955***
$\gamma $ 0.986 0.002 558.684***
Log-likelihood Function ‒166.424
LR test of the one-sided error 382.208***
With number of restrictions 8

Note: ***, **, and * mean that the variables passed the significance tests of 0.01, 0.05 and 0.1 levels respectively.

An analysis of the technical inefficiency function of the model found that three influencing factors showed a significant positive effect on urban GDP output. These factors were the increased proportion of local fiscal expenditure in GDP, the increased population density, and the increased population urbanization rate. The increase in population urbanization rate passed the significance test at the 0.05 level. And, the other two influencing factors passed the significance test at the 0.01 level. Urban landscape fragmentation index increment and industrial structure deviation degree increment showed a significant negative impact on urban GDP output, passing the significance test at the 0.01 and 0.05 levels, respectively. Total population increase had no significant impact on urban GDP output (Table 3).

4.2.2 Distribution characteristics of urbanization economic efficiency

Using Frontier 4.1, calculations were obtained for urbanization economic efficiency for 258 Chinese cities at prefecture level and above from 2000 to 2015. The average urbanization economic efficiency was 0.756224. Table 4 shows the top and bottom six cities for the urbanization economic efficiency from 2000 to 2015: Shanghai had the highest score, followed by Beijing, Shenzhen, Zhanjiang, Dongguan, and Guangzhou. Anshan had the lowest urbanization economic efficiency, followed by Daqing and Weihai (Table 4).
Table 4 Urbanization economic efficiency ranking of cities at prefecture level and above in China from 2000 to 2015
Ranking Top 6 Last 6
City Economic efficiency City Economic efficiency
1 Shanghai 1.000000 Anshan 0.000001
2 Beijing 0.962131 Daqing 0.015854
3 Shenzhen 0.948218 Weihai 0.2638
4 Zhanjiang 0.942075 Jiangmen 0.323413
5 Dongguan 0.916837 Baoding 0.332751
6 Guangzhou 0.908482 Jilin 0.411311
Since the urbanization economic efficiency for Anshan and Daqing was significantly lower than for other cities, these two cities were excluded as outliers. The distribution analysis of the urbanization economic efficiency data for the remaining 256 cities over the 15-year period shows that scores were mainly concentrated at values of 0.7-0.9. The number of cities in this range is 194, which accounts for 75.19% of the total sample size; there are 56 cities with an urbanization economic efficiency value lower than 0.7, which account for 21.71% of the total. Only 22 cities showed an urbanization economic efficiency value lower than 0.6, accounting for 8.53% of the total sample. There were only eight cities with an urbanization economic efficiency value higher than 0.9, accounting for 3.1% of the total sample size (Figures 3a and 3b).
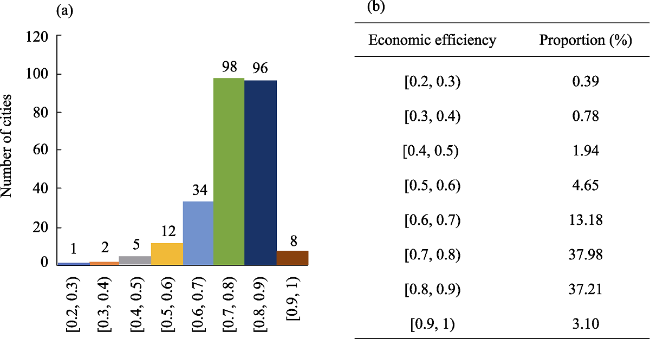
Figure 3 Statistical distribution of urbanization economic efficiency of cities at prefecture level and above in China from 2000 to 2015: (a) Urbanization economic efficiency from 2000 to 2015, (b) Frequency distribution of urbanization economic efficiency
The ArcGIS spatial analysis of the urbanization economic efficiency of cities from 2000 to 2015 shows that the urbanization economic efficiency of most cities in the eastern region is relatively low, with some exceptions: cities in Beijing-Tianjin-Hebei, the Yangtze River Delta, and the Pearl River Delta are efficient and densely distributed. In the central region, the urbanization economic efficiency is lower than 0.6 in the south of Heilongjiang province and the north of Jilin province, but relatively high in most other areas. There are no cities with urbanization economic efficiency higher than 0.9 or lower than 0.6 in the western region; instead, most cities have an urbanization economic efficiency between 0.7-0.9, and only three cities have a value lower than 0.7. Cities that possess an urbanization economic efficiency value lower than 0.7 or 0.6 are mainly distributed across Heilongjiang, Jilin, and Liaoning provinces in Northeastern China; parts of southern Hebei province, the Shandong Peninsula, west coast of the Taiwan Straits; and parts of the Pearl River Delta. (Figure 4)
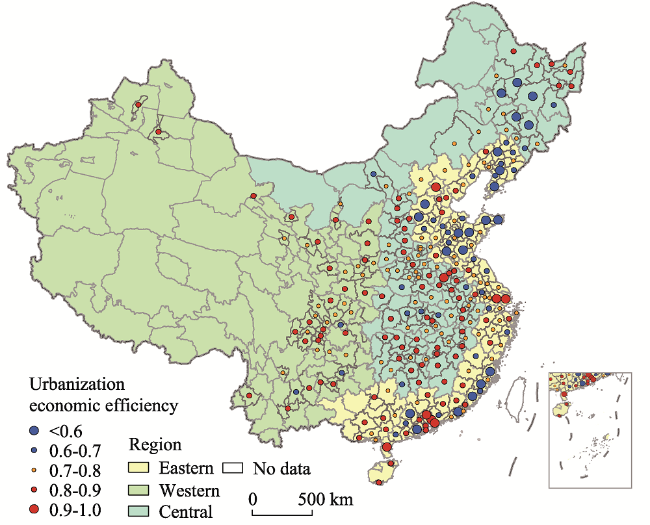
Figure 4 Spatial distribution of urbanization economic efficiency of cities at prefecture level and above in China from 2000 to 2015

5 Discussion

5.1 Factors affecting urban and urbanization economic efficiency

5.1.1 Built-up area

The results reveal that the size of the urban built-up area had no significant impact on urban economic output, and that the increase in the built-up area did not significantly increase economic output during urbanization. Therefore, increasing urban economic output by expanding urban built-up areas is neither effective nor desirable, particularly given its profound impacts on the natural environment. This is consistent with the findings of Chen et al. (2016). Although land finance promotes urban economic growth (Zhang et al., 2008; Lin, 2014), it is unsustainable due to its myriad environmental impacts (Jiang et al., 2009; Bai et al., 2012). The expansion of urban land in China presents a typical growth model of non-intensive use (Li et al., 2014; Zhang et al., 2016), leading to severe ecological and environmental problems such as biodiversity and ecosystem services loss and pollution (Cao et al., 2016; Chen, 2007; Wu et al., 2013; Long et al., 2014; Song and Deng, 2015; Zhang and Xu, 2016). Therefore, land expansion is no longer a reasonable and feasible urban economic development strategy (He et al., 2013).

5.1.2 Capital and labor

The results show that the larger the capital stock and the higher the employment number index, the larger the urban economic output; and an increase in capital input and labor force is effective for improving urban economic output, which is consistent with existing research (Cheng and Shi, 2008; Zhao, 2008; Deng, 2010; Shi, 2014; Liu and Xue, 2021). China’s labor-intensive industries are dominated by the manufacturing industry, which adds low value (Hu, 2006) and was severely impacted by the 2008 financial crisis (Liu R L, 2009). Additionally, China’s economy has entered a “new normal,” and its economic growth has slowed down (Jin et al., 2015; Chen and Zhu, 2016). China is also facing the risk of entering a “middle-income trap” (Mao, 2018; Wu and He, 2018). In response to this series of problems and challenges, industrial restructuring is urgently needed. Labor-intensive industries have economic and social significance and need long-term and dynamic development (Gao, 2008; Liu J S, 2009a, 2009b; Sun and Chen, 2014). Therefore, China must coordinate the development of labor-intensive industries and capital-intensive industries (Deng and Wang, 2010). Labor-intensive industries in China need to move toward higher technology content and higher value-added contributions in the production of goods and services (Su, 2013; Xue and Su, 2014). Industrial transfers should be managed correspondingly (Yin and Yin, 2013), especially accounting for potential shocks to the labor market (i.e., sudden and large-scale shocks to the labor market).

5.1.3 Wage share in GDP

This study also found that the higher the proportion of wages to GDP, the lower the urban economic output. The proportion of wages to GDP is an important indicator for measuring the initial distribution of national income, and is also a key indicator of social equity (Li, 2006; Ye, 2010; Gong and Qin, 2011; Zhang and Zhou, 2012). According to existing research, China’s wage share to GDP has been low for a long period of time, and is still declining (Xiao, 2010; Xu, 2011; Zhang et al., 2012; Guo and Di, 2014; Zhang, 2014; Yao, 2016), since wage growth cannot keep up with GDP growth (Hu, 2010; Wang and Lv, 2015). This has become a prominent problem (Wu and Pan, 2013), as the unbalanced distribution of national income may bring social and economic instabilities (Li, 2006; Ye, 2010; Gong and Qin, 2011; Zhang and Zhou, 2012; Zhang et al., 2012; Guo and Di, 2014; Zhang, 2014). But this study shows that the change of the proportion of wages to GDP has no significant impact on urbanization economic output. Therefore, appropriate adjustment of the proportion of wages to GDP will not significantly affect the urbanization economic output, moreover, it is an indispensable and important issue for public policy.

5.1.4 Population

This study shows that population size, population density, and population urbanization rate have a significant positive effect on urban economic output, and population density and population urbanization rate also have a significant positive effect on economic output during urbanization. To some extent, population size, population density, and population urbanization rate all affect urban economic output by affecting the size of the urban labor force (Peng and Tan, 2007). Sufficient labor resources can contribute to capital accumulation (Liu and Zhang, 2016), which increases urban capital input and capital stock, thus increasing urban economic output. Compact cities are more conducive to resource conservation (Su, 2011) and economic efficiency. With proper urban planning and design, compact cities have the potential to become more sustainable (Chen et al., 2008; Seema, 2010), livable (Raman, 2010), and energy-saving (Hui, 2001). Finally, the finding that population urbanization promotes economic growth is consistent with those of earlier studies in China (Wang, 2003; Shi and Wang, 2012; Liu et al., 2016).

5.1.5 Proportion of local fiscal expenditure to GDP

The results show that the proportion of local fiscal expenditure to GDP is not the key to improving urban economic output. This is because the proportion of local fiscal expenditure to GDP can not represent the amount of local fiscal expenditure. Cities with a high proportion of local fiscal expenditure to GDP tend to have a lower local economic development level, and even a fiscal deficit (Zhang, 1997). Most studies show that government expenditure is important for promoting economic development (Han, 2008; Gao and Ju, 2010; Zhang, 2016), consistent with our study, although there are other studies that have put forward opposing conclusions (Yang and Ao, 2014; Sun, 2019).

5.1.6 Industrial structure deviation

The deviation of industrial structure has significant negative effects on urban and urbanization economic efficiency; this is consistent with the findings of Chenery et al. (1970): the higher the deviation degree of industrial structure, the lower the output produced. This is also consistent with other empirical studies in China, which show that the deviation of industrial structure harms the economy (Jin and Cui, 2010; Wang et al., 2015; Zheng et al., 2018).

5.1.7 Urban landscape fragmentation

The increase in urban landscape fragmentation has a significant negative effect on urbanization economic output. Most of the existing studies focus on the impact of economic development level on urban landscape fragmentation (Su et al., 2007; Qiu et al., 2012; Wang et al., 2018), and are less concerned with the impact of urban landscape fragmentation on urban economic development. Local governments in China have relied on land sales to support public finance, resulting in excessive land urbanization (Li et al., 2014; Zhang et al., 2016), with built-up areas sprawling outward causing high levels of landscape fragmentation (Qiu et al., 2012; Wang et al., 2018). Urban landscape fragmentation has led to a significant increase in urban transportation costs.

5.2 Spatial distribution characteristics of urban and urbanization economic efficiency

5.2.1 Spatial distribution of urban economic efficiency

Average urban economic efficiency is low, and regional differences are significant. Cities with high economic efficiency are mainly distributed in the eastern region. It can be seen that China’s more economically efficient cities are typically located in large and medium-sized urban agglomerations and their core areas (Zeng and Chen, 2013). This confirms the importance of urban agglomerations as an engine of economic development (Anderson and Ge, 2004). From 2000 to 2015, China’s urban economic efficiency showed an overall upward trend, but some cities declined significantly. Future research should analyze the specific reasons and formulate policies and guidelines for declining economic efficiency in these cities. It is worth noting that the decline in economic efficiency in some cities has historic inevitability due to objective factors and secular processes (Zhao, 2015); therefore, we should not insist on reversing this trend but instead on the formulation of policies and guidelines that are suitable for the sustainable development. Our findings are largely consistent with those of Li et al. (2005), Fang et al. (2012), and Jin et al. (2018).

5.2.2 Spatial distribution of urbanization economic efficiency

From 2000 to 2015, the overall urbanization economic efficiency in China was relatively high. The number of cities with urbanization economic efficiency between 0.7 and 0.9 accounted for 75.19% (194) of the sample cities. Cities with urbanization economic efficiency less than 0.7 or even 0.6 were mainly distributed in the southeastern coastal areas and northeastern China. Future studies could shed additional light on the specific mechanisms for this distribution and formulate regionally-specific policies.

5.2.3 Spatial comparative analysis of urban economic efficiency and urbanization economic efficiency

By comparing and analyzing the spatial distribution of urban economic efficiency and its change with the spatial distribution of urbanization economic efficiency, it is found that most of the cities in the eastern coastal area have higher economic efficiency but lower urbanization economic efficiency. This shows that the development potential of these cities is insufficient. It is also found that some cities in the Yangtze River Delta, Pearl River Delta and Beijing-Tianjin-Hebei Urban Agglomeration - like Shanghai, Shenzhen and Beijing - have high urban economic efficiency, growth rate, and urbanization economic efficiency; this shows that after achieving high urban economic efficiency, cities can still maintain high urbanization economic efficiency. We also found that most low economic efficiency cities in China generally have relatively high urbanization economic efficiency, which shows that the overall development momentum of urbanization in China remains positive, with large potential going into the future.
In addition, it was found that the distribution of changes in urban economic efficiency is similar to the distribution of urbanization economic efficiency. However, urban economic efficiency and urbanization economic efficiency are two completely different concepts. The reduced urban economy efficiency does not necessarily mean that urbanization economic efficiency is low. We must pay special attention to cities with declining economic efficiency and low urbanization economic efficiency, such as those cities in northeastern China, which have undergone major deindustrialization and even population loss in recent decades.

6 Conclusions

This study optimizes the index system of the Stochastic Frontier Model to calculate the urban economic efficiency and urbanization economic efficiency of cities across China. Our findings reveal the impact of relevant factors on these outcomes, and makes a comparative analysis of the two indicators. This study can help in the understanding and management of urban development challenges. The main conclusions include:
(1) Urban land expansion is not an effective way to improve urban economic efficiency. Continuing large-scale and disorderly urban land development will only lead to a waste of natural resources and environmental degradation. People should strictly control urban land expansion and change from incremental expansion to stock optimization.
(2) Increasing investment in fixed assets and employment rate are effective means to improve urban economic efficiency.
(3) Appropriately advancing the proportion of wages in GDP is necessary and will not significantly affect the urbanization economic efficiency.
(4) The amount and increment of local government expenditure is more important to urban and urbanization economic efficiency compared to the expenditure’s proportion relative to GDP. Increasing the proportion of government expenditure in GDP while improving GDP can be a practical way to promote urban economic efficiency.
(5) The increase of urban landscape fragmentation has a significant negative impact on urbanization’s economic efficiency. People should pay attention to the integrity of urban landscape patches in the process of urbanization.
(6) It is better to focus on large cities’ planning instead of simply controlling population scale. People should pay attention to the planning and design and further improve the rate of population urbanization.
(7) Adjusting industrial structure to reduce the degree of deviation is significantly beneficial to improving urban economic efficiency.

Supplementary material: Table 1

Economic efficiency and urbanization economic efficiency of prefecture level and above cities in China from 2000 to 2015
Ranking City Urban economic efficiency in 2000 City Urban economic efficiency in 2015 City Urban
economic
efficiency
increment
City Urbanization economic efficiency
1 Shanghai 0.28956 Shanghai 0.62055 Shanghai 0.33099 Shanghai 1
2 Guangzhou 0.19555 Beijing 0.32189 Beijing 0.13692 Beijing 0.96213
3 Beijing 0.18496 Guangzhou 0.16187 Yulin (Shaan) 0.01878 Shenzhen 0.94822
4 Shenzhen 0.14239 Shenzhen 0.15057 Hefei 0.01822 Zhanjiang 0.94208
5 Tianjin 0.13386 Tianjin 0.14575 Wuhan 0.01565 Dongguan 0.91684
6 Suzhou (Su) 0.13327 Suzhou (Su) 0.14377 Taiyuan 0.01485 Guangzhou 0.90848
7 Chongqing 0.13152 Hangzhou 0.12924 Nanjing 0.01433 Suzhou (Su) 0.90758
8 Hangzhou 0.11597 Wuhan 0.12005 Zhengzhou 0.01386 Bozhou 0.9028
9 Chengdu 0.11341 Chengdu 0.11809 Hangzhou 0.01327 Changsha 0.89514
10 Wuxi 0.10964 Chongqing 0.11032 Tianjin 0.01189 Hangzhou 0.89211
11 Wuhan 0.1044 Nanjing 0.10916 Liuzhou 0.01156 Zhangjiajie 0.88837
12 Ningbo 0.10073 Ningbo 0.10858 Yinchuan 0.01137 Taiyuan 0.88767
13 Qingdao 0.0998 Qingdao 0.09673 Changsha 0.01086 Karamay 0.88755
14 Dalian 0.09748 Wuxi 0.09671 Suzhou (Su) 0.0105 Hegang 0.88505
15 Quanzhou 0.09703 Tangshan 0.08674 Dongguan 0.01006 Wuhan 0.88286
16 Shenyang 0.09628 Dalian 0.08667 Qujing 0.00922 Ningbo 0.88278
17 Foshan 0.09493 Zhengzhou 0.08484 Nanning 0.00897 Yulin (Shaan) 0.88268
18 Nanjing 0.09483 Shenyang 0.08303 Shuozhou 0.00828 Nanjing 0.88162
19 Fuzhou 0.09364 Foshan 0.08296 Shenzhen 0.00818 Fuyang 0.87767
20 Harbin 0.08776 Quanzhou 0.07883 Zhongshan 0.00801 Anshun 0.87663
21 Shijiazhuang 0.08655 Jinan 0.07738 Yan’an 0.008 Meizhou 0.87602
22 Daqing 0.08639 Fuzhou 0.07639 Ningbo 0.00785 Jiayuguan 0.87524
23 Jinan 0.08492 Harbin 0.07559 Heze 0.0073 Yichun (Gan) 0.87384
24 Tangshan 0.08108 Wenzhou 0.07408 Suqian 0.00729 Zhengzhou 0.87074
25 Yantai 0.0809 Changsha 0.07387 Zhanjiang 0.00724 Yuxi 0.87018
26 Wenzhou 0.08081 Xi’an 0.07183 Urumqi 0.00688 Tianjin 0.86864
27 Changchun 0.07727 Shijiazhuang 0.07169 Wuhu 0.00677 Heihe 0.86862
28 Shaoxing 0.07587 Nantong 0.07135 Xinzhou 0.0067 Baoshan 0.86591
29 Zhengzhou 0.07099 Yantai 0.06942 Changzhi 0.00665 Chongqing 0.86565
30 Nantong 0.06982 Daqing 0.06778 Liupanshui 0.00662 Yichun (Hei) 0.86144
31 Xi’an 0.06855 Shaoxing 0.06704 Karamay 0.00645 Shuozhou 0.86128
32 Taizhou (Zhe) 0.06839 Xuzhou 0.06498 Jincheng 0.00636 Yangquan 0.86062
33 Weifang 0.06829 Changchun 0.06326 Yichun (Gan) 0.00628 Qitaihe 0.85964
34 Baoding 0.06507 Dongguan 0.06319 Zhoukou 0.00624 Guigang 0.85947
35 Zibo 0.0632 Changzhou 0.06022 Jinzhong 0.0058 Liuzhou 0.85947
36 Changsha 0.063 Taizhou (Zhe) 0.05896 Fuyang 0.0058 Yingtan 0.85716
37 Changzhou 0.06137 Weifang 0.05613 Tangshan 0.00566 Tangshan 0.85538
Ranking City Urban economic efficiency in 2000 City Urban economic efficiency in 2015 City Urban
economic
efficiency
increment
City Urbanization economic efficiency
38 Kunming 0.06134 Taiyuan 0.05386 Yichang 0.00558 Qujing 0.85437
39 Xuzhou 0.06119 Zibo 0.05382 Haikou 0.00554 Tianshui 0.85173
40 Jiangmen 0.05993 Kunming 0.05304 Xinyu 0.00506 Zigong 0.8506
41 Jinhua 0.05662 Hefei 0.05296 Yuncheng 0.00499 Yinchuan 0.84746
42 Anshan 0.05604 Baoding 0.05249 Ji’an 0.00478 Ankang 0.84739
43 Maoming 0.05541 Jiaxing 0.05217 Huainan 0.00469 Sanya 0.84676
44 Jining 0.05493 Handan 0.05151 Chengdu 0.00468 Heze 0.84651
45 Weihai 0.05486 Jining 0.05036 Loudi 0.00465 Zhongshan 0.84649
46 Yancheng 0.05449 Yancheng 0.05022 Xinyang 0.00462 Nanning 0.8458
47 Dongguan 0.05312 Yangzhou 0.04965 Zhumadian 0.00459 Jinchang 0.84367
48 Jiaxing 0.05273 Shantou 0.04957 Fuzhou 0.00451 Jincheng 0.8428
49 Xiamen 0.05159 Cangzhou 0.04914 Yueyang 0.0045 Yan’an 0.84227
50 Handan 0.05051 Jinhua 0.04872 Zhuzhou 0.0045 Hefei 0.84022
51 Linyi 0.05041 Nanchang 0.04807 Hohhot 0.00447 Chaozhou 0.83993
52 Nanyang 0.05037 Luoyang 0.04793 Yangquan 0.00434 Guangyuan 0.83972
53 Yangzhou 0.04967 Linyi 0.04792 Xianyang 0.0043 Loudi 0.83965
54 Zhangzhou 0.04923 Nanyang 0.04788 Tongling 0.00427 Suzhou (Wan) 0.8394
55 Shantou 0.04915 Zhanjiang 0.04742 Chenzhou 0.00418 Shaoguan 0.83882
56 Huizhou 0.04874 Xiamen 0.04665 Shangrao 0.00404 Changzhi 0.83684
57 Zhenjiang 0.04787 Taizhou (Su) 0.04539 Bozhou 0.00404 Zhoukou 0.83661
58 Nanchang 0.04733 Jiangmen 0.04456 Luoyang 0.004 Suqian 0.83509
59 Cangzhou 0.04646 Maoming 0.04436 Sanya 0.00398 Tongchuan 0.83506
60 Dongying 0.04472 Yichang 0.04335 Linfen 0.00396 Urumqi 0.83484
61 Luoyang 0.04394 Zhenjiang 0.04278 Xuzhou 0.00378 Heyuan 0.83412
62 Tai’an 0.04232 Yueyang 0.04241 Zigong 0.00367 Liupanshui 0.83286
63 Taizhou (Su) 0.04232 Dongying 0.04229 Anshun 0.00366 Huainan 0.83212
64 Jilin 0.04221 Nanning 0.04168 Guigang 0.00355 Fuzhou 0.8316
65 Zhuhai 0.04099 Zhangzhou 0.04168 Langfang 0.00344 Xinzhou 0.83029
66 Zhanjiang 0.04019 Langfang 0.04052 Liaocheng 0.00336 Zhumadian 0.83018
67 Huzhou 0.03992 Zhoukou 0.04034 Suzhou (Wan) 0.0033 Xinyu 0.82924
68 Taiyuan 0.03901 Zhongshan 0.0403 Xi’an 0.00328 Ya’an 0.82669
69 Xingtai 0.03884 Zhuhai 0.04017 Ankang 0.00316 Yueyang 0.82524
70 Hengyang 0.03813 Tai’an 0.03997 Shangqiu 0.00311 Lishui 0.82517
71 Yueyang 0.03791 Hengyang 0.03974 Taizhou (Su) 0.00307 Shiyan 0.82457
72 Changde 0.03784 Changde 0.0392 Huai’an 0.00307 Changde 0.8245
73 Jieyang 0.03782 Zhuzhou 0.03897 Huaibei 0.003 Haikou 0.82398
74 Yichang 0.03776 Weihai 0.03841 Zhangjiajie 0.00297 Ezhou 0.82354
75 Langfang 0.03709 Urumqi 0.0378 Yuxi 0.00296 Jixi 0.82337
Ranking City Urban economic efficiency in 2000 City Urban economic efficiency in 2015 City Urban
economic efficiency increment
City Urbanization economic efficiency
76 Zhaoqing 0.03696 Huizhou 0.03774 Songyuan 0.00284 Jinzhong 0.82283
77 Mianyang 0.03625 Lanzhou 0.03634 Baoshan 0.00277 Langfang 0.82227
78 Lanzhou 0.0353 Huai’an 0.0358 Xining 0.00276 Ji’an 0.82212
79 Huanggang 0.03523 Dezhou 0.03555 Chengde 0.00275 Ziyang 0.8218
80 Hefei 0.03474 Liuzhou 0.03529 Guangyuan 0.00275 Yichang 0.81884
81 Dezhou 0.03456 Xingtai 0.03523 Ezhou 0.00275 Shuangya-
shan
0.81823
82 Zhuzhou 0.03447 Anshan 0.03465 Ganzhou 0.00272 Yangjiang 0.81764
83 Suihua 0.03411 Qujing 0.03454 Yingtan 0.0027 Baiyin 0.81762
84 Zhoukou 0.0341 Yuxi 0.03434 Chifeng 0.00269 Hengyang 0.81726
85 Huai’an 0.03273 Zhumadian 0.03379 Cangzhou 0.00268 Yulin (Gui) 0.81464
86 Jingzhou 0.03271 Jingzhou 0.03354 Longyan 0.00264 Hanzhong 0.81429
87 Nanning 0.03271 Mianyang 0.03351 Tongliao 0.00259 Longyan 0.81343
88 Guilin 0.03268 Huzhou 0.03351 Datong 0.00258 Tongling 0.81328
89 Zhongshan 0.03229 Liaocheng 0.033 Jiujiang 0.00256 Huaibei 0.81327
90 Qiqihar 0.03203 Pingdingshan 0.03292 Weinan 0.00247 Jingdezhen 0.81256
91 Qinhuangdao 0.03185 Xuchang 0.03289 Pingding-
shan
0.00242 Foshan 0.81241
92 Guiyang 0.03152 Guilin 0.03258 Binzhou 0.00236 Zhuhai 0.81127
93 Deyang 0.03147 Zhaoqing 0.03257 Chaoyang 0.00235 Zhuzhou 0.81084
94 Yuxi 0.03138 Xinyang 0.03235 Bengbu 0.00223 Chizhou 0.80994
95 Urumqi 0.03093 Ganzhou 0.03232 Zhangjiakou 0.00222 Chengdu 0.80768
96 Lianyungang 0.03089 Chenzhou 0.03211 Leshan 0.00222 Yiyang 0.80687
97 Hengshui 0.03079 Shangqiu 0.03161 Sanmenxia 0.0022 Chenzhou 0.80616
98 Xuchang 0.03075 Heze 0.03127 Xuchang 0.00215 Cangzhou 0.80473
99 Xinxiang 0.03068 Lianyungang 0.03123 Tianshui 0.00207 Neijiang 0.80315
100 Panjin 0.03065 Binzhou 0.03108 Jiayuguan 0.00193 Leshan 0.80256
101 Sanming 0.03053 Xianyang 0.03107 Zunyi 0.00181 Bengbu 0.80136
102 Pingdingshan 0.03049 Anyang 0.03093 Yulin (Gui) 0.00181 Ganzhou 0.80086
103 Anyang 0.03032 Jilin 0.03076 Shiyan 0.00179 Fuxin 0.80085
104 Shaoyang 0.02979 Wuhu 0.0307 Shaoguan 0.00172 Fangcheng-
gang
0.80008
105 Liaocheng 0.02964 Panjin 0.03066 Zaozhuang 0.00166 Shangrao 0.79991
106 Ganzhou 0.0296 Huanggang 0.0306 Baotou 0.00165 Huaihua 0.79798
107 Zhumadian 0.02919 Guiyang 0.0306 Hengyang 0.00161 Huangshan 0.79763
108 Anqing 0.02912 Jieyang 0.03054 Jingdezhen 0.00159 Zhoushan 0.79753
109 Xiaogan 0.0291 Xinxiang 0.03051 Nantong 0.00153 Linfen 0.7968
110 Binzhou 0.02872 Suqian 0.03015 Yiyang 0.00146 Pingdingshan 0.79657
111 Jingmen 0.02869 Zaozhuang 0.02995 Xianning 0.00139 Wuhu 0.79645
112 Shangqiu 0.0285 Sanming 0.02989 Changde 0.00137 Bazhong 0.79546
Ranking City Urban economic efficiency in 2000 City Urban economic efficiency in 2015 City Urban
economic efficiency increment
City Urbanization economic efficiency
113 Chuzhou 0.02843 Yulin (Shaan) 0.02971 Lishui 0.00136 Shantou 0.79426
114 Zaozhuang 0.02829 Longyan 0.02959 Baoji 0.00133 Wuzhou 0.79373
115 Fushun 0.02807 Deyang 0.0294 Ziyang 0.00129 Xinyang 0.79289
116 Ningde 0.02806 Zhangjiakou 0.02904 Meizhou 0.00128 Changzhou 0.79243
117 Chenzhou 0.02793 Zunyi 0.02892 Benxi 0.00116 Yuncheng 0.79184
118 Nanping 0.02784 Fuyang 0.02872 Chizhou 0.00116 Huai’an 0.79169
119 Xinyang 0.02773 Qinhuangdao 0.02868 Meishan 0.00115 Chengde 0.79076
120 Yongzhou 0.02768 Shaoguan 0.02837 Xiangtan 0.00108 Panzhihua 0.79016
121 Zunyi 0.02711 Qiqihar 0.02811 Lanzhou 0.00104 Hebi 0.78878
122 Longyan 0.02695 Anqing 0.02783 Dezhou 0.00099 Datong 0.78822
123 Zhangjiakou 0.02682 Baotou 0.0278 Handan 0.00099 Songyuan 0.78803
124 Xianyang 0.02678 Shaoyang 0.02775 Wuzhou 0.00093 Wuhai 0.78739
125 Jiaozuo 0.02674 Xiangtan 0.02762 Zhoushan 0.00084 Taizhou (Su) 0.78472
126 Shaoguan 0.02665 Jiaozuo 0.02699 Jingzhou 0.00083 Qingdao 0.78381
127 Xiangtan 0.02655 Jiujiang 0.02678 Heihe 0.0008 Nantong 0.78336
128 Baotou 0.02615 Changzhi 0.02663 Pingxiang 0.00076 Zunyi 0.78333
129 Chaozhou 0.02599 Hengshui 0.02644 Nanchang 0.00075 Meishan 0.78306
130 Kaifeng 0.02566 Yichun (Gan) 0.02633 Ma’anshan 0.00063 Quzhou 0.78202
131 Huangshi 0.02555 Yulin (Gui) 0.02611 Anyang 0.00061 Pingxiang 0.77914
132 Qujing 0.02532 Loudi 0.02581 Fuxin 0.00057 Ningde 0.77892
133 Yibin 0.02523 Yongzhou 0.02579 Panzhihua 0.00051 Suizhou 0.77853
134 Rizhao 0.02478 Baoji 0.0257 Shantou 0.00042 Luoyang 0.7778
135 Huaihua 0.02468 Shiyan 0.02536 Suining 0.00038 Benxi 0.77522
136 Dazhou 0.02447 Shangrao 0.02518 Ya’an 0.00036 Suining 0.77339
137 Mudanjiang 0.02441 Yiyang 0.02517 Lianyungang 0.00034 Luzhou 0.77239
138 Baoji 0.02437 Ningde 0.02516 Hanzhong 0.00027 Liaoyuan 0.77159
139 Yulin (Gui) 0.0243 Zigong 0.02506 Jiaozuo 0.00025 Panjin 0.77121
140 Jiujiang 0.02422 Hohhot 0.02503 Heyuan 0.00007 Shangqiu 0.77047
141 Heze 0.02396 Yuncheng 0.02498 Hegang 0.00006 Sanmenxia 0.76989
142 Wuhu 0.02393 Meizhou 0.02494 Panjin 0.00002 Qinzhou 0.76969
143 Liuzhou 0.02372 Linfen 0.02476 Luzhou ‒0.00001 Yangzhou 0.76954
144 Yiyang 0.02371 Xiaogan 0.02459 Yangzhou ‒0.00002 Xuchang 0.76919
145 Meizhou 0.02366 Huaihua 0.02431 Wuhai ‒0.00005 Zhangjiakou 0.76862
146 Shiyan 0.02357 Datong 0.02429 Guilin ‒0.00011 Lanzhou 0.76783
147 Putian 0.02356 Weinan 0.02412 Xinxiang ‒0.00017 Baicheng 0.76756
148 Puyang 0.02349 Kaifeng 0.02407 Hebi ‒0.00022 Weinan 0.76675
149 Jinzhou 0.02334 Rizhao 0.02397 Huangshan ‒0.00023 Xining 0.7667
150 Nanchong 0.02297 Suzhou (Wan) 0.02391 Putian ‒0.00029 Luohe 0.76547
Ranking City Urban economic efficiency in 2000 City Urban economic efficiency in 2015 City Urban economic efficiency increment City Urbanization economic efficiency
151 Fuyang 0.02292 Nanping 0.0239 Quzhou ‒0.00031 Baoji 0.76425
152 Suqian 0.02286 Yibin 0.02384 Fangcheng-
gang
‒0.00033 Dazhou 0.76342
153 Yangjiang 0.02227 Jincheng 0.0238 Huaihua ‒0.00038 Zaozhuang 0.76245
154 Yunfu 0.02219 Chaozhou 0.02376 Suizhou ‒0.00048 Deyang 0.76165
155 Luzhou 0.02205 Chuzhou 0.02369 Tongchuan ‒0.00054 Wuxi 0.76131
156 Datong 0.02171 Suihua 0.02354 Jiaxing ‒0.00055 Jiujiang 0.76096
157 Weinan 0.02165 Huangshi 0.02333 Baiyin ‒0.00061 Baishan 0.76036
158 Zigong 0.02139 Putian 0.02327 Sanming ‒0.00064 Xianyang 0.76023
159 Dandong 0.02116 Yinchuan 0.02307 Baicheng ‒0.00065 Liaocheng 0.75873
160 Loudi 0.02116 Dazhou 0.02296 Neijiang ‒0.00073 Xianning 0.75871
161 Shangrao 0.02115 Jingmen 0.0229 Jinchang ‒0.00077 Chifeng 0.7574
162 Shanwei 0.02093 Chengde 0.02284 Rizhao ‒0.00081 Chaoyang 0.75552
163 Linfen 0.0208 Jinzhong 0.02277 Zhuhai ‒0.00082 Anyang 0.75238
164 Lu’an 0.02076 Sanmenxia 0.02276 Liaoyuan ‒0.00084 Guilin 0.75238
165 Neijiang 0.02074 Karamay 0.02252 Guiyang ‒0.00091 Anqing 0.75236
166 Ziyang 0.0207 Bozhou 0.02245 Luohe ‒0.00093 Yibin 0.75235
167 Liaoyang 0.02065 Puyang 0.02232 Bazhong ‒0.00099 Lu’an 0.74944
168 Suzhou (Wan) 0.02061 Haikou 0.0223 Shuangya-
shan
‒0.001 Xi’an 0.74942
169 Xuancheng 0.02059 Luzhou 0.02205 Beihai ‒0.00104 Xiangtan 0.74924
170 Sanmenxia 0.02056 Ziyang 0.02199 Changzhou ‒0.00115 Nanchang 0.74875
171 Hohhot 0.02056 Bengbu 0.02193 Puyang ‒0.00117 Jiaxing 0.74599
172 Yingkou 0.02047 Fushun 0.02184 Nanchong ‒0.00117 Binzhou 0.74481
173 Chengde 0.0201 Nanchong 0.02181 Anqing ‒0.00129 Hohhot 0.74476
174 Quzhou 0.02009 Huainan 0.02141 Yibin ‒0.00138 Xuzhou 0.74371
175 Yichun (Gan) 0.02005 Leshan 0.02131 Dazhou ‒0.00151 Jingzhou 0.74352
176 Yuncheng 0.01998 Yan’an 0.02112 Baishan ‒0.00152 Tongliao 0.74085
177 Changzhi 0.01998 Jinzhou 0.0211 Yangjiang ‒0.00153 Jinzhou 0.74024
178 Benxi 0.01972 Benxi 0.02088 Kaifeng ‒0.0016 Putian 0.73865
179 Bengbu 0.01971 Ji’an 0.02083 Xuancheng ‒0.0018 Jinhua 0.73862
180 Leshan 0.01909 Yangjiang 0.02075 Yongzhou ‒0.00189 Sanming 0.73839
181 Tonghua 0.01902 Mudanjiang 0.02068 Yichun (Hei) ‒0.00192 Laiwu 0.7378
182 Luohe 0.01893 Songyuan 0.02062 Shaoyang ‒0.00205 Wenzhou 0.73332
183 Hanzhong 0.01892 Neijiang 0.02 Deyang ‒0.00207 Qinhuangdao 0.73304
184 Huludao 0.0185 Quzhou 0.01978 Lu’an ‒0.00209 Shaoyang 0.73234
185 Bozhou 0.0184 Shuozhou 0.01969 Qitaihe ‒0.00213 Xuancheng 0.73119
186 Siping 0.01815 Tongliao 0.01942 Chaozhou ‒0.00223 Kaifeng 0.72825
187 Wuzhou 0.01782 Hanzhong 0.01918 Huangshi ‒0.00223 Huangshi 0.72697
Ranking City Urban economic efficiency in 2000 City Urban economic efficiency in 2015 City Urban economic efficiency increment City Urbanization economic efficiency
188 Songyuan 0.01779 Chifeng 0.01894 Jinzhou ‒0.00224 Nanchong 0.72474
189 Jiamusi 0.01773 Xuancheng 0.01879 Qinzhou ‒0.00225 Jiamusi 0.72381
190 Guang’an 0.0177 Xianning 0.01877 Tai’an ‒0.00235 Puyang 0.72351
191 Qingyuan 0.01757 Wuzhou 0.01875 Guang’an ‒0.00237 Handan 0.72143
192 Jincheng 0.01743 Lishui 0.01872 Qingyuan ‒0.00237 Qingyuan 0.72082
193 Xianning 0.01738 Lu’an 0.01868 Dongying ‒0.00243 Shaoxing 0.71911
194 Lishui 0.01736 Fuzhou 0.01853 Linyi ‒0.00248 Jiaozuo 0.71515
195 Ma’anshan 0.01698 Guigang 0.01832 Nanyang ‒0.00249 Siping 0.71215
196 Jinzhong 0.01697 Liupanshui 0.01816 Laiwu ‒0.00258 Mianyang 0.71145
197 Qinzhou 0.01693 Luohe 0.018 Mianyang ‒0.00274 Shanwei 0.7104
198 Jixi 0.01692 Xinzhou 0.01771 Jixi ‒0.00277 Rizhao 0.70631
199 Tongliao 0.01683 Ma’anshan 0.01761 Ningde ‒0.0029 Qiqihar 0.70437
200 Haikou 0.01676 Yangquan 0.01755 Tieling ‒0.00291 Xinxiang 0.70266
201 Huainan 0.01671 Dandong 0.01741 Siping ‒0.00305 Beihai 0.70026
202 Suining 0.01656 Meishan 0.01736 Qingdao ‒0.00307 Ma’anshan 0.70012
203 Chifeng 0.01625 Yingkou 0.01707 Qinhuangdao ‒0.00316 Nanping 0.69999
204 Meishan 0.01621 Suining 0.01694 Yingkou ‒0.00341 Lianyungang 0.69823
205 Panzhihua 0.01613 Liaoyang 0.01674 Xingtai ‒0.00361 Yancheng 0.69661
206 Karamay 0.01606 Panzhihua 0.01664 Mudanjiang ‒0.00373 Huludao 0.6937
207 Ji’an 0.01605 Zhoushan 0.0162 Dandong ‒0.00375 Guang’an 0.69319
208 Tieling 0.01564 Huaibei 0.01612 Liaoyang ‒0.00391 Maoming 0.6913
209 Suizhou 0.01557 Xining 0.01576 Qiqihar ‒0.00392 Zhenjiang 0.69129
210 Zhoushan 0.01536 Guangyuan 0.01558 Nanping ‒0.00395 Liaoyang 0.68833
211 Guigang 0.01477 Ezhou 0.01535 Yancheng ‒0.00427 Dandong 0.68687
212 Laiwu 0.01437 Guang’an 0.01533 Hengshui ‒0.00435 Mudanjiang 0.68629
213 Pingxiang 0.01405 Qingyuan 0.01521 Huludao ‒0.00438 Taizhou (Zhe) 0.68333
214 Fuzhou 0.01402 Tongling 0.01518 Zhaoqing ‒0.00439 Hengshui 0.68274
215 Beihai 0.01328 Siping 0.0151 Jiamusi ‒0.00441 Xiamen 0.6801
216 Yangquan 0.01321 Suizhou 0.01508 Xiaogan ‒0.00451 Tai’an 0.6792
217 Huaibei 0.01312 Yunfu 0.01507 Jining ‒0.00457 Yunfu 0.67338
218 Yan’an 0.01312 Ankang 0.01486 Huanggang ‒0.00463 Kunming 0.67314
219 Xining 0.01299 Pingxiang 0.01481 Chuzhou ‒0.00474 Dezhou 0.67282
220 Guangyuan 0.01283 Qinzhou 0.01468 Xiamen ‒0.00493 Xingtai 0.67166
221 Ezhou 0.0126 Jixi 0.01415 Zhenjiang ‒0.00509 Yongzhou 0.6713
222 Bazhong 0.01239 Huludao 0.01412 Tonghua ‒0.00518 Jingmen 0.67129
223 Hebi 0.01231 Xinyu 0.01387 Jingmen ‒0.00578 Guiyang 0.67065
224 Huangshan 0.01198 Tonghua 0.01384 Fushun ‒0.00623 Chuzhou 0.66934
225 Baishan 0.0119 Shanwei 0.01374 Huzhou ‒0.00641 Nanyang 0.66723
Ranking City Urban economic efficiency in 2000 City Urban economic efficiency in 2015 City Urban economic efficiency increment City Urbanization economic efficiency
226 Jingdezhen 0.01187 Chaoyang 0.0136 Wenzhou ‒0.00673 Tieling 0.66379
227 Shuangyashan 0.0118 Jingdezhen 0.01346 Yunfu ‒0.00712 Tonghua 0.65796
228 Ankang 0.0117 Tianshui 0.01344 Shanwei ‒0.00719 Huanggang 0.65581
229 Yinchuan 0.0117 Jiamusi 0.01333 Jieyang ‒0.00728 Baotou 0.6478
230 Liupanshui 0.01154 Anshun 0.01281 Jinan ‒0.00753 Dongying 0.63769
231 Shuozhou 0.0114 Tieling 0.01273 Zhangzhou ‒0.00755 Huzhou 0.63615
232 Tianshui 0.01138 Baoshan 0.01256 Jinhua ‒0.0079 Huizhou 0.62521
233 Chaoyang 0.01125 Beihai 0.01223 Kunming ‒0.0083 Jinan 0.62358
234 Heyuan 0.01123 Hebi 0.01209 Shaoxing ‒0.00882 Yingkou 0.6209
235 Xinzhou 0.01101 Laiwu 0.01179 Zibo ‒0.00938 Xiaogan 0.61562
236 Yulin (Shaan) 0.01093 Huangshan 0.01175 Taizhou (Zhe) ‒0.00942 Fushun 0.60547
237 Tongling 0.01091 Zhangjiajie 0.01153 Suihua ‒0.01057 Jining 0.58663
238 Baiyin 0.01091 Bazhong 0.0114 Dalian ‒0.01081 Jieyang 0.5863
239 Yichun (Hei) 0.0108 Heyuan 0.0113 Huizhou ‒0.011 Dalian 0.58436
240 Ya’an 0.01071 Heihe 0.01125 Maoming ‒0.01105 Zhangzhou 0.57603
241 Heihe 0.01045 Ya’an 0.01107 Jilin ‒0.01145 Zhaoqing 0.57519
242 Baicheng 0.00984 Yingtan 0.01097 Yantai ‒0.01148 Suihua 0.56706
243 Baoshan 0.00979 Shuangyashan 0.0108 Foshan ‒0.01197 Zibo 0.56134
244 Liaoyuan 0.00975 Baishan 0.01038 Harbin ‒0.01217 Weifang 0.56027
245 Hegang 0.00931 Baiyin 0.01031 Weifang ‒0.01217 Shijiazhuang 0.55449
246 Fuxin 0.00921 Chizhou 0.01018 Baoding ‒0.01258 Yantai 0.54369
247 Anshun 0.00914 Fuxin 0.00978 Wuxi ‒0.01293 Linyi 0.54214
248 Chizhou 0.00902 Hegang 0.00937 Shenyang ‒0.01325 Harbin 0.51323
249 Xinyu 0.00881 Baicheng 0.00919 Changchun ‒0.01401 Shenyang 0.46363
250 Fangcheng-
gang
0.00872 Liaoyuan 0.00891 Shijiazhuang ‒0.01486 Fuzhou 0.45157
251 Zhangjiajie 0.00856 Yichun (Hei) 0.00888 Jiangmen ‒0.01537 Changchun 0.4443
252 Qitaihe 0.00847 Sanya 0.00873 Weihai ‒0.01645 Quanzhou 0.44197
253 Yingtan 0.00827 Fangcheng-
gang
0.00839 Fuzhou ‒0.01725 Jilin 0.41131
254 Tongchuan 0.00686 Qitaihe 0.00634 Quanzhou ‒0.01819 Baoding 0.33275
255 Wuhai 0.00613 Tongchuan 0.00632 Daqing ‒0.01861 Jiangmen 0.32341
256 Jinchang 0.00578 Wuhai 0.00608 Chongqing ‒0.0212 Weihai 0.2638
257 Sanya 0.00475 Jiayuguan 0.00514 Anshan ‒0.02139 Daqing 0.01585
258 Jiayuguan 0.00321 Jinchang 0.00501 Guangzhou ‒0.03368 Anshan 0

Note: Because the names of individual prefecture level cities are the same, the abbreviation name of the provinces is marked after them for distinction. The abbreviation name of Zhejiang Province is Zhe,. the abbreviation name of Anhui Province is Wan, the abbreviation name of Jiangsu Province is Su, the abbreviation name of Guangxi Zhuang Autonomous Region is Gui, the abbreviation name of Shaanxi Province is Shaan, the abbreviation name of Jiangxi Province is Gan, the abbreviation name of Heilongjiang Province is Hei.

[1]
Anderson G, Ge Y, 2004. Do economic reforms accelerate urban growth? The case of China. Urban Studies, 41(11): 2197-2210.

DOI

[2]
Bai X M, Chen J, Shi P, 2012. Landscape urbanization and economic growth in China: Positive feedbacks and sustainability dilemmas. Environmental Science and Technology, 46(1): 132-139.

DOI PMID

[3]
Bai Y P, Deng X Z, Jiang S J, et al., 2018. Exploring the relationship between urbanization and urban eco-efficiency: Evidence from prefecture-level cities in China. Journal of Cleaner Production, 195(10): 1487-1496.

DOI

[4]
Beyer S, 2006. Environmental law and policy in the People’s Republic of China. Chinese Journal of International Law, 5(1): 185-211.

DOI

[5]
Cai F, 2012. Is there a “middle-income trap”? Theories, experiences and relevance to China. China and World Economy, 20(1): 49-61.

DOI

[6]
Cao Q, Yu D Y, Georgescu M, et al., 2016. Impacts of urbanization on summer climate in China: An assessment with coupled land-atmospheric modeling. Journal of Geophysical Research: Atmospheres, 121(18): 10505-10521.

[7]
Chen H L, Zhu X, 2016. Challenges brought by America’s “re-industrialization” to manufacturing industry’s development in China and relevant counter measures. Economist, 28(12): 37-44. (in Chinese)

[8]
Chen H Y, Jia B S, Lau S, 2008. Sustainable urban form for Chinese compact cities: Challenges of a rapid urbanized economy. Habitat International, 32(1): 28-40.

DOI

[9]
Chen J, 2007. Rapid urbanization in China: A real challenge to soil protection and food security. Catena, 69(1): 1-15.

DOI

[10]
Chen L M, Wang W P, Wang B, 2015. Economic efficiency, environmental efficiency and eco-efficiency of the so-called two vertical and three horizontal urbanization areas: Empirical analysis based on HDDF and Co-Plot Method. China Soft Science, 30(2): 96-109. (in Chinese)

[11]
Chen X H, Zhang W Z, Zhang H F, 2016. The relations of urban spatial expansion and economic growth in China: A case study of 261 prefecture-level cities. Scientia Geographica Sinica, 36(8): 1141-1147. (in Chinese)

DOI

[12]
Chen Y, Chen Z G, Xu G L, et al., 2016. Built-up land efficiency in urban China: Insights from the General Land Use Plan (2006-2020). Habitat International, 51: 31-38.

DOI

[13]
Chen Y G, Luo J, 2006. Derivation of relations between urbanization level and velocity from logistic growth model. Geographical Research, 25(6): 1063-1072. (in Chinese)

DOI

[14]
Chenery H B, Elkington H, Sims C, 1970. A uniform analysis of development pattern. Economic Development Report. Cambridge, Mass: Harvard University Center for International Affairs.

[15]
Cheng M W, Shi Q H, 2008. Economy growth, capital investment, technology advancement and employment: Case study in China (1978-2006). The Sixth Annual Academic Meeting of Shanghai Social Sciences in 2008. Shanghai: Shanghai Federation of Social Science Associations, 107-117. (in Chinese)

[16]
Coelli T J, 1992. A computer program for frontier production function estimation: Frontier version 2.0. Economics Letters, 39(1): 29-32.

DOI

[17]
Coelli T J, 1994. A Guide to FRONTIER Version 4.1: A Computer Program for Stochastic Frontier Production and Cost Function Estimation. Armidale: University of New England Press.

[18]
Coelli T J, Battese G, 1996. Identification of factors which influence the technical inefficiency of Indian farmers. Australian Journal of Agricultural Economics, 40(2): 103-128.

DOI

[19]
Coelli T J, Rao D S P, O'Donnell C J, et al., 2005. An Introduction to Efficiency and Productivity Analysis. Boston: Springer Press.

[20]
Dai Y A, 2010a. The efficiency and determinants of China’s urbanization. The Journal of Quantitative and Technical Economics, 27(12): 103-117, 132. (in Chinese)

[21]
Dai Y A, 2010b. Empirical research on the Chinese urban efficiency and its influencing factors. Shanghai Journal of Economics, 29(12): 12-19. (in Chinese)

[22]
Deng J P, 2010. Empirical research on the contribution of the factor inputs to China’s economy[D]. Shanghai: East China Normal University. (in Chinese)

[23]
Deng L, Wang Y X, 2010. Economic research on the coordinated development of labor-intensive and capital intensive industries in China after the financial crisis. Reform of Economic System, 28(1): 45-49. (in Chinese)

[24]
Deng Y, Liu S H, Cai J M, et al., 2015. Spatial pattern and its evolution of Chinese provincial population: Methods and empirical study. The Journal of Geographical Sciences, 25(12): 1507-1520.

DOI

[25]
Drennan M P, Brecher C, 2012. Does public transit use enhance the economic efficiency of urban areas? The Journal of Transport and Land Use, 5(3): 53-67.

[26]
Duan L F, 2016. Research on the deviation degree of China’s industrial structure. Statistics and Decision, 32(6): 122-125. (in Chinese)

[27]
Fang C L, Guan X L, Lu S S, et al., 2012. Input-output efficiency of urban agglomerations in China: An application of Data Envelopment Analysis (DEA). Urban Studies, 50(13): 2766-2790.

DOI

[28]
Feng S, 2019. The predicament and realization path of China’s eco-civilization construction. IOP Conference Series: Earth and Environmental Science, 237: 1-6.

[29]
Gao D W, Ju X F, 2010. Empirical study on the effects of the structure of local fiscal expenditures on economic growth. Journal of Harbin Engineering University, 31(6): 809-814. (in Chinese)

[30]
Gao Y Y, 2008. On the sustainable development of labor intensive industries in China. Modern Business, 3(26): 210-211. (in Chinese)

[31]
Gong C Z, Qin Y, 2011. Some comments on percentage of labor payment in first distribution in China. Journal of Eastern Liaoning University (Social Sciences), 13(4): 53-57. (in Chinese)

[32]
Guo Z D, Di M X, 2014. Analysis on the causes and countermeasures of the low proportion of labor remuneration in GDP in China. Journal of Theoretical Reference, 13(2): 24-27. (in Chinese)

[33]
Halkos G E, Tzeremes N G, 2009. Measuring regional economic efficiency: The case of Greek prefectures. The Annals of Regional Science, 45(3): 603-632.

DOI

[34]
Hall R E, Jones C I, 1998. Why do some countries produce so much more output per worker than others? The Quarterly Journal of Economics, 114(1): 83-116.

DOI

[35]
Han Z F, 2008. The research on public finance expenditure of western China regional government and economic growth[D]. Xi’an: Northwest University. (in Chinese)

[36]
He C F, Huang Z J, Wang R, 2013. Land use change and economic growth in urban China: A structural equation analysis. Urban Studies, 51(13): 2880-2898.

DOI

[37]
He Y, 2014. An empirical study on the impact of urban size and form on urban economic efficiency: Based on the 2011 urban cross section data of China. Management and Technology of SME, 7(24): 167-171. (in Chinese)

[38]
Hou L K, Zhang Y J, Zhan J Y, et al., 2012. Marginal revenue of land and total factor productivity in Chinese agriculture: Evidence from spatial analysis. Journal of Geographical Sciences, 22(1): 167-178.

DOI

[39]
Hu C L, 2010. A comparative analysis of national income distribution in Zhejiang Province. Statistical Science and Practice, 29(4): 4-6. (in Chinese)

[40]
Hu Y J, 2014. Ecological civilization construction in China: Origins, concepts and paths. Applied Mechanics and Materials, 522-524(2014): 1810-1816.

[41]
Hu Z L, 2006. IP is the key from manufacturing to creation. New Economy Weekly, 6(18): 14. (in Chinese)

[42]
Hui S C M, 2001. Low energy building design in high density urban cities. Renewable Energy, 24(3): 627-640.

DOI

[43]
Islam N, 2014. Will inequality lead China to the middle income trap? Frontiers of Economics in China, 9(3): 398-437.

DOI

[44]
Jiang H, Xia Y R, Qu F T, 2009. Study on contribution of construction land expansion to economic growth and its regional difference. China Land Science, 23(8): 4-8. (in Chinese)

[45]
Jin F Z, Cui S H, 2010. The influence of industrial structure deviation on economic growth: A case study of Hebei Province. Productivity Research, 25(7): 196-202. (in Chinese)

[46]
Jin G, Deng X Z, Zhao X D, et al., 2018. Spatiotemporal patterns in urbanization efficiency within the Yangtze River Economic Belt between 2005 and 2014. Journal of Geographical Sciences, 28(8): 1113-1126.

DOI

[47]
Jin J, Zhang E Z, Dai X, 2015. On strategic adjustment of China’s open economy under new situation. Economic Management, 37(6): 12-20. (in Chinese)

[48]
Jones W C, 1988. Environmental law and policy in the People’s Republic of China. The Journal of Asian Studies, 47(3): 617-618.

DOI

[49]
Kim E, Hewings G J D, Nam K M, 2014. Optimal urban population size: National vs local economic efficiency. Urban Studies, 51(2): 428-445.

DOI

[50]
Li G D, Fang C L, Pang B, 2014. Quantitative measuring and influencing mechanism of urban and rural land intensive use in China. Journal of Geographical Sciences, 24(5): 858-874.

DOI

[51]
Li S Y, 2006. The first distribution should also carry out impartial principle. East China Economic Management, 20(4): 155-158. (in Chinese)

[52]
Li X, Xu X X, Chen H H, 2005. Temporal and spatial changes of urban efficiency in the 1990s. Acta Geographica Sinica, 60(4): 615-625. (in Chinese)

DOI

[53]
Li Y X, Zheng L A, 2019. Study on economic growth efficiency and influencing factors in western provinces: An empirical analysis based on SFA model. Ecological Economy, 35(3): 57-62. (in Chinese)

[54]
Lin G C S, 2014. China’s landed urbanization: Neoliberalizing politics, land commodification, and municipal finance in the growth of metropolises. Environment and Planning A: Economy and Space, 46(8): 1814-1835.

DOI

[55]
Liu C G, Zhang X P, 2016. The influence of labor force ratio on the investment rate and economic growth: Based on the research of Solow model and data of China. Journal of Xiangtan University (Philosophy and Social Sciences), 40(3): 60-65. (in Chinese)

[56]
Liu J S, 2009a. Labor intensive industry is still the foundation of Chinese people. Yunnan Finance and Economics University Journal of Economics and Management, 24(5): 55-56. (in Chinese)

[57]
Liu J S, 2009b. China still needs to pay attention to the development of labor-intensive industries. China Urban Economy, 12(7): 18-19. (in Chinese)

[58]
Liu R L, 2009. The impact of financial crisis on China’s manufacturing industry and countermeasures. Finance and Economy, 28(6): 15-16. (in Chinese)

[59]
Liu S C, Xiao W, Li L L, et al., 2020. Urban land use efficiency and improvement potential in China: A stochastic frontier analysis. Land Use Policy, 99(3): 105046.

DOI

[60]
Liu S J, Xue L, 2021. The spatio-temporal heterogeneity of county-level economic development and primary drivers across the Loess Plateau, China. Journal of Geographical Sciences, 31(3): 423-436.

DOI

[61]
Liu X N, Wang W, 2004. A relationship between red tide outbreaks and urban development along the coasts of Guangdong Province. Journal of Geographical Sciences, 14(2): 219-225.

[62]
Liu Z J, Huang H Q, Werners S E, et al., 2016. Construction area expansion in relation to economic-demographic development and land resource in the Pearl River Delta of China. Journal of Geographical Sciences, 26(2): 188-202.

DOI

[63]
Long H L, Liu Y Q, Hou X G, et al., 2014. Effects of land use transitions due to rapid urbanization on ecosystem services: Implications for urban planning in the new developing area of China. Habitat International, 44: 536-544.

DOI

[64]
Lu Y F, Zhan L Q, Fu C, 2011. The energy economic-environment efficiency of Poyang Lake eco-economic region. 2011 International Conference on Remote Sensing, Environment and Transportation Engineering: 3663-3666.

[65]
Mao X S, 2018. The world situation and national conditions of China’s striding over the “middle income trap”. Practice in Foreign Economic Relations and Trade, 36(10): 8-11. (in Chinese)

[66]
Mera K, 1973. On the urban agglomeration and economic efficiency. Economic Development and Cultural Change, 21(2): 309-324.

DOI

[67]
National Bureau of Statistics, 2001. 2015 National Economic and Social Development Statistical Bulletin, 6 January 2020, http://www.stats.gov.cn/tjsj/zxfb/201602/t20160229_1323991.html.

[68]
National Bureau of Statistics, 2016. National data, 6 January 2020, https://data.stats.gov.cn/easyquery.htm?cn=C01&zb=A0305&sj=2000.

[69]
Peng R S, Tan C L, 2007. Analysis on relations of rural labor transfer, tertiary industry development and urbanization in Henan province. China Population, Resources and Environment, 17(2): 136-142. (in Chinese)

[70]
Piña W H A, Martínez C I P, 2016. Development and urban sustainability: An analysis of efficiency using Data Envelopment Analysis. Sustainability, 8(2): 148.

DOI

[71]
Qiu J X, Wang X K, Lu F, et al., 2012. The spatial pattern of landscape fragmentation and its relations with urbanization and socio-economic developments: A case study of Beijing. Acta Ecologica Sinica, 32(9): 2659-2669. (in Chinese)

DOI

[72]
Raman Shibu, 2010. Designing a liveable compact city: Physical forms of city and social life in urban neighbourhoods. Built Environment, 36(1): 63-80.

DOI

[73]
Ren Y T, Li H, Shen L Y, et al., 2018. What is the efficiency of fast urbanization? A China study. Sustainability, 10(9): 3180.

DOI

[74]
Seema D, 2010. High urban densities in developing countries: A sustainable solution? Built Environment, 36(1): 9-27.

DOI

[75]
Shang Y S, Liu S G, Liu C Y, et al., 2020. Spatial-temporal characteristics of urbanization efficiency in coastal cities of China. Earth and Environmental Science, 428: 012095.

[76]
Shi J G, Wang Z, 2012. Urbanization and economic development in China: An empirical revisit based on cross-country data. Chinese Journal of Population Science, 26(2): 36-46. (in Chinese)

[77]
Shi K, 2014. Analysis of relationships among capital stock, labor force and aggregate output: Based on production function combining with Auto-Regressive and Moving Average Model. Accounting and Finance, 29(1): 70-75. (in Chinese)

[78]
Song W, Deng X Z, 2015. Effects of urbanization-induced cultivated land loss on ecosystem services in the North China Plain. Energies, 8(6): 5678-5693.

DOI

[79]
Sridhar K S, 2020. Urbanization in the global south: Economic efficiency, equity and sustainability. EQUILIBRI, 24(Special Issue):45-55.

[80]
Su Q, 2011. The effect of population density, road network density, and congestion on household gasoline consumption in U.S. urban areas. Energy Economics, 33(3): 445-452.

DOI

[81]
Su Q Y, 2013. The direction of labor intensive industry upgrading. In: China Economic Analysis and Outlook (2012-2013). Beijing: 138-145. (in Chinese)

[82]
Su W Z, Yang G S, Zhen F, 2007. Ecological land fragmentation and its connectivity with urbanization in the Yangtze River Delta. Acta Geographica Sinica, 62(12): 1309-1317. (in Chinese)

[83]
Sun B, Chen Z H, 2014. The re-cognition and direction of Chinese labor-intensive industry. Advanced Materials Research, 945-949: 2911-2914.

[84]
Sun L, 2019. Public finance expenditure and real economic growth: scale, structure and external spillover. Macroeconomics, 41(4): 18-29, 175. (in Chinese)

[85]
Tang M G, Li Z, Hu F X, et al., 2020. How does land urbanization promote urban eco-efficiency? The mediating effect of industrial structure advancement. Journal of Cleaner Production, 272(5): 122798.

DOI

[86]
Wang J Y, 2003. Comparative study on model of population urbanization and economic development. China Population, Resources and Environment, 13(5): 52-58. (in Chinese)

[87]
Wang R, Zhou B T, Gan X K, 2018. Relationships between spatial pattern of landscape fragmentation and urbanization and socio-economic developmental level in southwest mountainous region: A case study of Yubei district in Chongqing. Resources and Environment in the Yangtze Basin, 27(3): 624-631. (in Chinese)

[88]
Wang S, Jia M Y, Zhou Y H, et al., 2020. Impacts of changing urban form on ecological efficiency in China: A comparison between urban agglomerations and administrative areas. Journal of Environmental Planning and Management, 63(10): 1834-1856.

DOI

[89]
Wang T, Shi D, An J, 2015. An empirical study on the relationship between industrial structure deviation and economic growth in Shanghai: Based on a new index judging industrial structure deviation. East China Economic Management, 29(8): 17-23. (in Chinese)

[90]
Wang X L, Bu R C, Hu Y M, et al., 1996. Landscape fragmentation analysis of wetlands in Liaohe River Delta. Chinese Journal of Applied Ecology, 7(3): 299-304. (in Chinese)

[91]
Wang Y M, 2015. The new normal of China’s economy. Qiushi Journal, 7(2): 42-47.

[92]
Wang Y M, Chen C, Gao S H, 2016. The estimation and analysis on TFP of Chinese cities: From 2000 to 2013. On Economic Problems, 38(8): 1-8, 34. (in Chinese)

[93]
Wang Y Z, Lv L J, 2015. Study on the rising channel of labor remuneration and the measures for further improvement. Journal of Management, 28(2): 42-56. (in Chinese)

[94]
Wang Z B, Liang L W, Wang X J, 2021. Spatiotemporal evolution of PM2.5 concentrations in urban agglomerations of China. Journal of Geographical Sciences, 31(6): 878-898.

DOI

[95]
Wei P, Yu Y S, 2018. The impact of industrial structure change on urban economic efficiency: A case study of 285 cities in China. Urban Problems, 37(11): 4-11. (in Chinese)

[96]
Wei S H, Yang L, 2012. Urban innovative capacity and economic efficiency: Evidence from 54 cities in China. Science and Technology and Economy, 25(6): 1-5. (in Chinese)

[97]
Woo W T, 2012. China meets the middle-income trap: The large potholes in the road to catching-up. Journal of Chinese Economic and Business Studies, 10(4): 313-336.

DOI

[98]
Wu J Q, Pan W X, 2013. On raising labour share in primary distribution: From a view point of wage determination system. Contemporary Economy and Management, 35(5): 15-20. (in Chinese)

[99]
Wu L C, Chen X, Gu L J, 2013. Land protection and food security in the accelerated urbanization progress of China. Issues in Agricultural Economy, 34(1): 57-62. (in Chinese)

[100]
Wu Z Y, He J W, 2018. Risk prevention and overcoming middle income trap in transition period. China Policy Review, 13(3): 43-47. (in Chinese)

[101]
Xi Q M, 2012. Empirical research on the relationship between city efficiency and city size: Based on city panel data from 2001 to 2009 in China. On Economic Problems, 34(10): 37-41. (in Chinese)

DOI

[102]
Xiao L, 2010. The reason and influence of low labor remuneration. China Collective Economy, 26(28): 121-122. (in Chinese)

[103]
Xie H L, Wang W, 2015a. Exploring the spatial-temporal disparities of urban land use economic efficiency in China and its influencing factors under environmental constraints based on a sequential slacks-based model. Sustainability, 7(8): 10171-10190.

DOI

[104]
Xie H L, Wang W, 2015b. Spatiotemporal differences and convergence of urban industrial land use efficiency for China’s major economic zones. Journal of Geographical Sciences, 25(10): 1183-1198.

DOI

[105]
Xu C L, Cheng Y, 2016. The action of environmental regulation on industrial structure adjustment and atmospheric environment effect under the new normal in Shandong province. Journal of Natural Resources, 31(10): 1662-1674. (in Chinese)

[106]
Xu Q H, 2011. On deepening the reform of income distribution system. Truth Seeking, 53(12): 44-46. (in Chinese)

[107]
Xu Y, Duan J, Xu X R, 2018. Comprehensive methods for measuring regional multidimensional development and their applications in China. Journal of Geographical Sciences, 28(8): 1182-1196.

DOI

[108]
Xuan C, Nakamura R, 2013. Study on the regional disparity of technical efficiency in China’s cities. Economic Survey, 30(3): 14-19.

[109]
Xue R, Su Q Y, 2014. The upgrading direction of China’s labor intensive industries. Economic Research Guide, 10(6): 50-52. (in Chinese)

[110]
Yan Y R, Li H P, Liu Z D, 2017. Study on the spatial and temporal differentiation urban economic efficiency and its influencing factors in China. Urban Development Studies, 24(9): 42-48. (in Chinese)

[111]
Yang J P, Gao L, 2014. DEA’s CCR model for evaluation of urban infrastructure investment efficiency of Shaanxi province. Applied Mechanics and Materials, 685: 424-428.

DOI

[112]
Yang R P, Ao X B, 2014. Study on the relationship between the fiscal expenditure and economic growth: An empirical analysis based on the theory of cointegration. On Economic Problems, 36(10): 21-24. (in Chinese)

DOI

[113]
Yao L, 2016. Analysis on the causes and countermeasures of the low proportion of labor remuneration in GDP in China. Business, 12(17): 63. (in Chinese)

[114]
Ye K Z, 2010. Low income will lead to labor value crisis. Theory Study, 26(7): 44-45. (in Chinese)

[115]
Yin K, Wang R S, An Q X, et al., 2014. Using eco-efficiency as an indicator for sustainable urban development: A case study of Chinese provincial capital cities. Ecological Indicators, 36: 665-671.

DOI

[116]
Yin S, Yin Q J, 2013. To explore the trend of Yangtze River Delta labor-intensive industries to shift to the inner land in China. Reformation and Strategy, 29(10): 79-82. (in Chinese)

[117]
Young A, 2000. Gold into base metals: productivity growth in the People’s Republic of China during the reform period. Journal of Political Economy, 111(6): 1220-1261.

DOI

[118]
Yu L P, Zhou S D, Wang A M, 2006. Research on economic efficiencies of Chinese cities. Chinese Journal of Population Science, 20(4): 51-56. (in Chinese)

[119]
Zeng J, Fang Y Y, 2014. Between poverty and prosperity: China’s dependent development and the ‘middle-income trap’. Third World Quarterly, 35(6): 1014-1031.

DOI

[120]
Zeng P, Chen F, 2013. A comparative study on the characteristics of hierarchical scale structure of ten urban agglomerations in China. Science and Technology Progress and Policy, 30(5): 42-46. (in Chinese)

[121]
Zhan J Y, Zhang F, Jia S Q, et al., 2018. Spatial pattern of regional urbanization efficiency: An empirical study of Shanghai. Computational Economics, 52(4): 1277-1291.

DOI

[122]
Zhang B, 2016. Research on the impact of temporary fiscal expenditure on economic growth under the background of financial crisis[D]. Kunming: Yunnan University of Finance and Economics. (in Chinese)

[123]
Zhang D H, 2016. Efficiency estimation and influencing factors of China’s urbanization process. Journal of Chongqing Technology and Business University (Social Science Edition), 33(2): 8-14. (in Chinese)

[124]
Zhang H O, Ye Y Y, Yang L J, et al., 2008. Construction land expansion and its contribution to economic growth since reform and opening up in Guangdong province. Economic Geography, 28(6): 904-908. (in Chinese)

[125]
Zhang J, Bu M L, Chen Z Y, 2012. The decreasing of labor-share in China’s manufacturing sector and its mechanism analysis. China Industrial Economics, 30(5): 57-69. (in Chinese)

[126]
Zhang J T, Liu J G, 2011. Urban efficiency and its spillover effects: Based on the analysis of 34 cities in northeast China. Economic Geography, 31(4): 578-583. (in Chinese)

[127]
Zhang M, Wong T C, Zhu H, 2016. Urban economic efficiency evaluation in China taking environmental factors into account. Mathematics in Practice and Theory, 46(7): 71-80. (in Chinese)

[128]
Zhang M D, Zhou L, Yang X, 2012. The time-space measurement of urbanization efficiency and provincial differences. Economic Geography, 32(10): 42-48. (in Chinese)

[129]
Zhang N, Zhou L, 2012. Reflection on the phenomenon of low wages of Chinese workers and countermeasures. In:Proceedings of the 22nd Annual Meeting of China Economic Law Research Association. Wuhan: China Economic Law Research Association and Wuhan University, 583-587. (in Chinese)

[130]
Zhang W J, Xu H Z, 2016. Exploring the causal relationship between carbon emissions and land urbanization quality in China using a panel data analysis. Environment, Development and Sustainability, 19: 1445-1462.

DOI

[131]
Zhang Z H, 1997. Perspective on the problem of local fiscal deficit in China. Journal of Central University of Finance and Economics, 17(9): 18-22. (in Chinese)

[132]
Zhang Z X, Wen Q K, Liu F, et al., 2016. Urban expansion in China and its effect on cultivated land before and after initiating “Reform and Open Policy”. Science China Earth Sciences, 59(10): 1930-1945.

DOI

[133]
Zhang Z Y, 2014. Research on the low proportion of residents’ income in national income distribution. Management Observer, 34(27): 67-69. (in Chinese)

[134]
Zhao C W, 2015. How to look at the current economic situation in Northeast China. People’s Tribune, 24(24): 20-22. (in Chinese)

[135]
Zhao W L, Zhao D X, 2012. The main problems and countermeasures of China’s urbanization acceleration period. Journal of Hebei Youth Administrative Cadres College, 24(4): 34-36. (in Chinese)

[136]
Zhao Y J, 2008. The analysis about the cause and moving of the Inner Mongolia Autonomous Region’s economic barycenter[D]. Hohhot: Inner Mongolia University. (in Chinese)

[137]
Zhao Z, Bai Y P, Wang G F, et al., 2018. Land eco-efficiency for new-type urbanization in the Beijing-Tianjin-Hebei region. Technological Forecasting & Social Change, 137: 19-26.

[138]
Zheng H L, Liu Z M, Lu L L, 2018. Linkage analysis of employment structure, industrial structure and economic growth in Hebei Province. Areal Research and Development, 37(2): 63-68. (in Chinese)

[139]
Zhu T, Gao S, 2014. Promoting circular development and recycling solid waste: In the view of ecological civilization construction. Advanced Materials Research, 878: 873-878.

DOI

[140]
Zhuoma G R, Wu C F, 2014. Study on intercity differences of Chinese urban economic efficiency and its spatial-temporal characteristics: Based on 273 cities at prefecture level or above in China. Advanced Materials Research, 962-965: 2185-2190.

Outlines

/