
Journal of Geographical Sciences >
Differences and dynamics of multidimensional poverty in rural China from multiple perspectives analysis
|
Wang Bingbing (1995-), PhD, specialized in rural vitalization and poverty alleviation. E-mail: wangbing118@zju.edu.cn |
Received date: 2022-01-07
Accepted date: 2022-05-17
Online published: 2022-09-25
Supported by
National Natural Science Foundation of China(41771141)
Program of Philosophy and Social Science of Henan Province(2021BJJ002)
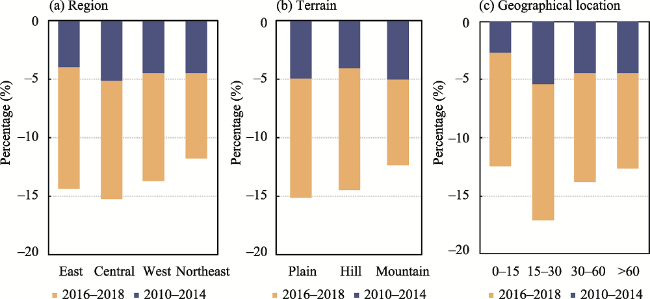
Absolute poverty was completely eliminated in China in 2020. However, poverty measured by income does not fully reflect the actual situation. This paper analyses multidimensional poverty and its dynamics in rural China from perspectives of region, terrain, and geographical location during 2010-2018. We use the Chinese Family Panel Survey data, adopt the Alkire-Foster method and improve the multidimensional poverty index (MPI), calculating and comparing multidimensional poverty and its dynamics among 3009 rural households. In addition, the contribution of the indicator to multidimensional poverty is decomposed. The results indicate that multidimensional poverty has obvious regional differences, topographical differences, and geographical differences. Moreover, the targeted poverty alleviation policy has a significant impact on multidimensional poverty eradication, and the rate of decline of the MPI during 2016-2018 is significantly greater than that of 2010-2014. Education contributes more than 50% to the MPI. In general, the proportion of households with persistent multidimensional poverty is higher than temporary multidimensional poverty, and temporary multidimensional poverty is higher than no multidimensional poverty. These results obtained from a large scale, long time and multiple perspectives could offer new insights for the government to further consolidate the results of poverty alleviation while offering China’s experience to other developing countries.
WANG Bingbing , LUO Qing , CHEN Guangping , ZHANG Zhe , JIN Pingbin . Differences and dynamics of multidimensional poverty in rural China from multiple perspectives analysis[J]. Journal of Geographical Sciences, 2022 , 32(7) : 1383 -1404 . DOI: 10.1007/s11442-022-2002-9
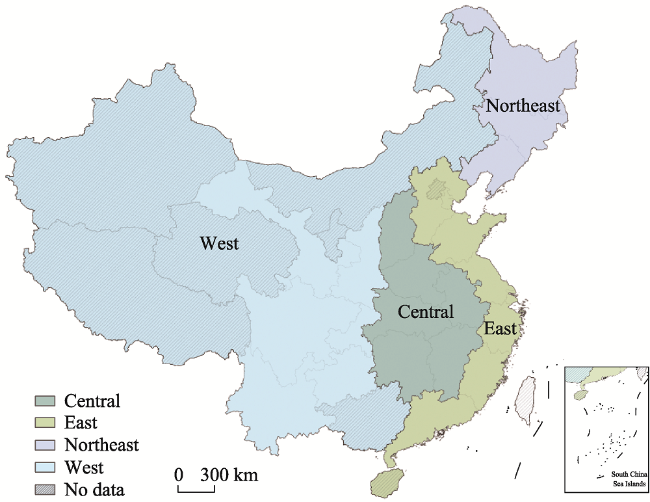
Figure 1 Map of regional divisions and locations in China |
Table 1 Distribution of household samples in China Family Panel Studies from 2010 to 2018 |
| Region | Provinces, autonomous regions and municipalities | County | Village | Household |
|---|---|---|---|---|
| East | Tianjin | 1 | 1 | 377 |
| Hebei | 7 | 21 | 23 | |
| Shanghai | 3 | 3 | 13 | |
| Jiangsu | 3 | 3 | 220 | |
| Zhejiang | 3 | 5 | 567 | |
| Fujian | 2 | 4 | 81 | |
| Shandong | 7 | 17 | 212 | |
| Guangdong | 10 | 25 | 32 | |
| Central | Shanxi | 6 | 17 | 192 |
| Anhui | 3 | 5 | 47 | |
| Jiangxi | 3 | 9 | 62 | |
| Henan | 13 | 34 | 97 | |
| Hubei | 2 | 3 | 53 | |
| Hunan | 4 | 7 | 46 | |
| West | Guangxi | 3 | 8 | 84 |
| Chongqing | 1 | 3 | 316 | |
| Sichuan | 6 | 12 | 25 | |
| Guizhou | 5 | 11 | 130 | |
| Yunnan | 4 | 11 | 149 | |
| Shaanxi | 2 | 6 | 63 | |
| Gansu | 16 | 47 | 37 | |
| Northeast | Liaoning | 10 | 23 | 45 |
| Jilin | 3 | 5 | 116 | |
| Heilongjiang | 3 | 5 | 22 |
Table 2 The components and indicators of the multidimensional poverty index |
| Dimension | Indicator | Deprivation threshold | Weight |
|---|---|---|---|
| Economy | Per capita income | The family’s annual per capita income is less than 2300 yuan1(1Price adjusted calculation was made for family’s per capita income from 2012 to 2018, using 2010 as the base period), assigned a value of 1, otherwise it is 0. | 1/4 |
| Education | Years of education | The average years of education of the family over 16 years old is less than 9, assigned a value of 1, otherwise it is 0. | 1/4 |
| Health | Chronic diseases | If there is a chronic disease among family members, the value is 1, otherwise it is 0. | 1/8 |
| Self-rated health | There are health self-assessments among family members, “Unhealthy”, “Relatively unhealthy” and “Very unhealthy” assigned a value of 1, otherwise it is 0. | 1/8 | |
| Living standard | Cooking fuel | Household cooking fuel is mainly non-clean energy such as firewood and coal, assigned a value of 1, otherwise it is 0. | 1/12 |
| Housing type | Family housing is not a house type such as “bungalows”, “unit houses”, “small buildings”, “villas”, “townhouses and courtyard houses”, assigned the value is 1, otherwise it is 0 | 1/12 | |
| Drinking water | Drinking water types are “river and lake water”, “rain water”, “pond water” and “cellar water”, etc. The clean water sources are not available, assigned a value of 1, otherwise it is 0. | 1/12 |
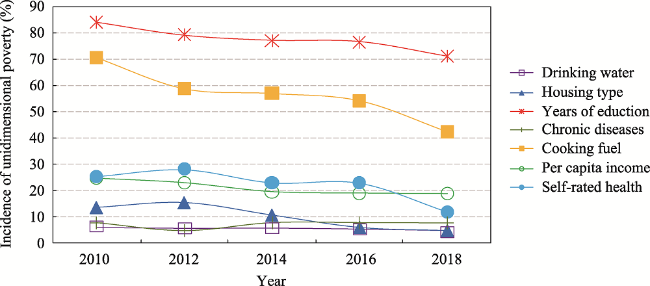
Figure 2 The incidence of unidimensional poverty in rural households from 2010 to 2018 |
Table 3 The multidimensional poverty in rural households from 2010 to 2018 |
| Year | k | 0.3 | 0.4 | 0.5 | 0.6 | 0.7 | 0.8 |
|---|---|---|---|---|---|---|---|
| 2010 | H (%) | 72.0 | 43.0 | 28.0 | 13.0 | 9.1 | 2.0 |
| A | 0.48 | 0.57 | 0.64 | 0.73 | 0.76 | 0.85 | |
| M0 | 0.34 | 0.25 | 0.18 | 0.09 | 0.07 | 0.02 | |
| 2012 | H (%) | 65.9 | 38.9 | 24.2 | 10.5 | 6.8 | 0.9 |
| A | 0.47 | 0.56 | 0.62 | 0.72 | 0.75 | 0.87 | |
| M0 | 0.31 | 0.22 | 0.15 | 0.08 | 0.05 | 0.01 | |
| 2014 | H (%) | 61.4 | 34.0 | 21.8 | 8.5 | 5.1 | 0.9 |
| A | 0.46 | 0.55 | 0.62 | 0.71 | 0.75 | 0.87 | |
| M0 | 0.28 | 0.19 | 0.13 | 0.06 | 0.04 | 0.01 | |
| 2016 | H (%) | 58.9 | 31.4 | 20.5 | 7.5 | 4.6 | 1.1 |
| A | 0.46 | 0.56 | 0.61 | 0.72 | 0.76 | 0.86 | |
| M0 | 0.27 | 0.17 | 0.13 | 0.05 | 0.04 | 0.01 | |
| 2018 | H (%) | 48.5 | 23.6 | 18.3 | 5.4 | 3.5 | 0.9 |
| A | 0.45 | 0.56 | 0.60 | 0.72 | 0.76 | 0.85 | |
| M0 | 0.22 | 0.13 | 0.11 | 0.04 | 0.03 | 0.01 |
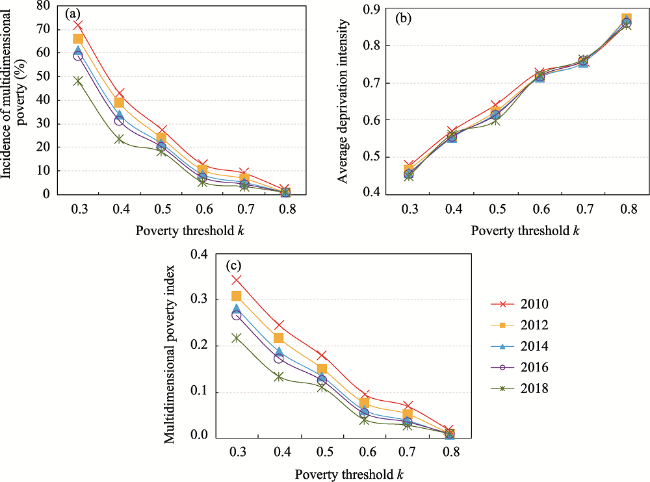
Figure 3 The multidimensional poverty in rural households from 2010 to 2018 |
Table 4 Classification of data according to terrain and geographical location of China |
| Region | Terrain | Geographical location (mins) | |||||
|---|---|---|---|---|---|---|---|
| Plain | Hill | Mountain | 0-15 | 15-30 | 30-60 | >60 | |
| East | 375 | 286 | 58 | 75 | 183 | 358 | 103 |
| Central | 463 | 231 | 96 | 56 | 274 | 330 | 130 |
| West | 117 | 517 | 443 | 39 | 211 | 253 | 574 |
| Northeast | 180 | 192 | 51 | 41 | 63 | 220 | 99 |
| China | 1135 | 1226 | 648 | 211 | 731 | 1161 | 906 |
Table 5 The multidimensional poverty of different regions from 2010 to 2018 |
| Region | 2010 | 2012 | 2014 | 2016 | 2018 | Average | |
|---|---|---|---|---|---|---|---|
| H (%) | East | 57.6 | 53.1 | 49.1 | 44.7 | 36.4 | 48.2 |
| Central | 69.2 | 58.6 | 56.1 | 53.0 | 40.8 | 55.6 | |
| West | 84.5 | 78.7 | 74.4 | 72.6 | 61.4 | 74.3 | |
| Northeast | 69.7 | 68.8 | 59.3 | 58.9 | 50.6 | 61.5 | |
| A | East | 0.46 | 0.46 | 0.46 | 0.45 | 0.44 | 0.45 |
| Central | 0.46 | 0.47 | 0.45 | 0.46 | 0.47 | 0.46 | |
| West | 0.51 | 0.48 | 0.47 | 0.46 | 0.44 | 0.47 | |
| Northeast | 0.44 | 0.42 | 0.42 | 0.44 | 0.44 | 0.43 | |
| M0 | East | 0.27 | 0.24 | 0.22 | 0.20 | 0.16 | 0.22 |
| Central | 0.32 | 0.28 | 0.25 | 0.24 | 0.19 | 0.26 | |
| West | 0.43 | 0.38 | 0.35 | 0.33 | 0.27 | 0.35 | |
| Northeast | 0.30 | 0.29 | 0.25 | 0.26 | 0.22 | 0.26 |
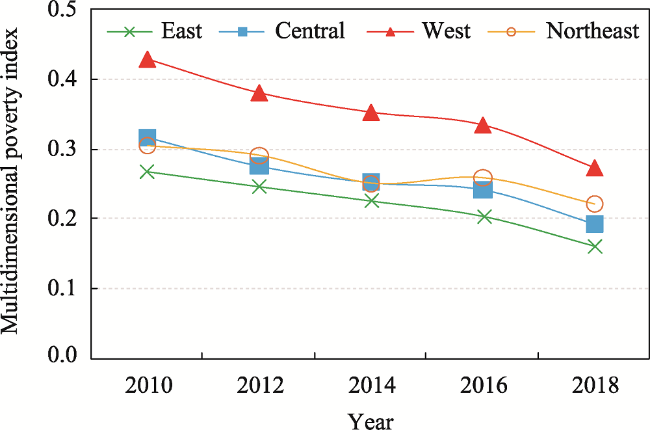
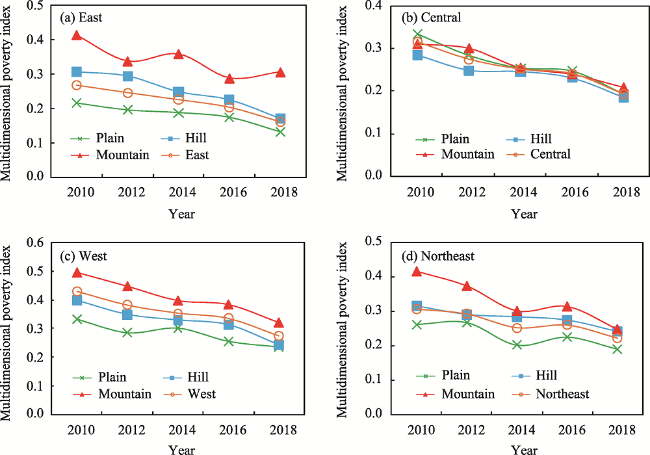
Figure 4 The multidimensional poverty index of rural households in different regions of China during 2010-2018 |
Table 6 The multidimensional poverty of different terrains in 2010-2018 |
| Terrain | 2010 | 2012 | 2014 | 2016 | 2018 | Average | |
|---|---|---|---|---|---|---|---|
| H (%) | Plain | 63.1 | 55.6 | 50.7 | 49.6 | 38.5 | 51.5 |
| Hill | 73.1 | 67.8 | 64.1 | 59.8 | 49.0 | 62.8 | |
| Mountain | 88.8 | 83.7 | 77.0 | 75.0 | 65.9 | 78.1 | |
| A | Plain | 0.45 | 0.45 | 0.45 | 0.44 | 0.45 | 0.45 |
| Hill | 0.48 | 0.46 | 0.45 | 0.46 | 0.44 | 0.46 | |
| Mountain | 0.52 | 0.50 | 0.48 | 0.47 | 0.45 | 0.48 | |
| M0 | Plain | 0.28 | 0.25 | 0.23 | 0.22 | 0.17 | 0.23 |
| Hill | 0.35 | 0.31 | 0.29 | 0.27 | 0.22 | 0.29 | |
| Mountain | 0.46 | 0.41 | 0.37 | 0.35 | 0.30 | 0.38 |
Figure 5 The multidimensional poverty index of different regions of China from 2010 to 2018 |
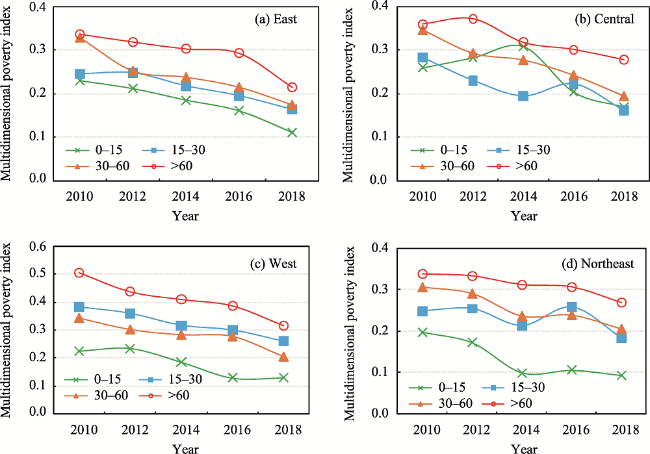
Table 7 The multidimensional poverty in different geographical locations during 2010-2018 |
| Geographical location (mins) | 2010 | 2012 | 2014 | 2016 | 2018 | Average | |
|---|---|---|---|---|---|---|---|
| H (%) | 0-15 | 60.3 | 59.6 | 52.6 | 48.7 | 38.5 | 51.9 |
| 15-30 | 65.0 | 56.7 | 51.3 | 52.1 | 39.8 | 53.0 | |
| 30-60 | 69.0 | 61.9 | 58.0 | 53.9 | 43.3 | 57.2 | |
| >60 | 85.8 | 81.8 | 76.5 | 73.7 | 64.5 | 76.5 | |
| A | 0-15 | 0.45 | 0.45 | 0.46 | 0.44 | 0.44 | 0.45 |
| 15-30 | 0.46 | 0.47 | 0.45 | 0.45 | 0.46 | 0.46 | |
| 30-60 | 0.46 | 0.45 | 0.45 | 0.44 | 0.45 | 0.45 | |
| >60 | 0.52 | 0.48 | 0.48 | 0.47 | 0.45 | 0.48 | |
| M0 | 0-15 | 0.27 | 0.27 | 0.24 | 0.21 | 0.17 | 0.23 |
| 15-30 | 0.30 | 0.27 | 0.23 | 0.24 | 0.18 | 0.24 | |
| 30-60 | 0.31 | 0.28 | 0.26 | 0.24 | 0.19 | 0.26 | |
| >60 | 0.44 | 0.40 | 0.36 | 0.34 | 0.29 | 0.37 |
Figure 6 The multidimensional poverty index of geographical locations in different regions during 2010-2018 |
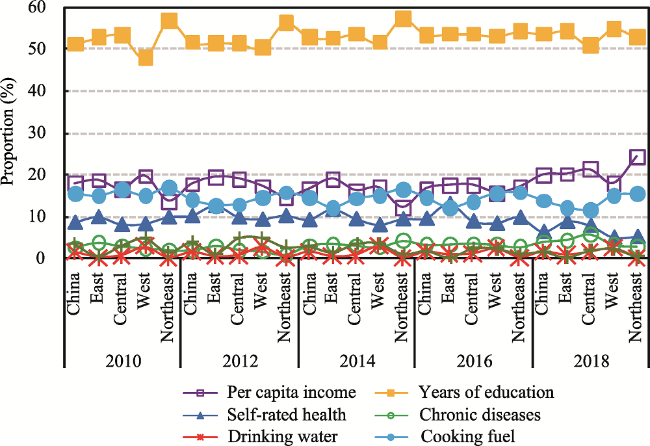
Figure 7 The contribution rate of indicators to the multidimensional poverty index in different regions of China during 2010-2018 |
Figure 8 The relative changes in the multidimensional poverty index from 2010-2014 and 2016-2018 |
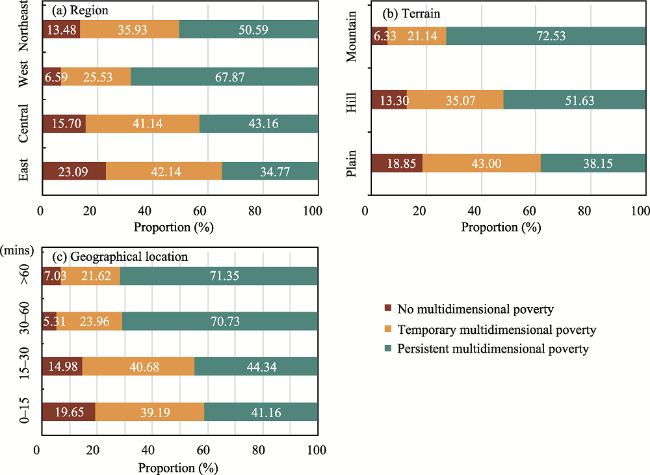
Figure 9 The proportion of dynamic multidimensional poverty in 2010-2018 |
Appendix Appendix Table 1 The multidimensional poverty of different terrains in eastern China during 2010-2018 |
| Terrain | 2010 | 2012 | 2014 | 2016 | 2018 | |
|---|---|---|---|---|---|---|
| H (%) | Plain | 47.7 | 42.9 | 40.8 | 40.0 | 30.4 |
| Hill | 64.0 | 62.2 | 54.6 | 46.5 | 38.8 | |
| Mountain | 89.7 | 74.1 | 75.9 | 65.5 | 63.8 | |
| East | 57.6 | 53.1 | 49.1 | 44.7 | 36.4 | |
| A | Plain | 0.45 | 0.45 | 0.46 | 0.43 | 0.43 |
| Hill | 0.48 | 0.47 | 0.45 | 0.48 | 0.44 | |
| Mountain | 0.46 | 0.45 | 0.47 | 0.44 | 0.48 | |
| East | 0.46 | 0.46 | 0.46 | 0.45 | 0.44 | |
| M0 | Plain | 0.21 | 0.19 | 0.19 | 0.17 | 0.13 |
| Hill | 0.30 | 0.29 | 0.25 | 0.22 | 0.17 | |
| Mountain | 0.41 | 0.34 | 0.36 | 0.29 | 0.31 | |
| East | 0.27 | 0.24 | 0.22 | 0.20 | 0.16 |
Appendix Appendix Table 2 The multidimensional poverty of different terrains in central China during 2010-2018 |
| Terrain | 2010 | 2012 | 2014 | 2016 | 2018 | |
|---|---|---|---|---|---|---|
| H (%) | Plain | 73.2 | 60.0 | 57.0 | 53.8 | 40.0 |
| Hill | 62.3 | 54.1 | 55.4 | 52.0 | 41.1 | |
| Mountain | 66.7 | 62.5 | 53.1 | 52.1 | 43.8 | |
| Central | 69.2 | 58.6 | 56.1 | 53.0 | 40.8 | |
| A | Plain | 0.46 | 0.47 | 0.45 | 0.46 | 0.48 |
| Hill | 0.46 | 0.46 | 0.45 | 0.45 | 0.45 | |
| Mountain | 0.47 | 0.48 | 0.48 | 0.46 | 0.48 | |
| Central | 0.46 | 0.47 | 0.45 | 0.46 | 0.47 | |
| M0 | Plain | 0.33 | 0.28 | 0.25 | 0.25 | 0.19 |
| Hill | 0.29 | 0.25 | 0.25 | 0.23 | 0.18 | |
| Mountain | 0.31 | 0.30 | 0.26 | 0.24 | 0.21 | |
| Central | 0.32 | 0.28 | 0.25 | 0.24 | 0.19 |
Appendix Appendix Table 3 The multidimensional poverty of different terrains in western China during 2010-2018 |
| Terrain | 2010 | 2012 | 2014 | 2016 | 2018 | |
|---|---|---|---|---|---|---|
| H (%) | Plain | 73.5 | 65.0 | 64.1 | 59.0 | 52.1 |
| Hill | 81.0 | 74.1 | 70.6 | 68.7 | 55.1 | |
| Mountain | 91.4 | 87.8 | 81.5 | 80.8 | 71.1 | |
| West | 84.5 | 78.7 | 74.4 | 72.6 | 61.4 | |
| A | Plain | 0.45 | 0.44 | 0.47 | 0.43 | 0.45 |
| Hill | 0.49 | 0.47 | 0.47 | 0.45 | 0.44 | |
| Mountain | 0.54 | 0.51 | 0.49 | 0.47 | 0.45 | |
| West | 0.51 | 0.48 | 0.47 | 0.46 | 0.44 | |
| M0 | Plain | 0.33 | 0.28 | 0.30 | 0.25 | 0.23 |
| Hill | 0.40 | 0.35 | 0.33 | 0.31 | 0.24 | |
| Mountain | 0.49 | 0.45 | 0.40 | 0.38 | 0.32 | |
| West | 0.43 | 0.38 | 0.35 | 0.33 | 0.27 |
Appendix Appendix Table 4 The multidimensional poverty of different terrains in northeastern China during 2010-2018 |
| Terrain | 2010 | 2012 | 2014 | 2016 | 2018 | |
|---|---|---|---|---|---|---|
| H (%) | Plain | 62.8 | 65.0 | 47.2 | 53.9 | 45.0 |
| Hill | 70.8 | 68.2 | 67.2 | 61.5 | 54.7 | |
| Mountain | 90.2 | 84.3 | 72.6 | 66.7 | 54.9 | |
| Northeast | 69.7 | 68.8 | 59.3 | 58.9 | 50.6 | |
| A | Plain | 0.42 | 0.41 | 0.43 | 0.42 | 0.42 |
| Hill | 0.45 | 0.43 | 0.42 | 0.45 | 0.44 | |
| Mountain | 0.46 | 0.44 | 0.41 | 0.47 | 0.45 | |
| Northeast | 0.44 | 0.42 | 0.42 | 0.44 | 0.44 | |
| M0 | Plain | 0.26 | 0.27 | 0.20 | 0.22 | 0.19 |
| Hill | 0.32 | 0.29 | 0.28 | 0.28 | 0.24 | |
| Mountain | 0.42 | 0.37 | 0.30 | 0.31 | 0.25 | |
| Northeast | 0.30 | 0.29 | 0.25 | 0.26 | 0.22 |
Appendix Appendix Table 5 The multidimensional poverty of different geographical location in eastern China during 2010-2018 |
| Geographical location (mins) | 2010 | 2012 | 2014 | 2016 | 2018 | |
|---|---|---|---|---|---|---|
| H (%) | 0-15 | 52.2 | 47.9 | 41.7 | 36.8 | 25.8 |
| 15-30 | 56.7 | 53.6 | 48.5 | 43.7 | 38.8 | |
| 30-60 | 68.9 | 54.4 | 51.7 | 46.9 | 39.7 | |
| >60 | 70.7 | 66.7 | 62.7 | 61.3 | 48.0 | |
| A | 0-15 | 0.44 | 0.44 | 0.44 | 0.44 | 0.43 |
| 15-30 | 0.43 | 0.46 | 0.45 | 0.45 | 0.42 | |
| 30-60 | 0.48 | 0.46 | 0.46 | 0.46 | 0.44 | |
| >60 | 0.48 | 0.48 | 0.48 | 0.48 | 0.45 | |
| M0 | 0-15 | 0.23 | 0.21 | 0.18 | 0.16 | 0.11 |
| 15-30 | 0.24 | 0.25 | 0.22 | 0.20 | 0.16 | |
| 30-60 | 0.33 | 0.25 | 0.24 | 0.21 | 0.17 | |
| >60 | 0.34 | 0.32 | 0.30 | 0.29 | 0.21 |
Appendix Appendix Table 6 The multidimensional poverty of different geographical locations in central China in 2010-2018 |
| Geographical location (mins) | 2010 | 2012 | 2014 | 2016 | 2018 | |
|---|---|---|---|---|---|---|
| H (%) | 0-15 | 55.2 | 58.6 | 65.5 | 44.8 | 34.5 |
| 15-30 | 61.7 | 49.6 | 44.9 | 48.2 | 34.3 | |
| 30-60 | 75.5 | 63.0 | 61.5 | 54.6 | 41.5 | |
| >60 | 78.5 | 75.4 | 67.7 | 64.6 | 58.5 | |
| A | 0-15 | 0.47 | 0.48 | 0.47 | 0.46 | 0.49 |
| 15-30 | 0.46 | 0.47 | 0.44 | 0.46 | 0.47 | |
| 30-60 | 0.46 | 0.46 | 0.45 | 0.44 | 0.47 | |
| >60 | 0.46 | 0.49 | 0.47 | 0.47 | 0.48 | |
| M0 | 0-15 | 0.26 | 0.28 | 0.31 | 0.20 | 0.17 |
| 15-30 | 0.28 | 0.23 | 0.20 | 0.22 | 0.16 | |
| 30-60 | 0.35 | 0.29 | 0.28 | 0.24 | 0.19 | |
| >60 | 0.36 | 0.37 | 0.32 | 0.30 | 0.28 |
Appendix Appendix Table 7 The multidimensional poverty of different geographical locations in western China in 2010-2018 |
| Geographical location(mins) | 2010 | 2012 | 2014 | 2016 | 2018 | |
|---|---|---|---|---|---|---|
| H (%) | 0-15 | 48.7 | 53.9 | 38.5 | 30.8 | 28.2 |
| 15-30 | 80.6 | 72.0 | 67.3 | 66.4 | 56.9 | |
| 30-60 | 76.3 | 67.9 | 63.3 | 63.3 | 47.5 | |
| >60 | 93.1 | 88.2 | 84.4 | 82.0 | 71.1 | |
| A | 0-15 | 0.46 | 0.43 | 0.48 | 0.42 | 0.46 |
| 15-30 | 0.47 | 0.50 | 0.47 | 0.45 | 0.46 | |
| 30-60 | 0.45 | 0.45 | 0.45 | 0.44 | 0.43 | |
| >60 | 0.54 | 0.50 | 0.49 | 0.47 | 0.44 | |
| M0 | 0-15 | 0.22 | 0.23 | 0.18 | 0.13 | 0.13 |
| 15-30 | 0.38 | 0.36 | 0.32 | 0.30 | 0.26 | |
| 30-60 | 0.34 | 0.30 | 0.28 | 0.28 | 0.21 | |
| >60 | 0.51 | 0.44 | 0.41 | 0.39 | 0.32 |
Appendix Appendix Table 8 The multidimensional poverty of different geographical locations in northeastern China in 2010-2018 |
| Geographical location (mins) | 2010 | 2012 | 2014 | 2016 | 2018 | |
|---|---|---|---|---|---|---|
| H (%) | 0-15 | 46.2 | 38.5 | 15.4 | 30.8 | 23.1 |
| 15-30 | 60.7 | 59.0 | 50.8 | 60.7 | 42.6 | |
| 30-60 | 71.4 | 67.3 | 57.3 | 54.1 | 47.3 | |
| >60 | 72.7 | 82.8 | 73.7 | 70.7 | 62.6 | |
| A | 0-15 | 0.43 | 0.45 | 0.65 | 0.34 | 0.40 |
| 15-30 | 0.41 | 0.44 | 0.42 | 0.43 | 0.44 | |
| 30-60 | 0.43 | 0.43 | 0.41 | 0.44 | 0.44 | |
| >60 | 0.47 | 0.40 | 0.43 | 0.44 | 0.43 | |
| M0 | 0-15 | 0.20 | 0.17 | 0.10 | 0.11 | 0.09 |
| 15-30 | 0.25 | 0.26 | 0.22 | 0.26 | 0.19 | |
| 30-60 | 0.31 | 0.29 | 0.24 | 0.24 | 0.21 | |
| >60 | 0.34 | 0.34 | 0.31 | 0.31 | 0.27 |
Appendix Appendix Table 9 The contribution of indicator to the MPI during 2010-2018 (%) |
| Year | Region | Drinking water | Cooking fuel | Housing type | Per capita income | Years of education | Self-rated health | Chronic diseases |
|---|---|---|---|---|---|---|---|---|
| 2010 | China | 1.5 | 15.6 | 3.2 | 17.7 | 51.0 | 8.6 | 2.5 |
| East | 0.2 | 14.8 | 0.4 | 18.6 | 52.5 | 9.9 | 3.6 | |
| Central | 0.6 | 16.3 | 2.9 | 16.4 | 53.2 | 8.0 | 2.7 | |
| West | 2.7 | 14.9 | 4.7 | 19.6 | 47.7 | 8.2 | 2.2 | |
| Northeast | 0.1 | 16.9 | 1.2 | 13.6 | 56.5 | 9.9 | 1.8 | |
| 2012 | China | 1.4 | 13.9 | 3.7 | 17.7 | 51.4 | 10.2 | 1.7 |
| East | 0.3 | 12.6 | 0.9 | 19.3 | 51.3 | 12.7 | 2.8 | |
| Central | 0.7 | 12.8 | 4.7 | 18.9 | 51.2 | 9.9 | 1.9 | |
| West | 2.7 | 14.5 | 4.7 | 17.2 | 50.1 | 9.4 | 1.5 | |
| Northeast | 0.1 | 15.7 | 2.5 | 14.6 | 56.1 | 10.3 | 0.7 | |
| 2014 | China | 1.5 | 14.4 | 2.7 | 16.4 | 52.8 | 9.2 | 2.9 |
| East | 0.3 | 12.0 | 1.3 | 18.9 | 52.4 | 11.8 | 3.3 | |
| Central | 0.7 | 14.2 | 3.4 | 16.1 | 53.4 | 9.5 | 2.9 | |
| West | 2.9 | 15.0 | 3.5 | 16.8 | 51.4 | 8.0 | 2.5 | |
| Northeast | 0.1 | 16.5 | 0.9 | 12.0 | 57.1 | 9.4 | 4.0 | |
| 2016 | China | 1.5 | 14.5 | 1.6 | 16.5 | 53.3 | 9.6 | 3.1 |
| East | 0.8 | 12.0 | 0.1 | 17.4 | 53.4 | 13.2 | 3.2 | |
| Central | 1.1 | 13.6 | 2.2 | 17.4 | 53.4 | 8.9 | 3.4 | |
| West | 2.3 | 15.6 | 2.2 | 15.6 | 52.9 | 8.4 | 3.1 | |
| Northeast | 0.2 | 15.6 | 0.9 | 16.9 | 54.0 | 9.8 | 2.5 | |
| 2018 | China | 1.5 | 13.7 | 1.4 | 19.8 | 53.4 | 6.3 | 3.8 |
| East | 0.7 | 12.0 | 0.1 | 20.0 | 54.1 | 8.8 | 4.2 | |
| Central | 1.5 | 11.5 | 1.7 | 21.0 | 50.8 | 7.9 | 5.6 | |
| West | 2.4 | 15.0 | 2.1 | 17.8 | 54.7 | 4.9 | 3.1 | |
| Northeast | 0.0 | 15.3 | 0.2 | 24.2 | 52.6 | 5.1 | 2.7 |
| [1] |
|
| [2] |
|
| [3] |
|
| [4] |
|
| [5] |
|
| [6] |
|
| [7] |
|
| [8] |
|
| [9] |
|
| [10] |
|
| [11] |
|
| [12] |
|
| [13] |
|
| [14] |
|
| [15] |
|
| [16] |
|
| [17] |
|
| [18] |
|
| [19] |
|
| [20] |
|
| [21] |
|
| [22] |
|
| [23] |
|
| [24] |
|
| [25] |
|
| [26] |
|
| [27] |
|
| [28] |
|
| [29] |
|
| [30] |
|
| [31] |
|
| [32] |
|
| [33] |
|
| [34] |
|
| [35] |
|
| [36] |
|
| [37] |
|
| [38] |
|
| [39] |
|
| [40] |
|
| [41] |
|
| [42] |
|
| [43] |
|
| [44] |
|
/
| 〈 |
|
〉 |