
Journal of Geographical Sciences >
Analyzing space-time evolution of rural transition in a rapidly urbanizing region: A case study of Suzhou, China
|
Zhang Ruoyan (1994-), PhD Candidate, specialized in economic geography and regional development, urban management and administrative division. E-mail: zry.3366@163.com |
Received date: 2021-12-30
Accepted date: 2022-04-26
Online published: 2022-09-25
Supported by
National Social Science Foundation of China(21FSHB014)
National Natural Science Foundation of China(42001196)
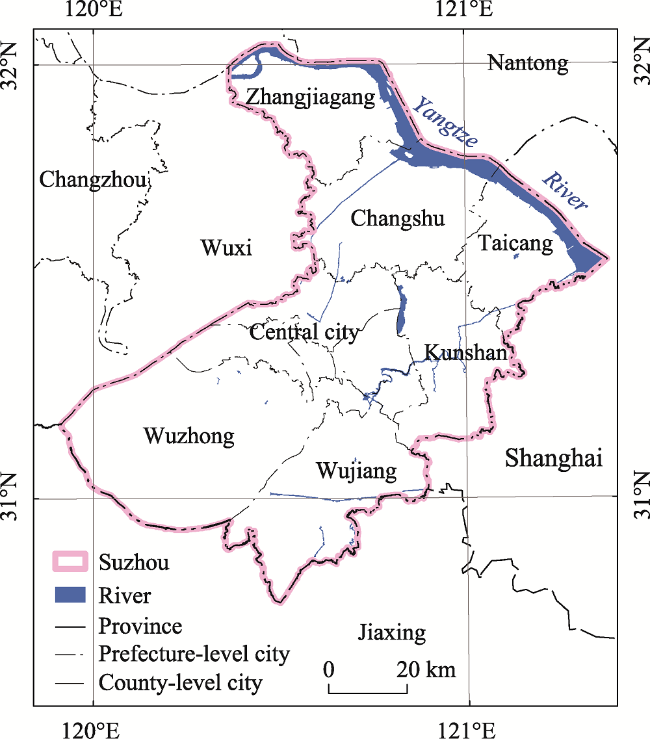
Influenced by globalization, rural transition in developed Western countries has experienced processes of productivism, post-productivism, and multifunctional development. By contrast, rural transition in most developing countries has been accompanied by rapid urbanization, which has become a core topic in geography research. As the world’s largest developing country, China has undergone profound development since the reform and opening-up. Moreover, rural spaces in some eastern coastal areas have entered the stage of reconstruction after decades of industrialization and urbanization. This paper takes Suzhou as the case area and measures the process of rural transition from 1990 to 2015 by constructing an index system. It then analyzes the characteristics of space-time evolution using exploratory spatial data analysis (ESDA) methods to reveal the influence of economic and social development on rural transition. The results show that rural transition, which generally entails the weakening of rurality and enhancing of urbanity on a macro scale, tends to be heterogeneous across different regions on a micro scale. This paper argues that multifunctionality will be the main future trend of rural transition in rapidly urbanizing areas. The experience in Suzhou could provide an example for establishing policies on sustainable development in rural spaces and achieving urban-rural co-governance.
ZHANG Ruoyan , LI Hongbo , YUAN Yuan . Analyzing space-time evolution of rural transition in a rapidly urbanizing region: A case study of Suzhou, China[J]. Journal of Geographical Sciences, 2022 , 32(7) : 1343 -1356 . DOI: 10.1007/s11442-022-2000-y
Figure 1 Location of Suzhou |
Table 1 Index system for measuring the rural transition in Suzhou |
| Number | Indicator (unit) | Explanation |
|---|---|---|
| RI-1 | Proportion of primary industry (%) | Proportion of primary industry in gross domestic product |
| RI-2 | Per capita cultivated area (mu) | Cultivated land area divided by year-end population |
| RI-3 | Per capita grain output (kg) | Total grain output divided by year-end population |
| RI-4 | Power of agricultural machinery (kW/ha) | Ratio of farm machinery to sowing areas |
| RI-5 | Proportion of sown areas of non-farm crops (%) | Proportion of non-grains in the sowing area of crops |
| RI-6 | Per capita output of aquatic products (kg) | Output of aquatic products divided by year-end population |
| UI-1 | Proportion of secondary industry (%) | Proportion of secondary industry in gross domestic product |
| UI-2 | Proportion of tertiary industry (%) | Proportion of tertiary industry in gross domestic product |
| UI-3 | Proportion of employed population (%) | Employees in TVEs divided by year-end population |
| UI-4 | Per capita pre-tax profits of TVEs (yuan) | Profits and taxes of TVEs divided by year-end population |
| UI-5 | Per capita rural electricity consumption (kWh) | Rural electricity consumption divided by year-end population |
| UI-6 | Per capita net rural income (yuan) | Per capita net income of rural residents |
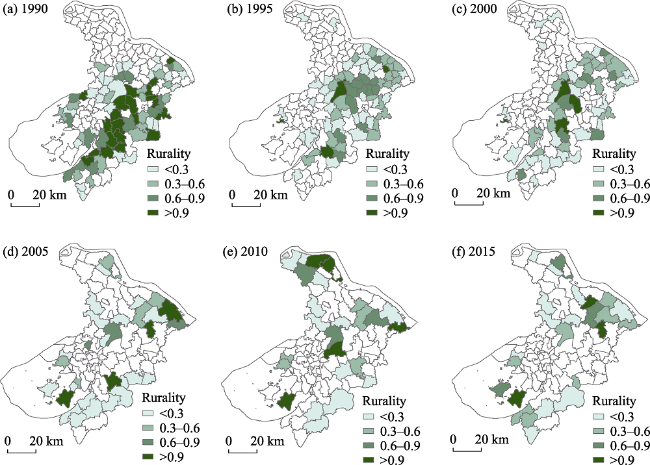
Figure 2 Rurality index changes in Suzhou (1990-2015) |
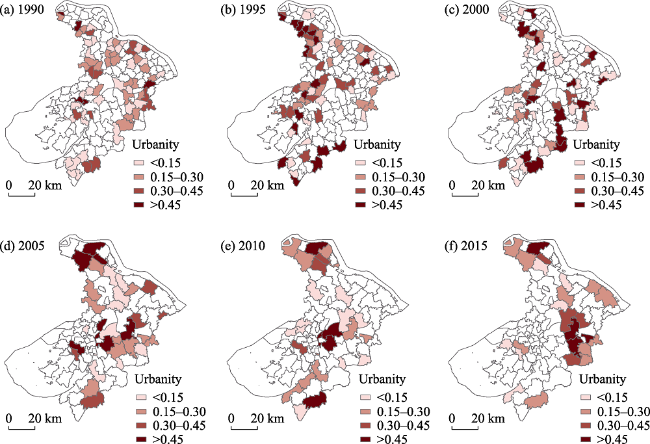
Figure 3 Urbanity index changes in Suzhou (1990-2015) |
Table 2 Spatial autocorrelation dynamics in Suzhou’s rural transition (1990-2015) |
| Year | Rurality | Urbanity | ||||
|---|---|---|---|---|---|---|
| Spatial attribute | Moran’s I | Z-value | Spatial attribute | Moran’s I | Z-value | |
| 1990 | Clustered | 0.5049 | 12.6618*** (0.0000) | Clustered | 0.1992 | 5.1139*** (0.0000) |
| 1995 | Clustered | 0.3760 | 5.3200*** (0.0000) | Clustered | 0.2015 | 3.0005*** (0.0027) |
| 2000 | Clustered | 0.2631 | 5.8226*** (0.0000) | Clustered | 0.0823 | 1.9424* (0.0521) |
| 2005 | Random | 0.0833 | 1.0870 (0.2770) | Random | 0.1122 | 1.4333 (0.1518) |
| 2010 | Random | 0.0673 | 0.8392 (0.4014) | Random | -0.0010 | 0.1650 (0.8690) |
| 2015 | Clustered | 0.2888 | 2.7640*** (0.0057) | Clustered | 0.3321 | 3.1916*** (0.0014) |
Note: ***, **, and * represent statistical significance at the 1%, 5%, and 10% levels, respectively. |
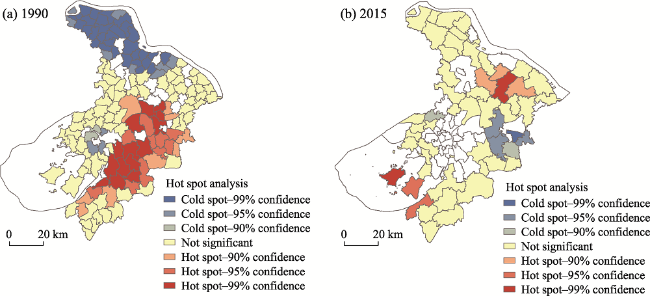
Figure 4 Hot-spot analysis of the rurality index in Suzhou |
Figure 5 Hot-spot analysis of the urbanity index in Suzhou |
| [1] |
|
| [2] |
|
| [3] |
|
| [4] |
|
| [5] |
|
| [6] |
|
| [7] |
|
| [8] |
|
| [9] |
|
| [10] |
|
| [11] |
|
| [12] |
|
| [13] |
|
| [14] |
|
| [15] |
|
| [16] |
|
| [17] |
|
| [18] |
|
| [19] |
|
| [20] |
|
| [21] |
|
| [22] |
|
| [23] |
|
| [24] |
|
| [25] |
|
| [26] |
|
| [27] |
|
| [28] |
|
| [29] |
|
| [30] |
|
| [31] |
|
| [32] |
|
| [33] |
|
| [34] |
|
| [35] |
|
| [36] |
|
| [37] |
|
| [38] |
|
| [39] |
|
| [40] |
|
| [41] |
|
| [42] |
|
| [43] |
|
| [44] |
|
/
| 〈 |
|
〉 |
