
Journal of Geographical Sciences >
Structure and governance model of rural social space quality: A case study of Longxi County in the Loess Hilly Area of China
|
Wu Shanshan (1997-), PhD Candidate, specialized in rural settlements and social space. E-mail: 1026991397@qq.com |
Received date: 2021-10-15
Accepted date: 2022-02-15
Online published: 2022-09-25
Supported by
National Natural Science Foundation of China(41961033)
Natural Science Foundation of Gansu Province(20JR5RA519)
The Graduate Research Funding Project of Northwest Normal University in 2021(2021KYZZ01039)
The rural social space quality is an important indicator to measure the living standard and thinking ideas and so forth of rural residents in a certain region. In this paper, 213 administrative villages in Longxi County of the Loess Hilly Area, China are taken as evaluation units to construct the evaluation model of the rural social space quality. This paper deeply analyzed the variation patterns and their formation mechanism of the rural social space quality at a village scale, and proposed a governance model based on the rural social space quality. The results show that: (1) the social space quality levels of individual administrative villages show a gradually decreasing trend from the township seats to outward. The eastern part of Longxi County has a relatively high education level and living standard, and the western part has a relatively high population stability level and income level. (2) The rural social space quality is mainly in a ring structure, supplemented by the interlaced structure. The core area is the towns and their surrounding areas, while the transition area, marginal area, and other areas are expanded around the core area. (3) Social forces and spatial effects jointly shape the variation of the rural social space quality. Social organizations provide a driving force for the allocation of elements, and interweaving with the spatial effects lead to the differences in the social space quality. (4) The governance models of the rural social space quality are constructed based on the principles of retaining the rural “people”, optimizing the rural “land”, and developing the rural “industry”, so as to improve the rural centripetal force, core force, inner thrust, and source power.
WU Shanshan , MA Libang , TAO Tianmin , DOU Haojian . Structure and governance model of rural social space quality: A case study of Longxi County in the Loess Hilly Area of China[J]. Journal of Geographical Sciences, 2022 , 32(7) : 1297 -1320 . DOI: 10.1007/s11442-022-1998-1
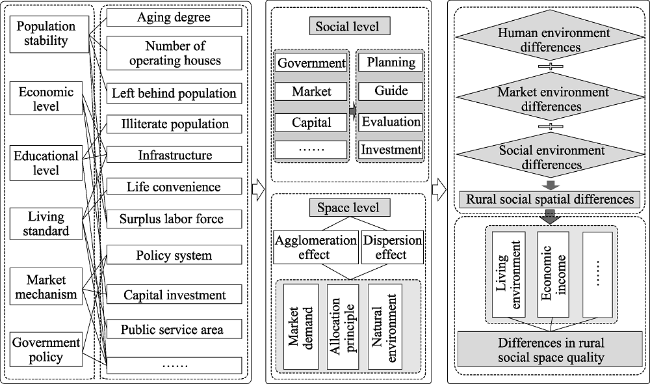
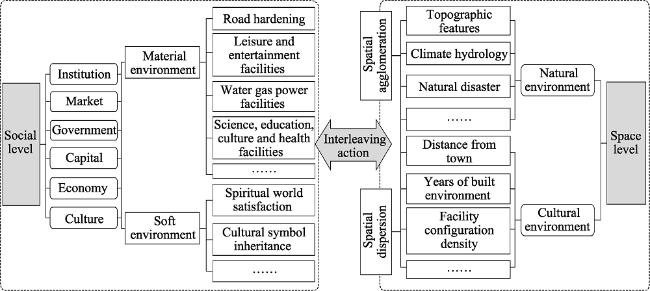
Figure 1 Conceptual framework of the rural social space quality |
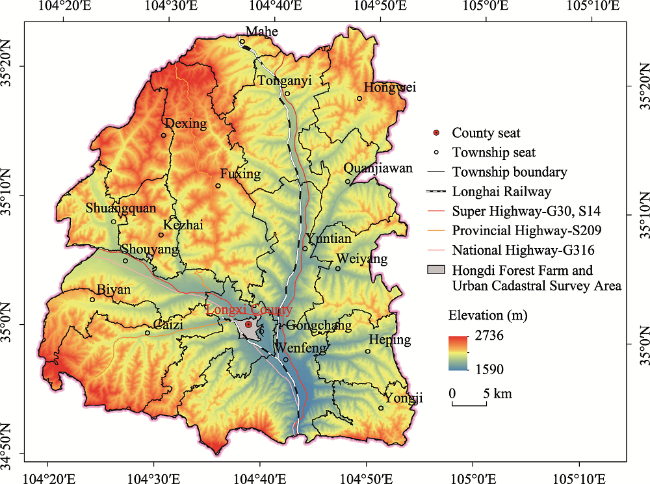
Figure 2 Location of Longxi County, Gansu Province, China |
Table 1 Comprehensive evaluation index system of the rural social space quality |
| Evaluation subsystem | Subsystem weight | Representative evaluation index | Index weight | Action direction |
|---|---|---|---|---|
| Population stability level (Q1) | 0.2369 | Proportion of migrant workers, X1 (%) | 0.1328 | - |
| Proportion of migrant workers who have worked for more than one year, X2 (%) | 0.1275 | - | ||
| Aging degree, X3 (%) | 0.0533 | - | ||
| Proportion of self-built houses used for operation, X4 (%) | 0.5864 | + | ||
| Proportion of left-behind children, women and the elderly, X5 (%) | 0.1000 | - | ||
| Education level (Q2) | 0.2217 | Proportion of illiterates, X6 (%) | 0.1136 | - |
| Proportion of people with high school education and below, X7 (%) | 0.3097 | - | ||
| Proportion of people with junior college education and above, X8 (%) | 0.5767 | + | ||
| Living standard (Q3) | 0.3765 | Road hardening degree, X9 (%) | 0.0948 | + |
| Number of express outlets per 100 people, X10 (Quantity/100 persons) | 0.1874 | + | ||
| Proportion of broadband coverage households, X11 (%) | 0.0905 | + | ||
| Number of garbage collection facilities per 100 people, X12 (Quantity/ 100 persons) | 0.2434 | + | ||
| Land area of public service facilities (Science, education, culture and health, square and commercial service facilities) per 100 people, X13 (HA/100 persons) | 0.3839 | + | ||
| Income level (Q4) | 0.1649 | Per capita net income, X14 (10,000 yuan/year) | 0.1734 | + |
| Proportion of average household agricultural income, X15 (%) | 0.2101 | + | ||
| Proportion of average household income from migrant workers, X16 (%) | 0.1724 | + | ||
| Proportion of average household business income, X17 (%) | 0.4441 | + |
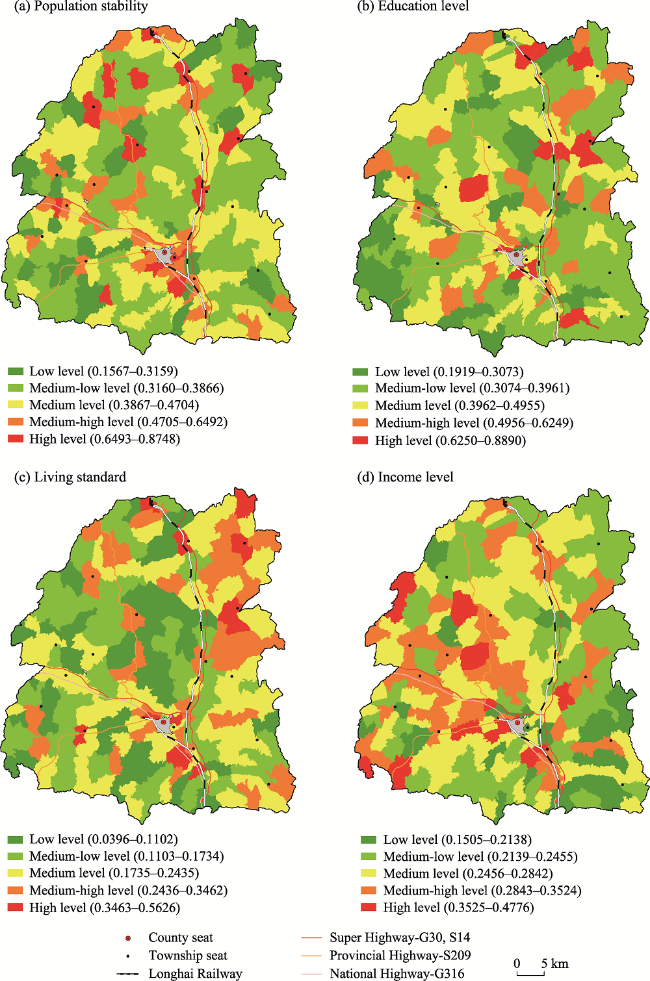
Figure 3 Spatial differences of the rural social space quality subsystems of Longxi County |
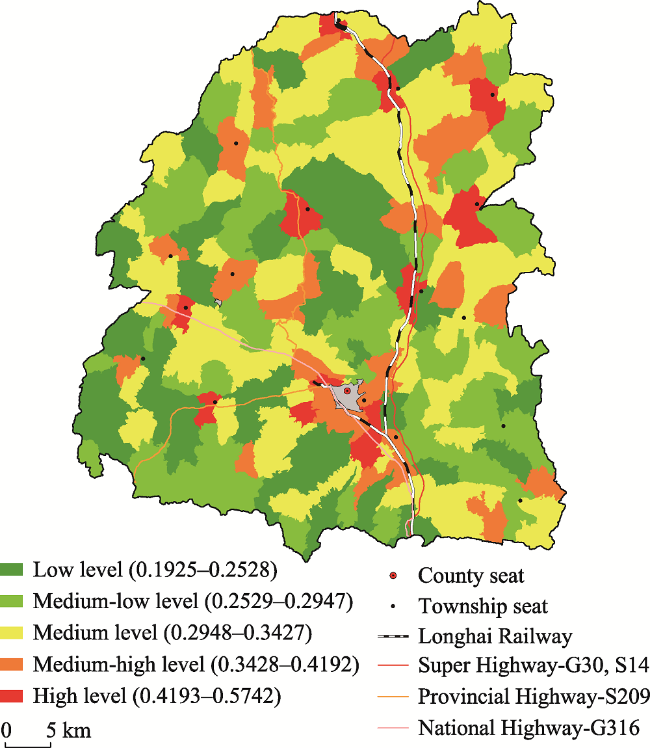
Figure 4 Comprehensive evaluation pattern of the rural social space quality of Longxi County |
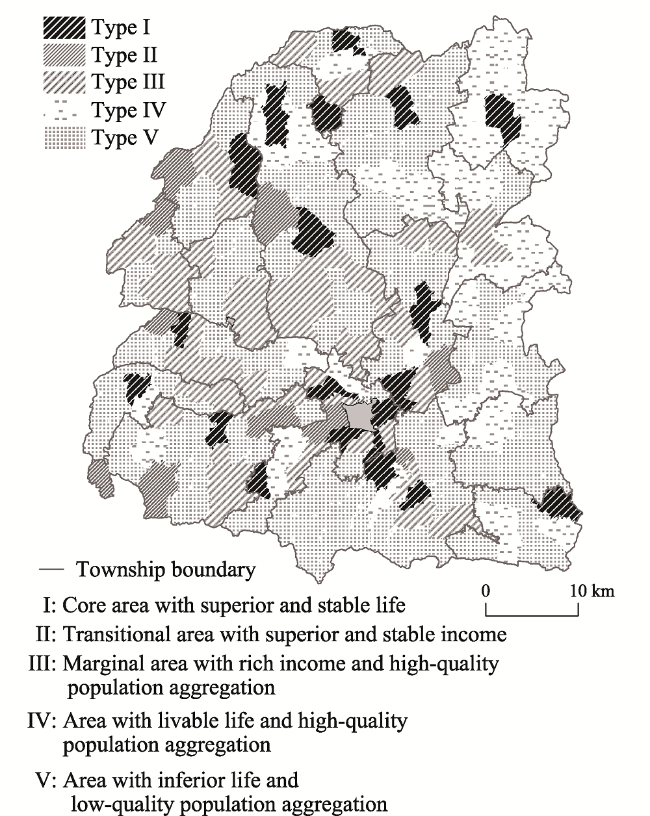
Figure 5 Division of rural social space quality types of Longxi County |
Table 2 Average scores of the rural social space quality type areas of Longxi County |
| Rural social space quality type areas | Number of administrative villages | Average score of population stability level | Average score of education level | Average score of living standard | Average score of income level | Average score of rural social space quality |
|---|---|---|---|---|---|---|
| Type I | 22 | 0.6794 | 0.3956 | 0.3103 | 0.2800 | 0.4116 |
| Type II | 13 | 0.4696 | 0.3710 | 0.1730 | 0.4081 | 0.3260 |
| Type III | 42 | 0.4111 | 0.5394 | 0.1686 | 0.2821 | 0.3270 |
| Type IV | 41 | 0.3633 | 0.4335 | 0.2623 | 0.2307 | 0.3190 |
| Type V | 95 | 0.3847 | 0.3468 | 0.1457 | 0.2497 | 0.2641 |
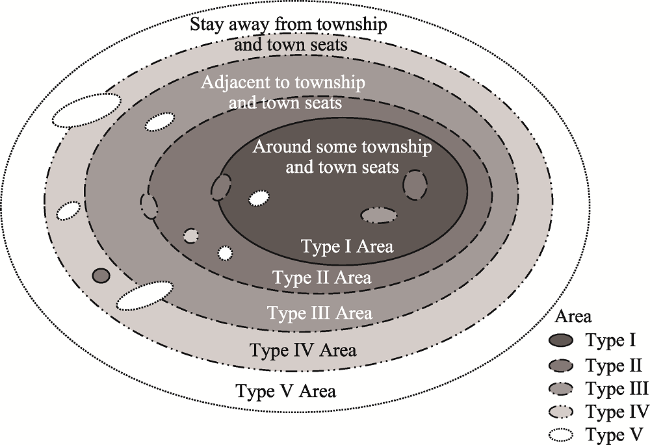
Figure 6 Model of the rural social space quality structure in Longxi County |
Figure 7 Formation mechanism of rural social space quality |
Figure 8 Governance framework of the rural social space quality |
| [1] |
|
| [2] |
|
| [3] |
|
| [4] |
|
| [5] |
|
| [6] |
|
| [7] |
|
| [8] |
|
| [9] |
|
| [10] |
|
| [11] |
|
| [12] |
|
| [13] |
|
| [14] |
|
| [15] |
|
| [16] |
|
| [17] |
|
| [18] |
|
| [19] |
|
| [20] |
|
| [21] |
|
| [22] |
|
| [23] |
|
| [24] |
|
| [25] |
|
| [26] |
|
| [27] |
|
| [28] |
|
| [29] |
|
| [30] |
|
| [31] |
|
| [32] |
|
| [33] |
|
| [34] |
|
| [35] |
|
| [36] |
|
| [37] |
|
| [38] |
|
| [39] |
|
| [40] |
|
| [41] |
|
| [42] |
|
| [43] |
|
/
| 〈 |
|
〉 |
