
Journal of Geographical Sciences >
Population evolution at the prefecture-level city scale in China: Change patterns and spatial correlations
|
Xian Yue (1998-), PhD Candidate, specialized in urbanization and regional sustainable development. E-mail: xianle17@mails.ucas.ac.cn |
Received date: 2022-04-16
Accepted date: 2022-05-06
Online published: 2022-09-25
Supported by
National Natural Science Foundation of China(42121001)
National Natural Science Foundation of China(42171204)
National Natural Science Foundation of China(41822104)
China has entered a new stage of high-quality urbanization. Therefore, it is critical to grasp the latest population distribution and dynamics. Using mean-variance grading, Moran’s index, and the Theil index, this study compared the differences in population changes between 2010-2020 and 2000-2010 at the prefecture-level city scale based on census data to analyze the new trends in population evolution. We found that: (1) New growth poles of the population are inland provincial capitals, forming rapid-growing zones together with coastal urban agglomerations. Population growth in over 60% of the cities in the northern coastal urban agglomeration has slowed. (2) The scope of population loss in inland areas is constantly expanding. In the northeastern part of China, 92.7% of the cities have lost population, making this a typical population loss area. (3) Population shrinkage in the northeastern region and growth in the Pearl River Delta urban agglomeration show diffusion characteristics, while population patterns around the provincial capital are in a polarized stage. (4) The Theil index of population distribution increased, with 83.91% of differences coming from between groups, indicating that the gap between cities of different sizes has further expanded. This study provides scientific support for the coordinated promotion of nearby and remote urbanization.
XIAN Yue , CHEN Mingxing . Population evolution at the prefecture-level city scale in China: Change patterns and spatial correlations[J]. Journal of Geographical Sciences, 2022 , 32(7) : 1281 -1296 . DOI: 10.1007/s11442-022-1997-2
Table 1 Population changes and scale classification methods |
| Type | 1 | 2 | 3 | 4 | 5 |
|---|---|---|---|---|---|
| pop | >μ+std | μ+0.5std~μ+std | μ‒0.5std~μ+0.5std | μ‒std~μ‒0.5std | <μ‒std |
| Δpop | >μ+std | 0.5~μ+std | μ‒std~0 | <μ‒std | ‒ |
Table 2 Classification results of population changes in prefecture-level cities |
| Grading | 2000-2010 | Count | 2010-2020 | Count |
|---|---|---|---|---|
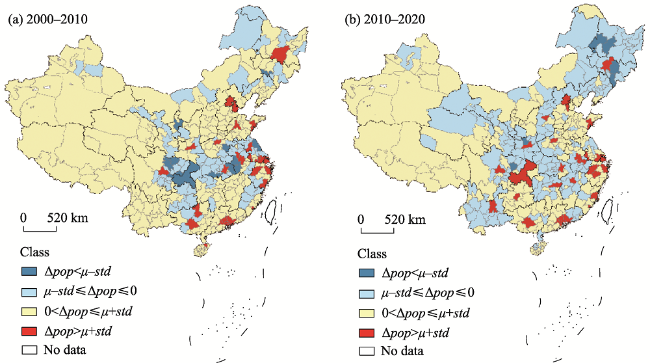
| Δpop>μ+std | ∆pop>109.5 | 28 | ∆pop>110.1 | 31 |
| 0<∆pop≤μ+std | 0<∆pop≤109.5 | 229 | 0<∆pop≤110.1 | 170 |
| μ‒std≤Δpop≤0 | ‒53.7≤∆pop≤0 | 87 | ‒66.7≤∆pop≤0 | 150 |
| Δpop<μ‒std | ∆pop<-53.7 | 13 | ∆pop<-66.7 | 6 |
Figure 1 Classification of population changes at the prefecture-level city scale in China in 2000-2010 (a) and 2010-2020 (b) |
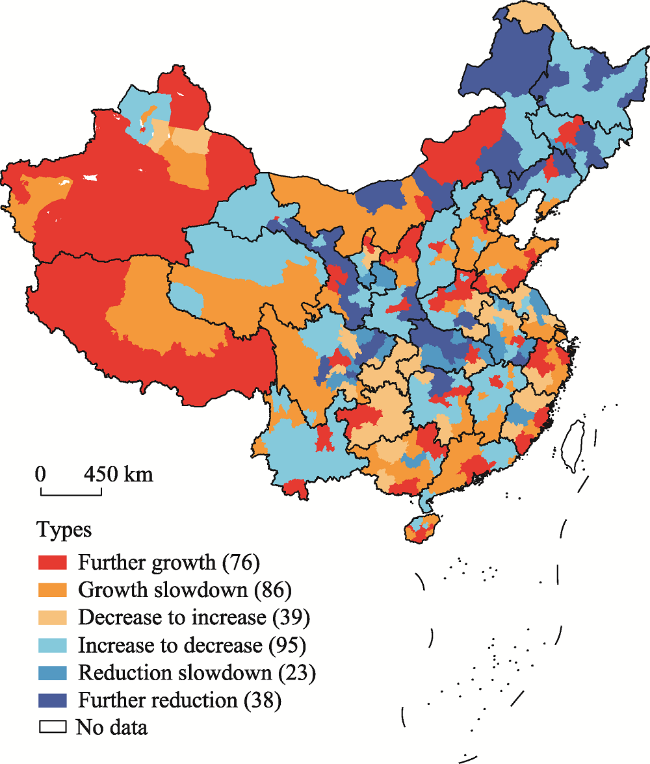
Figure 2 Transformation types of population changes in prefecture-level cities in 2000-2020 |
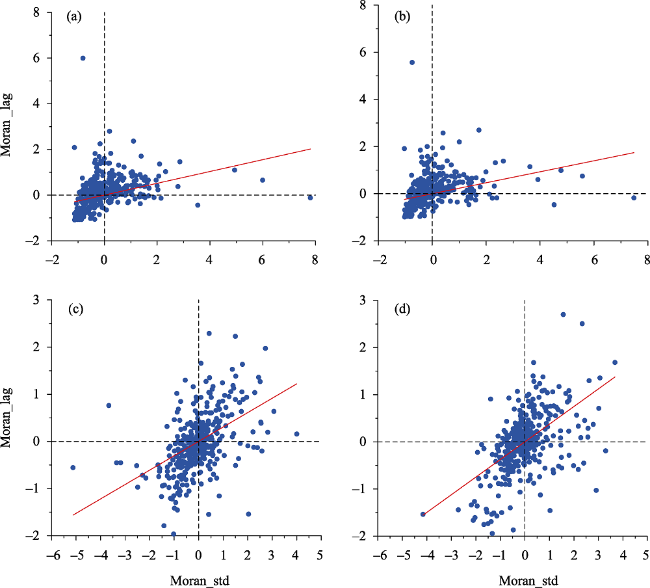
Figure 3 Moran scatter plot of population changes in 2000-2010 (a) and 2010-2020 (b), and population size of prefecture-level cities in 2010 (c) and 2020 (d) |
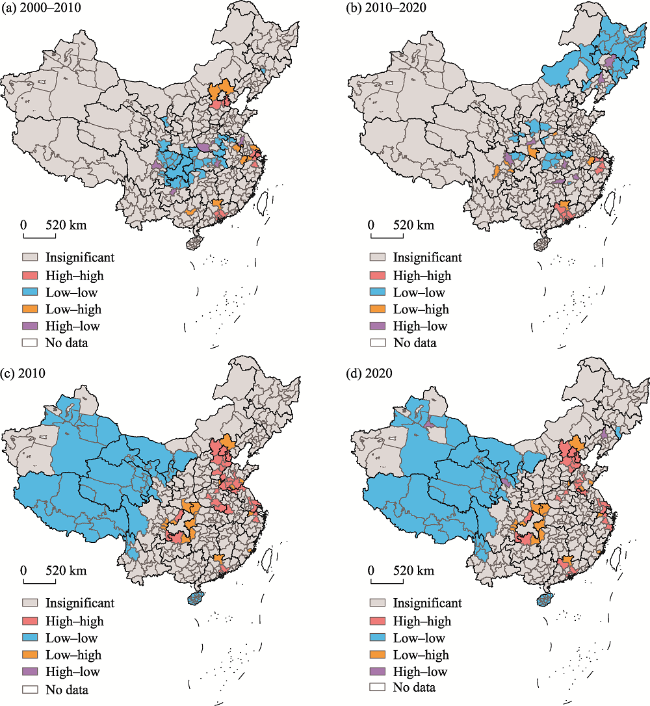
Figure 4 LISA agglomeration map of population changes in 2000-2010 (a) and 2010-2020 (b), and that of the population size in 2010 (c) and 2020 (d) |
Table 3 Theil index of prefecture-level cities grouped by population size |
| 2010 | 2020 | |||||
|---|---|---|---|---|---|---|
| Grouping | Proportion (%) | Tpi | Zi (%) | Proportion (%) | Tpi | Zi (%) |
| pop>μ+std | 13.73 | 0.069 | 2.04 | 12.04 | 0.075 | 1.94 |
| μ+0.5std<pop≤μ+std | 8.68 | 0.003 | 1.29 | 6.72 | 0.003 | 1.08 |
| μ‒0.5std≤pop≤μ+0.5std | 45.94 | 0.034 | 6.83 | 49.86 | 0.043 | 8.02 |
| μ‒std≤pop<μ‒0.5std | 22.69 | 0.068 | 3.37 | 29.41 | 0.132 | 4.73 |
| pop<μ‒std | 8.96 | 0.124 | 1.33 | 1.96 | 0.183 | 0.32 |
| TWR | 0.046 | 14.86 | 0.056 | 16.09 | ||
| TBR | 0.261 | 85.14 | 0.294 | 83.91 | ||
| Tp | 0.306 | 100.00 | 0.351 | 100.00 | ||
| [1] |
|
| [2] |
|
| [3] |
|
| [4] |
|
| [5] |
|
| [6] |
|
| [7] |
|
| [8] |
|
| [9] |
|
| [10] |
|
| [11] |
|
| [12] |
|
| [13] |
|
| [14] |
|
| [15] |
|
| [16] |
|
| [17] |
|
| [18] |
|
| [19] |
|
| [20] |
|
| [21] |
|
| [22] |
|
| [23] |
|
| [24] |
|
| [25] |
|
| [26] |
|
| [27] |
|
| [28] |
|
| [29] |
|
| [30] |
|
| [31] |
|
| [32] |
|
| [33] |
|
| [34] |
|
| [35] |
|
| [36] |
|
| [37] |
|
| [38] |
|
| [39] |
|
| [40] |
|
/
| 〈 |
|
〉 |