
Journal of Geographical Sciences >
Urbanization of county in China: Spatial patterns and influencing factors
|
Zhang Hua (1979-), Associate Professor, specialized in population geography and regional development. E-mail: zhanghua@bnu.edu.cn |
Received date: 2022-01-25
Accepted date: 2022-04-09
Online published: 2022-09-25
Supported by
The Second Tibetan Plateau Scientific Expedition and Research Program(2019QZKK0406)
National Natural Science Foundation of China(42171204)
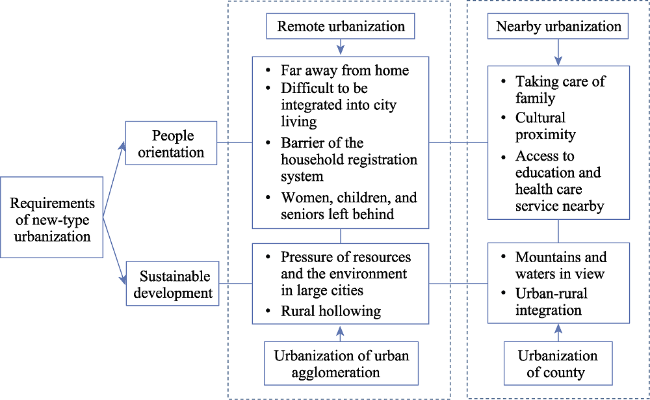
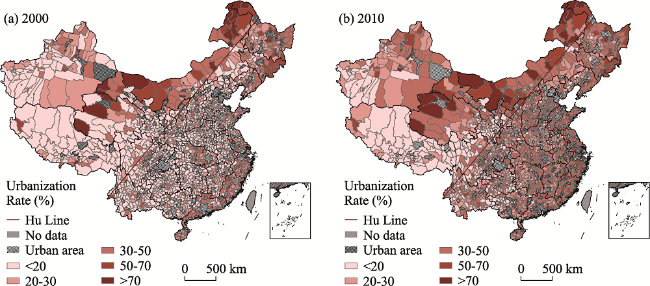
This paper uses the fifth and sixth census data and 2018 demographic statistics to analyze the spatiotemporal evolution of the urbanization of county in China and the factors that influence the evolution. The paper reveals that the urbanization level of counties is a weak area in China’s overall urbanization. During the period from 2000 to 2010, the spatial patterns of the urbanization level of counties remained stable. Counties with high-level urbanization were concentrated in the coastal areas of the eastern region, while counties that experienced rapid urbanization were mainly located in the central and western regions. Regression analyses indicate that harsh natural endowments that constrain economic development are the most important factors that hinder the urbanization of county; these factors include marginalized locations far away from center cities, high altitudes, and a population with a low education level. This paper also compares two theoretical modes of new-type urbanization, nearby urbanization and remote urbanization, and argues that the new-type urbanization of county is the main form of nearby urbanization and provides an example of urbanization for developing countries worldwide.
ZHANG Hua , CHEN Mingxing , LIANG Chen . Urbanization of county in China: Spatial patterns and influencing factors[J]. Journal of Geographical Sciences, 2022 , 32(7) : 1241 -1260 . DOI: 10.1007/s11442-022-1995-4
Figure 1 Relationships among remote urbanization, nearby urbanization, and new-type urbanization of county |
Table 1 Description of independent variables in influencing factor analysis of urbanization of county |
| Category | Independent variable | Description of independent variable |
|---|---|---|
| Economic development | PGDP (thousand yuan) | Per capita gross domestic product |
| PVP (%) | Proportion of the value added by the primary industry | |
| PVS (%) | Proportion of the value added by the secondary industry | |
| PEM (%) | Proportion of workers in the manufacturing industry | |
| PEPS (%) | Proportion of workers in the producer services industry | |
| PECS (%) | Proportion of workers in the consumer services industry | |
| IR (%) | Income ratio of urban to rural residents | |
| Population agglomeration | MFP (%) | Proportion of the population that migrated from outside the province |
| MFC (%) | Proportion of the population that migrated from other counties of the province | |
| Social development | AYS (years) | Average years of schooling |
| PHB (beds/person) | Number of beds in hospitals and health centers | |
| Location characteristics | DCC (km) | Distance from county town to provincial capital |
| DPC (km) | Distance from county town to prefecture-level city center | |
| DRS (km) | Distance from county town to the nearest railway station | |
| MA (m) | Mean altitude | |
| MS (%) | Mean slope | |
| WAI (%) | Water abundance index (Li, 2009) |
Table 2 Proportion of different degrees of urbanization at county level in China in 2000 and 2010 |
| Urbanization rate (%) | China | East of Hu Line | West of Hu Line | ||||||
|---|---|---|---|---|---|---|---|---|---|
| 2000 | 2010 | Change rate (%) | 2000 | 2010 | Change rate (%) | 2000 | 2010 | Change rate (%) | |
| <20 | 1047 | 269 | -41.36 | 711 | 103 | -45.82 | 336 | 166 | -30.69 |
| 20-30 | 427 | 532 | 5.58 | 308 | 394 | 6.48 | 119 | 138 | 3.43 |
| 30-50 | 313 | 879 | 30.09 | 251 | 695 | 33.46 | 62 | 184 | 22.02 |
| 50-70 | 61 | 153 | 4.89 | 42 | 115 | 5.50 | 19 | 38 | 3.43 |
| >70 | 33 | 48 | 0.80 | 15 | 20 | 0.38 | 18 | 28 | 1.81 |
Figure 2 Regional differences in urbanization rates of China’s counties in 2000 (a) and 2010 (b) |
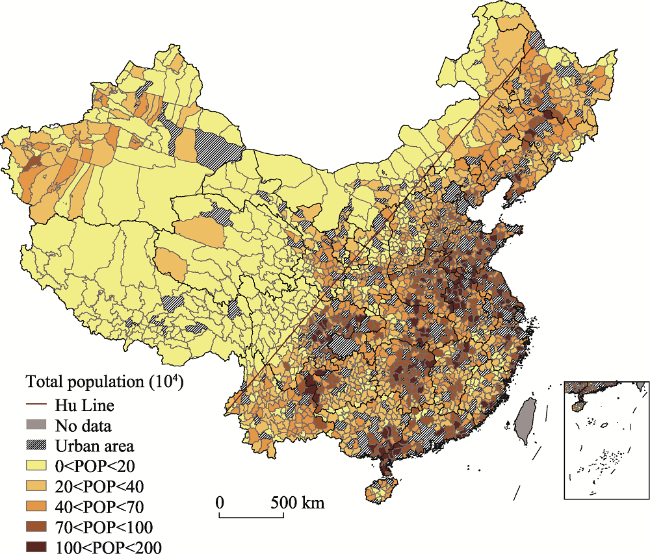
Figure 3 Spatial patterns of total population in China’s counties in 2018 |
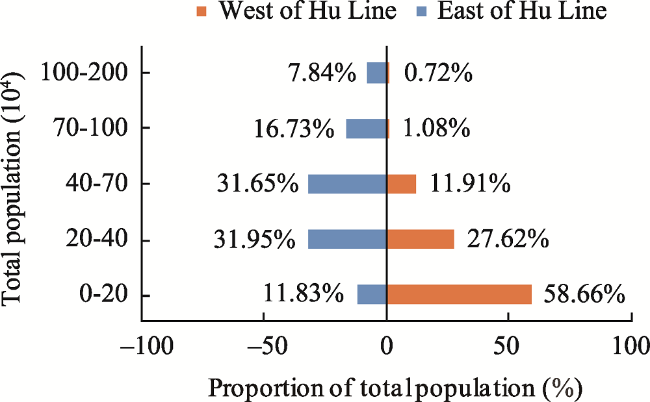
Figure 4 The hierarchical size structure of total population in China’s counties in 2018 |
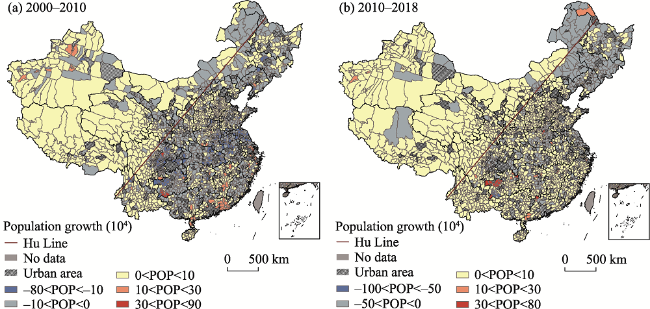
Figure 5 The growth of total population in China’s counties in 2000-2010 (a) and 2010-2018 (b) |
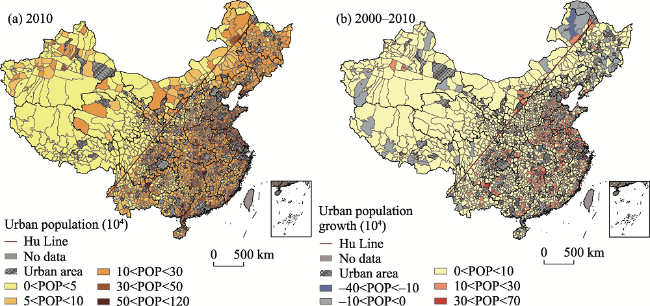
Figure 6 Distribution and growth of urban population in China’s counties in 2010 |
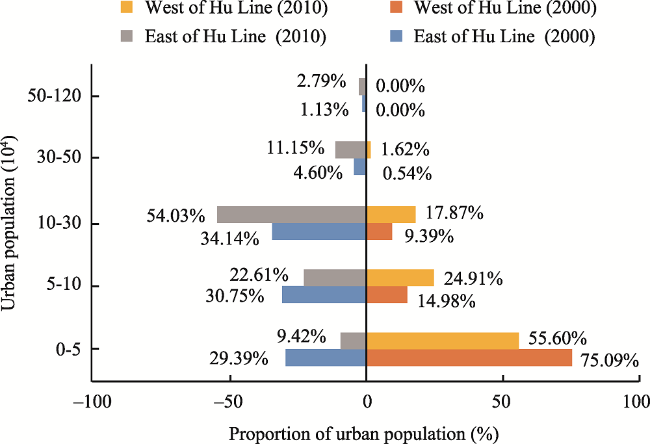
Figure 7 The hierarchical size structure of urban population in China’s counties in 2000 and 2010 |
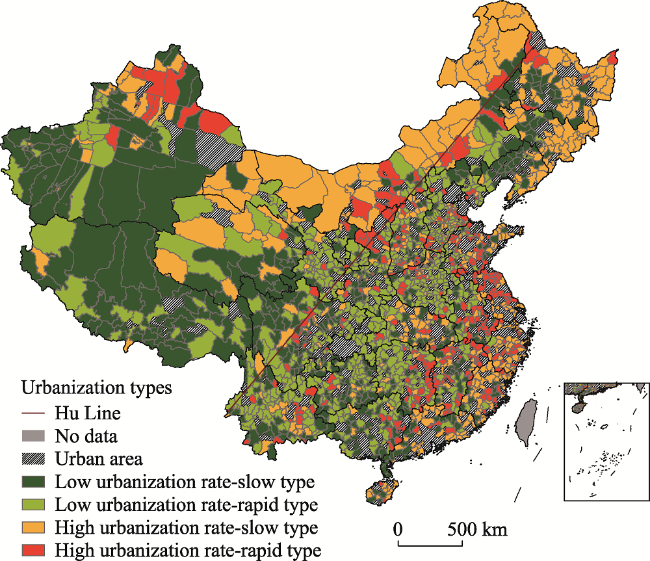
Table 3 Proportion of different types of county urbanization development in China in 2010 |
| Quadrant | County urbanization types | Mumber | Proportion (%) |
|---|---|---|---|
| Quadrant I | High urbanization rate-rapid type | 314 | 16.69 |
| Quadrant II | Low urbanization rate-rapid type | 637 | 33.86 |
| Quadrant III | Low urbanization rate-slow type | 478 | 25.41 |
| Quadrant IV | High urbanization rate-slow type | 452 | 24.03 |
Figure 8 Classification of county urbanization development types in China |
Table 4 Regression analysis results of county urbanization development |
| Variable | Coefficient | Beta | t | Sig. | Tolerance | VIF | |
|---|---|---|---|---|---|---|---|
| Constant | -3.855 | -1.165 | 0.244 | ||||
| PGDP | 0.096*** | 0.132 | 5.695 | 0.000 | 0.331 | 3.017 | |
| PVP | -0.026 | -0.027 | -1.229 | 0.219 | 0.381 | 2.627 | |
| PVS | 0.010* | 0.064 | 1.900 | 0.058 | 0.160 | 6.258 | |
| PEM | 0.159*** | 0.125 | 6.303 | 0.000 | 0.453 | 2.207 | |
| PEPS | 1.163*** | 0.206 | 8.593 | 0.000 | 0.310 | 3.227 | |
| PECS | 0.609*** | 0.239 | 10.004 | 0.000 | 0.313 | 3.194 | |
| IR | -0.002*** | -0.060 | -3.270 | 0.001 | 0.522 | 1.918 | |
| MFP | 0.350*** | 0.221 | 10.112 | 0.000 | 0.375 | 2.670 | |
| MFC | 0.023*** | 0.123 | 5.663 | 0.000 | 0.276 | 3.732 | |
| AYS | 1.862*** | 0.135 | 6.273 | 0.000 | 0.385 | 2.598 | |
| PHB | 0.002*** | 0.130 | 5.785 | 0.000 | 0.354 | 2.825 | |
| DCC | -3.315E-5 | 0.000 | -0.025 | 0.980 | 0.633 | 1.580 | |
| DPC | -0.016*** | -0.055 | -3.143 | 0.002 | 0.586 | 1.707 | |
| DRS | 0.001*** | 0.056 | 2.761 | 0.006 | 0.435 | 2.300 | |
| MA | -0.001** | -0.049 | -2.188 | 0.029 | 0.351 | 2.847 | |
| MS | -0.023** | -0.056 | -2.764 | 0.037 | 0.267 | 3.792 | |
| WAI | 0.051*** | 0.059 | 3.129 | 0.002 | 0.496 | 2.016 | |
| R2 | 0.729 | ||||||
| Adjusted R2 | 0.726 | ||||||
| F | 240.333 | ||||||
| Sig. | 0.000 | ||||||
| DW | 1.949 | ||||||
| Observations | 1534 | ||||||
Note: ***denotes significance at 1% level, ** denotes significance at 5% level, * denotes significance at 10% level. |
| [1] |
|
| [2] |
|
| [3] |
|
| [4] |
|
| [5] |
|
| [6] |
|
| [7] |
|
| [8] |
|
| [9] |
|
| [10] |
|
| [11] |
|
| [12] |
|
| [13] |
|
| [14] |
|
| [15] |
|
| [16] |
|
| [17] |
|
| [18] |
|
| [19] |
|
| [20] |
|
| [21] |
|
| [22] |
|
| [23] |
|
| [24] |
|
| [25] |
|
| [26] |
|
| [27] |
|
| [28] |
|
| [29] |
National Bureau of Statistics of China (NBSC), 2021. China Statistical Yearbook 2021. Beijing: China Statistics Press. (in Chinese)
|
| [30] |
|
| [31] |
|
| [32] |
|
| [33] |
|
| [34] |
|
| [35] |
|
| [36] |
|
| [37] |
|
| [38] |
|
| [39] |
|
/
| 〈 |
|
〉 |