
Journal of Geographical Sciences >
The pattern, evolution, and mechanism of venture capital flows in the Guangdong-Hong Kong-Macao Greater Bay Area, China
|
Wu Kangmin (1991-), Assistant Professor, specialized in innovation geography. E-mail: kangmwu@163.com |
Received date: 2021-11-07
Accepted date: 2022-04-02
Online published: 2022-12-25
Supported by
National Natural Science Foundation of China(42101182)
National Natural Science Foundation of China(42130712)
The Technology Plan of Guangzhou(202201010319)
GDAS Special Project of Science and Technology Development(2021 GDASYL-20210103004)
GDAS Special Project of Science and Technology Development(2020GDASYL-20200104001)
GDAS Special Project of Science and Technology Development(2020GDASYL-20200102002)
As an important innovation flow, venture capital has been examined in urban network research. However, the segmentation of capital categories and the cross-scale connection of capital remain scarcely analyzed. This study focuses on the structure and industry differentiation of venture capital flows in the Guangdong-Hong Kong-Macao Greater Bay Area (GBA) and its cross-scale network characteristics. Based on a venture capital database covering capital amount, investment subject address information, and industry information (2000-2018), this article examines the spatial distribution and network structure of venture capital in the GBA by means of a distance-based test of spatial concentration approach and social network analysis. Key findings show that: (1) Venture capital institutions and startups in the GBA present a high-concentration distribution pattern. In the past 20 years, venture capital activities in the GBA have substantially increased, forming a complex urban network structure with Guangzhou, Shenzhen, and Hong Kong as the core of this network. (2) Different types of venture capital show significantly different urban network structures, with manufacturing, the Internet industry, the financial sector, the cultural media industry, and the medical and health industry as the five industry types with the largest capital flow in the GBA. (3) Cross-scale research on the venture capital network reveals the position of the GBA as a capital hub in China, which forms a dense venture capital connection network with major cities on a national scale. (4) The network structure of venture capital in the GBA is influenced by multi-dimensional proximity, institutional factors, urban economy, and path dependence. Along with these three key mechanisms, the GBA has grown into a national-scale and even global-scale venture capital center.
WU Kangmin , WANG Yang , ZHANG Hong’ou , LIU Yi , YE Yuyao , YUE Xiaoli . The pattern, evolution, and mechanism of venture capital flows in the Guangdong-Hong Kong-Macao Greater Bay Area, China[J]. Journal of Geographical Sciences, 2022 , 32(10) : 2085 -2104 . DOI: 10.1007/s11442-022-2038-x
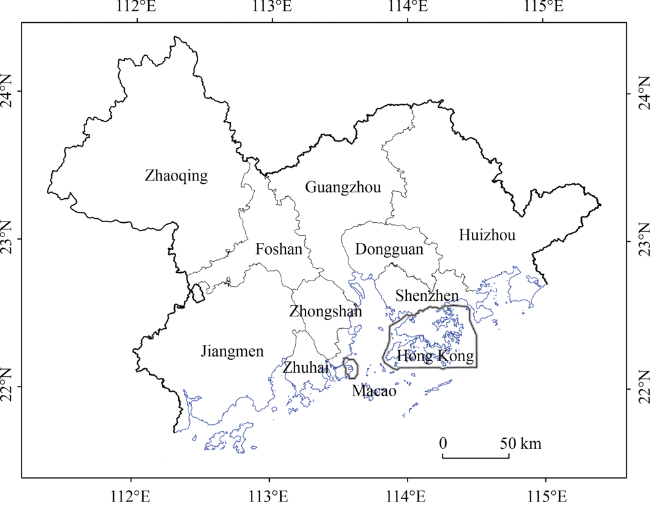
Figure 1 Study area (Guangdong-Hong Kong-Macao Greater Bay Area) |
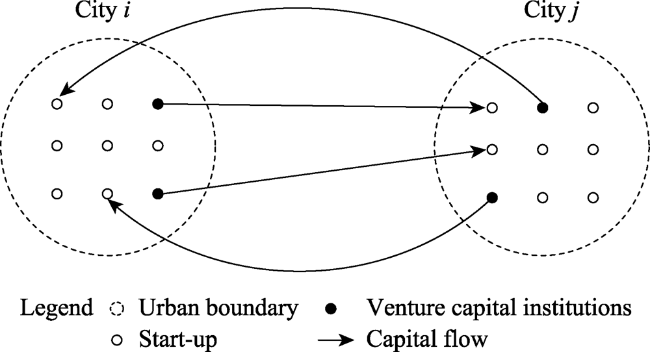
Figure 2 Venture capital connections between cities |
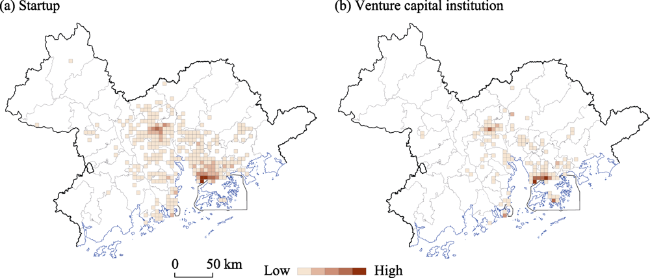
Figure 3 The distribution of the venture capital entityNote: a and b are the grid-based spatial distributions of startup and venture capital institution, respectively. |
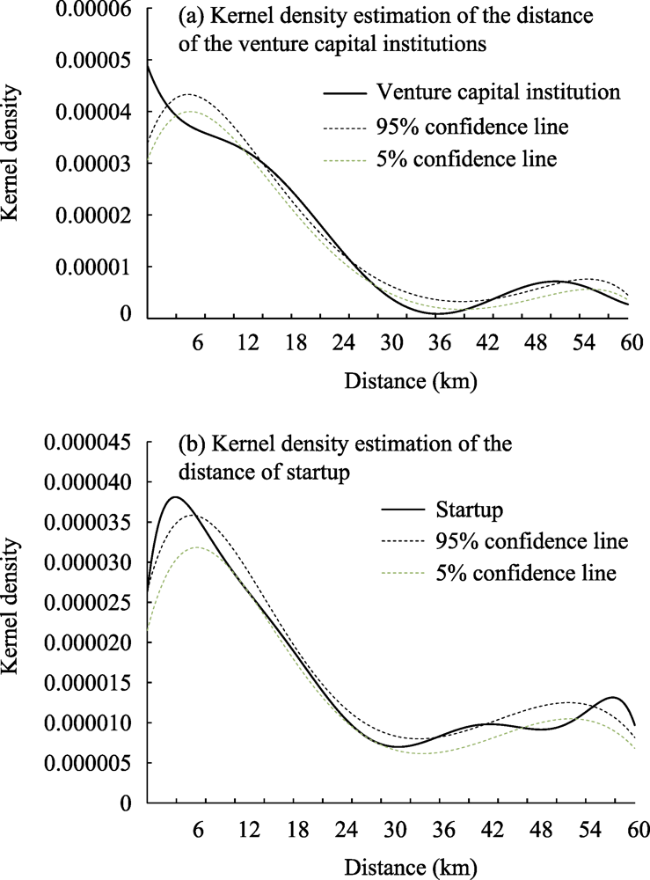
Figure 4 Kernel density estimation of the distance of the venture capital entitiesNote: a and b are agglomeration distribution of startup and venture capital based on the DO approach, respectively. |
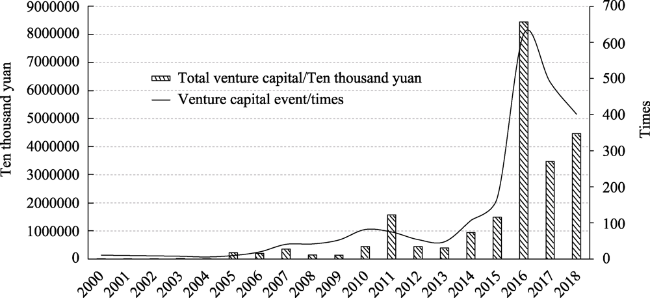
Figure 5 The growth of the venture capital in the GBA from 2000 to 2018 |
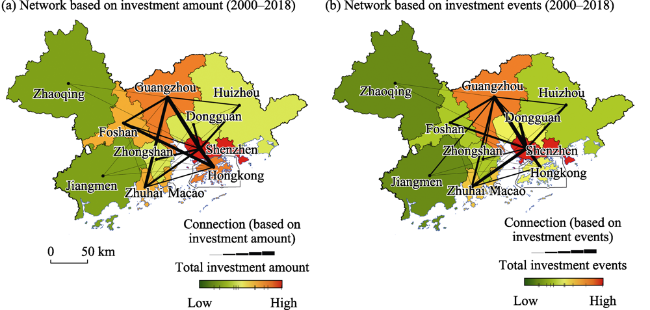
Figure 6 The venture capital network of the GBA from 2000 to 2018Note: “total investment amount” is defined as the sum of city a and b investing and receiving capital; “investment event” is defined as the sum of the events of city a and b investing and receiving investment; a and b are the urban network structure based on the two links of investment amount and investment event, respectively. |
Table 1 The urban centrality of 11 cities in the GBA |
| Based on total investment amount | Based on investment events | |||||
|---|---|---|---|---|---|---|
| Degree centrality | Out-degree | In-degree | Degree centrality | Out-degree | In-degree | |
| Shenzhen | 15.422 | 13.227 | 12.195 | 13.44 | 13.16 | 11.175 |
| Guangzhou | 5.062 | 2.663 | 3.701 | 4.506 | 2.708 | 4.156 |
| Hongkong | 3.194 | 2.905 | 0.373 | 0.638 | 0.638 | 0.125 |
| Zhuhai | 1.464 | 0.794 | 1.015 | 0.7 | 0.591 | 0.553 |
| Foshan | 1.415 | 0.256 | 1.342 | 0.327 | 0.117 | 0.327 |
| Huizhou | 0.745 | 0.357 | 0.694 | 0.311 | 0.047 | 0.311 |
| Dongguan | 0.626 | 0.134 | 0.535 | 0.576 | 0.249 | 0.568 |
| Zhongshan | 0.474 | 0.106 | 0.463 | 0.21 | 0.047 | 0.21 |
| Jiangmen | 0.135 | 0.06 | 0.131 | 0.086 | 0.023 | 0.086 |
| Zhaoqing | 0.053 | 0.001 | 0.053 | 0.078 | 0.008 | 0.078 |
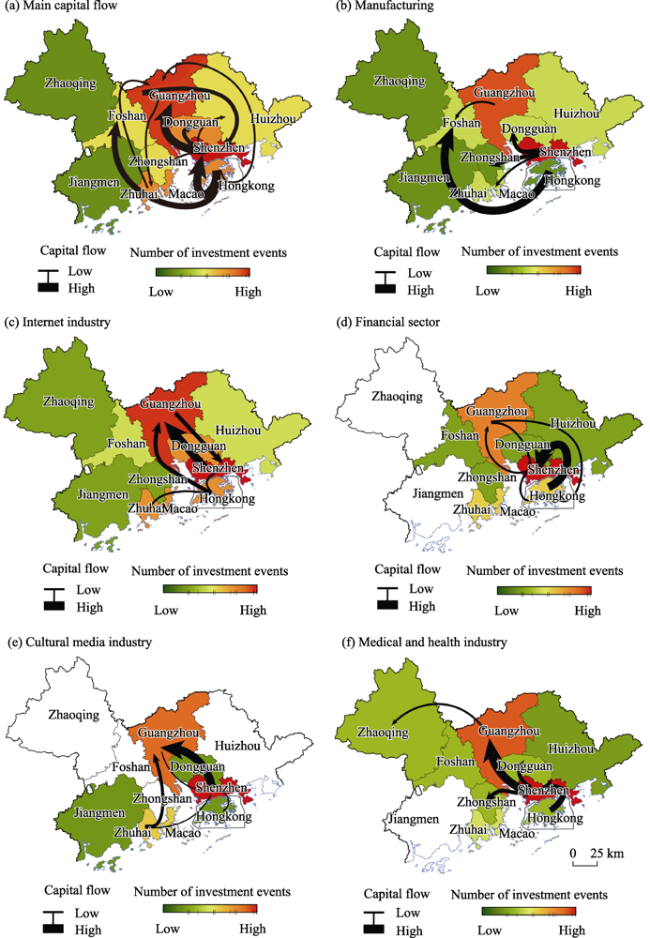
Figure 7 The flow of venture capital in core industries in the GBANote: a, b, c, d, e and f are spatial distribution of investment events and the major venture capital flows of the total and the five major industry types, respectively. |
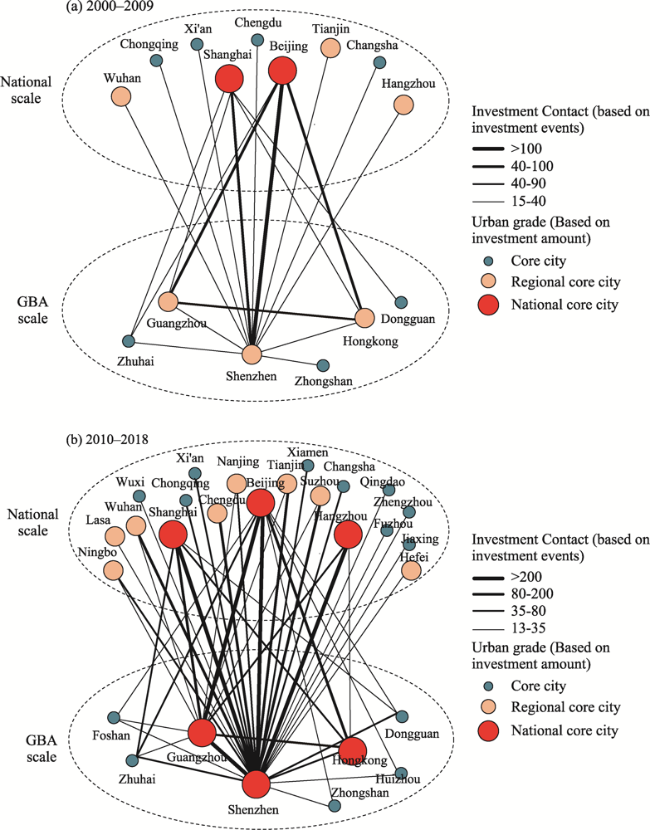
Figure 8 The structure and evolutionary characteristics of the cross-scale capital collaboration network in the GBANote: a and b are the cross-scale venture capital network structure of GBA in 2000-2009 and 2010-2018, respectively. |
| [1] |
|
| [2] |
|
| [3] |
|
| [4] |
|
| [5] |
|
| [6] |
|
| [7] |
|
| [8] |
|
| [9] |
|
| [10] |
|
| [11] |
|
| [12] |
|
| [13] |
|
| [14] |
|
| [15] |
|
| [16] |
|
| [17] |
|
| [18] |
|
| [19] |
|
| [20] |
|
| [21] |
|
| [22] |
|
| [23] |
|
| [24] |
|
| [25] |
|
| [26] |
|
| [27] |
|
| [28] |
|
| [29] |
|
| [30] |
|
| [31] |
|
| [32] |
|
| [33] |
|
| [34] |
|
| [35] |
|
| [36] |
|
| [37] |
|
| [38] |
|
| [39] |
|
| [40] |
|
| [41] |
|
| [42] |
|
| [43] |
|
| [44] |
|
| [45] |
|
/
| 〈 |
|
〉 |