Research Articles

Understanding the multidimensional poverty in South Asia

  • LI Yuheng , 1 ,
  • JIN Qihui 2 ,
  • LI Ao 3
Expand
  • 1.CAS Key Laboratory of Regional Sustainable Development Modeling, Institute of Geographic Sciences and Natural Resources Research, CAS, Beijing 100101, China
  • 2.College of Economics and Management, Xinjiang Agricultural University, Urumqi 830052, China
  • 3.College of Tourism and Urban-Rural Planning, Chengdu University of Technology, Chengdu 610059, China

Li Yuheng (1983‒), Associate Professor, E-mail:

Received date: 2022-02-21

  Accepted date: 2022-05-17

  Online published: 2022-12-25

Supported by

National Natural Science Foundation of China(42171208)

Alliance of Poverty Reduction and Development(ANSO-PA-2020-16)

Abstract

Special attention needs to be paid to achieve the world’s poverty reduction goal by 2030 in less than ten-year time. The paper aims to investigate the multidimensional poverty in South Asia in the period 2003-2019. It constructs the Multidimensional Poverty Index (MPI) by selecting ten indicators in the fields of health, education and living standards. The research results show that the MPI of South Asia decreases in the research period. Poor people in South Asian countries are still facing several forms of deprivation while cooking fuel, sanitation, housing, nutrition and years of schooling are the main restrictive factors to poverty reduction in this region. Pakistan, India and Bangladesh face the worst poverty situation in terms of health, education and living standards. Targeted poverty alleviation and resilient poverty reduction are proposed in the paper to improve the poverty reduction efficiency and individual/regional capacity against risks to avoid returning to poverty.

Cite this article

LI Yuheng , JIN Qihui , LI Ao . Understanding the multidimensional poverty in South Asia[J]. Journal of Geographical Sciences, 2022 , 32(10) : 2053 -2068 . DOI: 10.1007/s11442-022-2036-z

1 Introduction

“Eradicating all poverty in the world” is the first goal among the 17 sustainable development goals (SDGs) put forward by the United Nations (United Nations 2015). In the recent decades, the world has made remarkable progress in poverty reduction which has seen 1 billion people out of poverty under the international poverty line at $1.9 per person per day according to the 2011 values of purchasing power parity exchange rates. This is mainly attributed to the economic rise of developing countries and the growth has contributed to human development and poverty reduction (Fosu, 2016). Li et al. (2021) finds that the world’s poverty gravity center has moved from Asia to Africa in the period 1990-2015 and will move further to the African continent in the coming decades. However, a series of challenges like disasters, conflicts and economic fluctuations are affecting the stability of poverty reduction and increases the vulnerability of poverty in the world. FAO and WFP (2018) pointed out that conflicts have caused the increase of starveling people from 777 million in 2015 to 815 million in 2016 across the world. According to the World Bank (2021), an estimation of 85 to 115 million people will be driven to fall into extreme poverty owing to the Covid-19 pandemic. These have added in uncertainties to the accomplishment of the world’s poverty reduction goal in 2030.
Scholars have input much energy in explaining poverty. Broadly speaking, economy has been given full consideration to explain both poverty incidence and poverty reduction as economy tightly connects to people’s employments and access to public services (Bruno et al., 1996; Dollar and Kraay, 2002). In the 1980s, Amartya Sen, the Nobel laureate, introduced capacity poverty and right poverty, extending the view of poverty beyond the traditional economic explanations. Then, the concept of multidimensional poverty was coined, describing poverty as limited financial resources, material deprivation, social isolation, exclusion and powerlessness, and physical and psychological ill-being. Sen emphasizes that income itself is insufficient to reflect the full picture of real poverty, and the deprivation of individual capability is also the causing factor to poverty (Sen, 1999). Ever since then, it has become generally accepted that the content of poverty includes not only economic issues, but also social exclusions, lack of opportunities or public services, and vulnerability or exposure to risks (World Bank, 2000; Bhalla and Lapeyre, 2004; Wagle, 2008). As a result, the concept of poverty is understood from multiple perspectives and the poverty index was thus divided into two categories: monetary poverty index and non-monetary poverty index (Bourguignon and Chakravarty, 2003; Bader et al., 2016; Ravallion, 2016; Steinert et al., 2016; Salecker et al., 2020). Further, the Oxford Poverty and Human Development Center developed the multidimensional poverty theory and created an evaluation system from the dimensions of health, education and life (Alkire, 2007). The multidimensional poverty index (MPI) makes up for the deficiency that income itself cannot be a perfect substitute for poverty.
South Asia is a region with high incidence of poverty. During the 1990s and the beginning of the 21st century, the world’s poverty gravity center was in South Asia which used to suffer from colonization, wars and disasters, resulting in underdevelopment with deep poverty (Li et al., 2021). Although South Asia is no longer the world’s poverty gravity center, this region remains the home to a very large number of poor and still faces various challenges. Alkire et al. (2020) indicates that 630 million people in South Asia are malnourished and 55% of the people are deprived of education, employments and medical services etc. In addition, South Asia is also a region which is vulnerable to natural disasters. The major part of South Asia is located in one of the most seismically active areas in the world and more than 600 million people live on the Himalayan fault line across Pakistan, India, Nepal and Bhutan (Annette Dixon, 2016). As a result, natural disasters can easily put many people into poverty in South Asia.
So far, many scholars have measured multidimensional poverty situation in the world, however the current studies mainly focus on an individual country, state or municipality and few studies have studied multidimensional poverty in a region such as South Asia (Tsui, 2002; Cavatassi, 2004; Maasoumi and Lugo, 2008; Cohen, 2009; Alkire and Foster, 2011; Ravallion, 2011; Santos, 2015; Hanadita, 2016; Sudeshna, 2021). What’s more, the selection and integration of poverty indicators vary and differ among the current studies owing to the difficulties of obtaining data (Bourguignon and Chakravarty, 2003; Ferreira and Lugo, 2012). Thinking of the aim to accomplish the poverty reduction goal of South Asia in 2030, the paper aims to investigate the multidimensional poverty in this region and identify the restrictive factors to sustainable poverty reduction in South Asia. Policy implications for sustainable and resilient poverty reduction in South Asia are proposed based on the research results of the paper.

2 Research area and methodology

2.1 Introduction of South Asia

The geographical location of South Asia is shown in Figure 1. South Asia is divided into “Continental” countries and “Island” countries. The “Continental” countries include Nepal, Bhutan, India, Pakistan, Bangladesh and Afghanistan while the “Island” countries include Sri Lanka and Maldives. The north part of South Asia is of higher elevation than the south part.
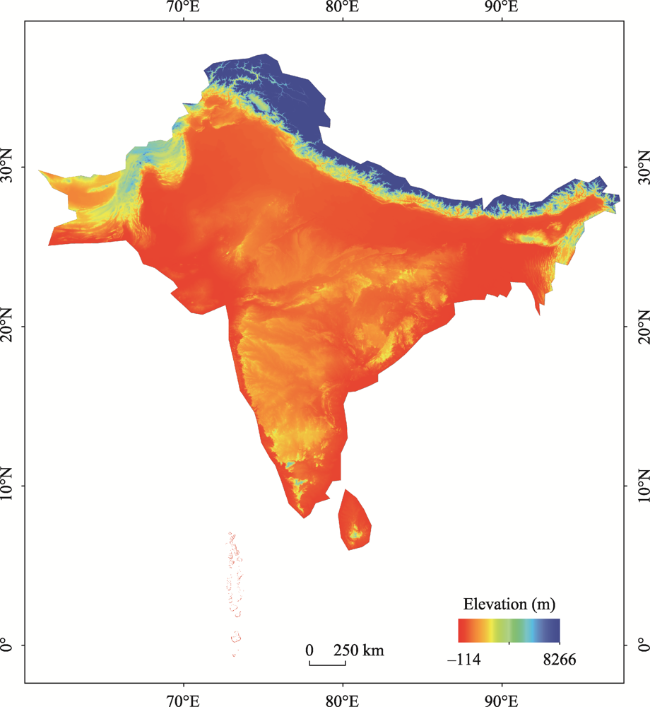
Figure 1 The geographic location of South Asia
South Asia covers a total territorial area of 4.91 million km2, sharing 18.9% of the total area of Asia. In 2019, there were 18.36 billion people living in South Asia accounting for 43.85% of the total population in Asia while this region also produced 12.77% of the total GDP in Asia. It is also noteworthy that the urbanization level of South Asia is only 31.93%which is the lowest in Asia and means that this region is still a rural based place. In terms of economic situation, the economic level of South Asia is still the lowest one in Asia with the per capita GDP of 6508.01$ in 2019 (Table 1).
Table 1 Socioeconomic situation of Asian regions in 2019
Region Population (million) Per capita GDP ($) GDP (billion$) Territorial area
(million km2)
Urbanization level (%)
South Asia 1835.78 6508.01 3597.25 4.91 31.93
East Asia 1614.67 28820.60 21094.35 12.50 72.82
Southeast Asia 661.91 24332.19 3171.96 4.57 51.48
Central Asia 73.81 4294.64 303.98 4.00 44.78
As Table 2 shows, the South Asian countries vary a lot in terms of territory, population, urbanization level and economy. India, Pakistan and Bangladesh are the top three countries of largest population. However, the per capita GDP of Afghanistan, Bangladesh, Nepal and Pakistan are less than that of Asia (6901.93 \$) while India is just around the average economic level of Asia. Owing to the small population, the per capita GDP of Bhutan, Sri Lanka and Maldives are better than the other countries with 12366.53\$, 13622.86 \$ and 20335.59\$ respectively. Besides, South Asian countries are of low urbanization levels, indicating a rural dominated situation in this region.
Table 2 Socioeconomic situation of South Asian countries in 2019
Country Population (million) Per capita GDP ($) GDP (billion$) Territorial area (km²) Urbanization level (%)
Bangladesh 163.05 4954.76 302.57 147,570 37.41
India 1366.42 6997.86 2870.50 2,980,000 34.47
Maldives 0.53 20335.59 5.61 300 40.24
Nepal 28.61 4119.92 34.19 147,181 20.15
Pakistan 216.57 4896.39 279.06 881,912 36.91
Sri Lanka 21.80 13622.86 83.99 65,610 18.59
Bhutan 0.76 12366.53 2.54 38,394 41.61
Afghanistan 38.04 2152.36 18.79 647,500 26.02
In 1990, South Asia accounted for the second largest share of the global poor (27.3%) under the poverty line was $1.90 a day - a figure equal to 535.91 million people. Today, South Asia remains the region with the second largest grouping of the global poor in terms of both income and multidimensional poverty. According to the Poverty and Shared Prosperity Report (2018) released by the World Bank11Poverty statistics of Afghanistan is missing in the report.), South Asia accounted for 29% of the people living in extreme poverty worldwide (216 million extreme poor in South Asia out of the estimated 736 million extreme poor worldwide) in 2015. India resided the largest population of extreme poverty (175.7 million) in South Asia, followed by Bangladesh with 24.4 million extreme poor. The third place is Pakistan, which has a larger population than Bangladesh, but a smaller amount of extreme poor (9.9 million extreme poor). Bhutan and Sri Lanka are considered development success stories where extreme poverty has become rare while extreme poverty is nearly nonexistent in Maldives according to the report.

2.2 Research methodology and data source

On the notion of multidimensional poverty, the Alkire-Foster (AF) multidimensional poverty method was created and developed by Sabina Alkire and James Foster at Oxford Poverty and Human Development Initiative (OPHI) in 2007. This method is a flexible technique for measuring poverty or wellbeing. It incorporates different dimensions and indicators to create measures adapted to specific contexts.
The paper uses the AF method to construct the Multidimensional Poverty Index (MPI) of South Asia. The MPI of this region is estimated by computing the Multidimensional Headcount Ratio (H) and Intensity of Multidimensional Poverty (A) (see Appendix Table 1). Multidimensional poverty reflects the percentage of the population deprived in the weighted poverty score. The AF method calculates the overlapping or simultaneous deprivation experienced by a person or a family by using different poverty indicators. Thus, the impoverished people are identified if their weighted sum of poverty index is greater than or equal to the multidimensional poverty line.
(i) The aggregate deprivation score (Ci)
${{C}_{i}}={{W}_{1}}{{I}_{1}}+{{W}_{2}}{{I}_{2}}+\cdots +{{W}_{d}}{{I}_{d}}$
where Iᵢ= 1 if the household is deprived in indicator i and Iᵢ=0 otherwise; Wᵢ is expressed as the weight of indicator i.
We use the critical value or threshold to determine the multidimensional poverty population, which is called the poverty critical point (k) in AF method. That is, if Cik, its poverty score is greater than or equal to the poverty line, and vice versa. Within the framework of MPI, if a person’s deprivation score is higher than or equal to 1/3, that person is considered poor. In other words, a person’s poverty level must be at least one-third of the (weighted) indicator considered to be MPI poverty.
(ii) Multidimensional Headcount Ratio (H):
$H=\frac{q}{n}$
where q is the number of multidimensional poor people and N is the total population.
(iii) Intensity of Multidimensional Poverty (A):
It is the average deprivation score of the multidimensional poor, which can be expressed as:
$A=\frac{\sum\nolimits_{i=1}^{n}{{{C}_{i}}(k)}}{q}$
where Ci(k) is the censored deprivation score of individual i and q is the number of people who are multidimensional poor.
(iv) Multidimensional Poverty Index (MPI):
$MPI=H\times A$
Adjusted headcount ratio (M0), otherwise known as the MPI: This measure reflects both the incidence of poverty (the percentage of the population who are poor) and the intensity of poverty (The percentage of deprivations suffered by each person or household on average). M0 is calculated by multiplying the incidence (H) by the intensity (A).
Owing to the data availability, ten indicators are selected in the paper to compute the Multidimensional Headcount Ratio and Intensity of Multidimensional Poverty. These indicators cover the areas of people’s health, education and living standards which we trust to tightly connect to people’s poverty situation (Table 3). The assessment is made by using the entropy method. Entropy is a measure of uncertainty, and the entropy value is calculated according to the characteristics of entropy to judge the degree of dispersion of an indicator. The greater the degree of indicator dispersion, the greater the impact on comprehensive evaluation. In the study, the three dimensions of people’s health, education and living standards share the same weights to compute the Multidimensional Headcount Ratio and Intensity of Multidimensional Poverty.
Table 3 Selected indicators of MPI and its interpretation
Dimensions of poverty Indicators Deprived if... Weights
Health Nutrition Any person under 70 years of age for whom their nutritional
information is undernourished
1/6
Child mortality A child under 18 has died in the household in the five-year period preceding the survey 1/6
Education Years of schooling No eligible household member has completed six years of schooling 1/6
School attendance Any school-aged child is not attending school up to the age at which he/she would complete class 1/6
Living standards Cooking fuel A household cooks using solid fuel, such as dung, agricultural crop, shrubs, wood, charcoal, or coal 1/18
Sanitation The household has unimproved or no sanitation facility or it is
improved but shared with other households
1/18
Drinking water The household’s source of drinking water is not safe or safe drinking water is a 30-minute or longer walk from home, round trip 1/18
Electricity The household has no electricity 1/18
Housing The household has inadequate housing materials in any of the three components: floor, roof, or walls 1/18
Assets The household does not own more than one of these assets: radio, TV, telephone, computer, animal cart, bicycle, motorbike, or
refrigerator, and does not own a car or truck
1/18
The statistics of these indicators refer to the Oxford Poverty and Human Development Initiative (OPHI) which is an economic research and policy center within the Oxford Department of International Development at the University of Oxford. OPHI builds and advances a more systematic methodological and economic framework for reducing multidimensional poverty, grounded in people’s experiences and values.

3 Research results

3.1 General characteristics of multidimensional poverty in South Asia

Owing to the missing and incomplete statistics of indicators of the South Asian countries, the paper divides the research period into three parts: 2003-2009, 2010-2013, and 2014-2019. In each period, the major part of the statistics is available for these ten indicators. The average value of each indicator is computed in each sub-period to further assess the multidimensional headcount ratio and intensity of multidimensional poverty. What’s more, the assessment only covers 7 countries beside Afghanistan owing to the data unavailability of these ten indicators.
Generally, South Asia experienced a decrease of MPI with the average value of MPI down from 0.198 before 2010 to 0.098 after 2010. This indicates that the poverty situation of South Asia is gaining improved in the research period. According to Figure 2, the multidimensional poverty situation of Sri Lanka and Maldives are much better than that of the other countries in South Asia during the whole research period. Nepal, Bangladesh, India and Pakistan are populous countries and poverty is a big issue facing these countries owing to their per capita GDP at low level in Asia. Tourism and related service industries brought huge revenue to Sri Lanka and Maldives, accelerated national economy and offered better livelihood to the local people comparing to other South Asian countries. Besides, a decreasing tendency of the MPI of each country is also witnessed in the research period and this is mainly attributed to the economic growth of each country.
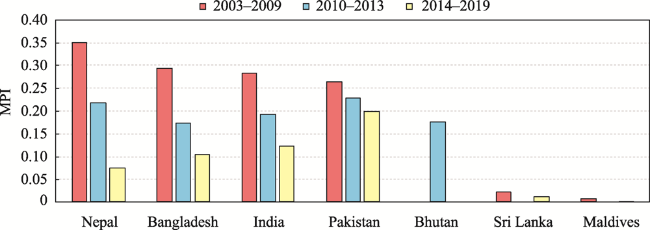
Figure 2 Multidimensional poverty in South Asia

Note: MPI of Bhutan is missing for the periods 2003-2009 and 2014-2019 while Sri Lanka and Maldives lack the MPI data for the period 2010-2013.

In the period 2003-2009, the MPI of the Maldives and Sri Lanka are 0.007 and 0.021 respectively, which are the lowest in South Asia. Nepal has the highest MPI (0.350) in this period, followed by Bangladesh (0.292), India (0.283) and Pakistan (0.264). MPI of the South Asian countries dropped in the period 2010-2013. The MPI of Bangladesh is over 0.25 which is the highest, followed Pakistan, Nepal, India and Bhutan of which the MPI are between 0.25 and 0.15. The period 2014-2019 witnesses dramatic decrease of MPI in Nepal, Bangladesh and India which are below 0.125. However, Pakistan becomes the country of highest MPI (0.2) in this research period. The MPI of Sri Lanka and Maldives are close to zero, indicating better-off livelihood in these two countries.

3.2 Health, education and living standards of South Asia

3.2.1 Nutrition and mortality

The paper further analyzes the health, education and living standards of South Asia separately. As Figure 3 shows, the nutrition of the South Asian countries if any person under 70 years of age for whom their nutritional information is undernourished experiences a decreasing tendency during the research period.
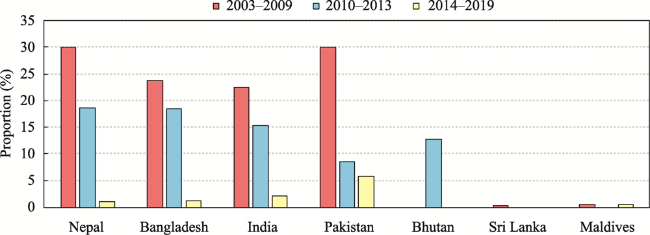
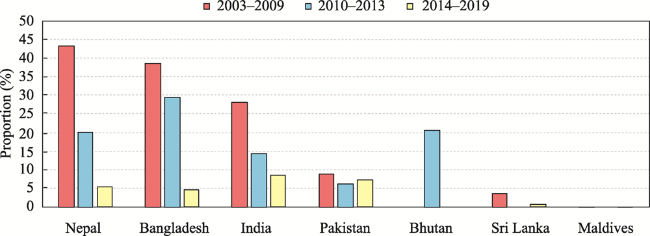
Figure 3 The proportion of nutrition deprived in South Asia (%)
In the period 2003-2009, Nepal, India and Bangladesh are the three mostly deprived countries in terms of nutrition. The proportion of nutrition deprived in these countries accounts for over 35% separately. Although the nutrition data of Pakistan is missing in this period, we estimate it staying over 30% given the statistics of this indicator in the other two sub-periods. Sri Lanka and Maldives are the countries of the lowest indicator value, having the proportion of nutrition deprived below 5%.
The period 2010-2013 witnesses evident drop of the proportion of nutrition deprived in Nepal, decreasing from 40% to 25%. However, little decrease of the nutrition indicator is seen in India and Bangladesh which have the proportion of nutrition deprived around 35%. The proportion of nutrition deprived in Pakistan stays over 30% in the research period.
The proportion of nutrition deprived in Nepal and Bangladesh further drop to below 10% in the period 2014-2019 while India has this indicator drop to over 20%. Pakistan is the country of the highest proportion of nutrition deprived in this sub-period and the indicator stays over 25%. Sri Lanka and Maldives have the proportion of nutrition deprived below 3%.
Overall, the nutrition situation of the poor people in South Asia is turning good in the research period. However, Pakistan and India are the countries of the highest proportion of nutrition deprived and over a quarter population still faces malnutritional problems. The other South Asian countries are gaining progress in helping people out of the malnutritional problems during the research period.
Child mortality is also one of the most important elements regarding to the people’s health. Comparing to the nutrition deprived, the child mortality in South Asia is much better during the research period. Both Sri Lanka and Maldives have the child mortality close to zero, indicating a best situation of child mortality (Figure 4).
Figure 4 The proportion of child mortality deprived in South Asia (%)
In the period 2003-2009, both Pakistan and Nepal have 30% mortality rate of the child under 18 who has died in the household in the five-year period preceding the survey. The child mortality in Bangladesh and India are between 20%-25%. Evident decrease of child mortality in Pakistan is seen in the period 2010-2013, dropping to below 10%. Bhutan has the child mortality staying around 13% while the child mortality in India, Bangladesh and Nepal are between 15%-20%. The period 2014-2019 witnesses dramatic decrease of child mortality in Nepal, Bangladesh and India with the indicator staying below 3%. The child mortality further decreases in Pakistan and stays a little bit over 5% in the research period.

3.2.2 Education

Generally speaking, children are the most vulnerable group of human society and normally bear the greatest burden of poverty. At present, half of the world’s multidimensional poor are children under the age of 18 and one third are children under the age of 10 (Dirksen, 2021). Further, children who are deprived from education may move into a vicious cycle in the long run through less competition to access jobs and low livelihood level.
The paper analyzes the deprivation of people in years of schooling and school attendance in South Asia. As Figure 5 shows, Nepal, Bangladesh and India experienced a decreasing tendency of the proportion of years of schooling deprived during the research period, however, there is a growth tendency of this indicator in Pakistan. Bhutan has the highest proportion of years of schooling deprived in the period 2010-2013 with the indicator staying at 30%, followed by Pakistan and Nepal with the indicators at over 25% and 20% respectively.
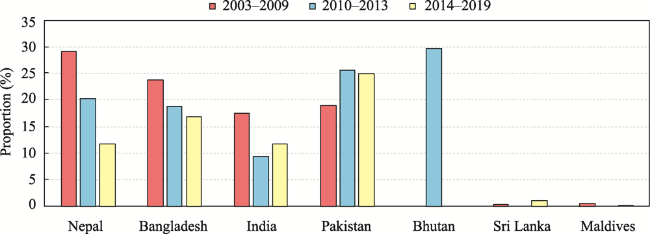
Figure 5 The proportion of years of schooling deprived in South Asia (%)
Moving to the period 2014-2019, the proportion of years of schooling deprived in Pakistan is the highest (25%), followed by Bangladesh (over 15%), India and Nepal of which the indicator is over 10%. Both Sri Lanka and Maldives have the proportion of years of schooling deprived around zero in the research period, showing good education situation of children in these countries.
According to Figure 6, the research period witnesses a decreasing trend of the proportion of the school attendance deprived in South Asia. However, Pakistan is the country with the worst situation as the rate of children not attending school staying around 25% after a decrease of this indicator from 30% in the period 2003-2009. India, Bangladesh and Nepal all have the rates of children not attending school at around 5% in the period 2014-2019. Both Sri Lanka and Maldives have the proportion of children not attending school staying around zero during the whole research period.
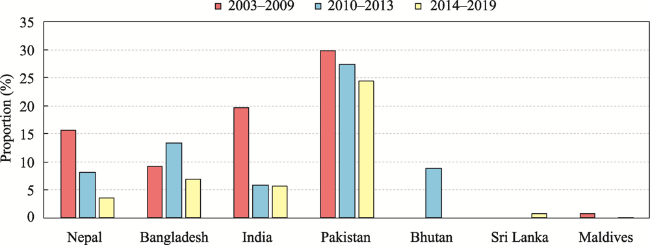
Figure 6 The proportion of school attendance deprived in South Asia (%)

3.2.3 Living standards

The quality of living standards has always been a concern in terms of poverty. Energy supply highly supports the maintenance of human daily lives like cooling, heating and cooling and these include lighting, cooking, telecommunications and other household appliances (Abbas et al., 2021). The paper chooses the cooking fuel, electricity and housing to further depict the dimension of living standards in South Asia (Figures 7-9). A downturn trend of these three indicators is seen in South Asia during the research period.
According to Figure 7, the proportion of the cooking fuel deprived stays over 40% in Pakistan, India, Bangladesh and Nepal in the period 2003-2009. In the period 2010-2013, 50% of the people in Bangladesh are deprived from cooking fuel, followed by Nepal, India, Pakistan and Bhutan. Evident decrease of this indicator is seen in Nepal, Bangladesh and India in the period 2014-2019, however Pakistan has the proportion of cooking fuel deprived staying at 30%. The situation of people’s access to cooking fuel in Sri Lanka and Maldives are the best in South Asia with the proportion of cooking fuel deprived close to zero.
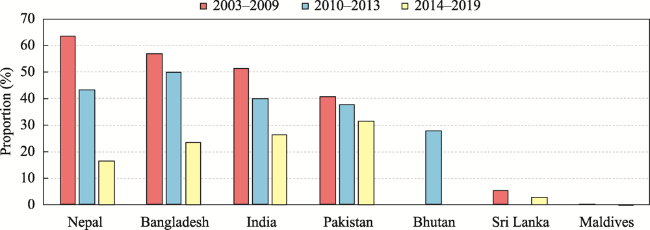
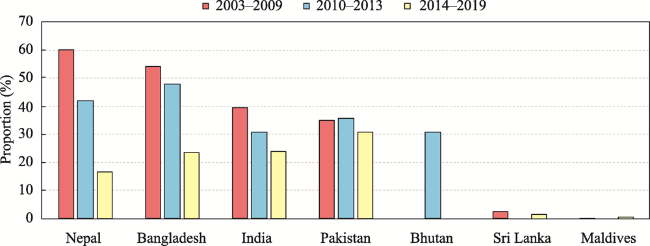
Figure 7 The proportion of cooking fuel deprived in South Asia (%)
As Figure 8 shows, the decreasing tendency of the proportion of electricity deprived is seen in South Asia in the research period. Nepal has the highest proportion of electricity deprived in the period 2003-2009 with the indicator close to 45%. Bangladesh and India are the countries of the second highest rates of electricity deprived with the indicator staying at 38% and 28% respectively. The periods 2010-2013 and 2014-2019 witnessed evident and continuous decrease of the indicator in Nepal, Bangladesh and India. Pakistan has the proportion of electricity deprived below 10% during the whole research period. People in Sri Lanka and Maldives have the best conditions to access electricity in South Asia with the proportion of electricity deprived close to zero.
Figure 8 The proportion of electricity deprived in South Asia (%)
According to Figure 9, all countries in South Asia show a downward trend in terms of the proportion of households which have inadequate housing materials in terms of floor, roof or walls. The housing situation in Sri Lanka and Maldives are the best in South Asia with the proportion of electricity deprived close to zero.
Figure 9 The proportion of housing deprived in South Asia (%)
The period 2003-2009 sees Nepal, Bangladesh and India top countries with the highest proportion of housing deprived stay at 60%, 54% and 40% respectively. The indicator of Pakistan is around 35%. Moving to the period 2010-2013, Bangladesh has the highest rate of housing deprived (48%), followed by Nepal (41%), Pakistan (35%), India (31%) and Bhutan (31%). The period 2014-2019 witnesses evident decrease of the proportion of housing deprived in Nepal, Bangladesh and India with the indicator staying at 17%, 22% and 23% respectively. There exists little decrease of the indicator in Pakistan with the indicator value staying at 30% in the period 2014-2019.

3.3 Restrictive factors to poverty in South Asia

The paper constructs radar maps of the ten MPI indicators in the three research periods to show the restrictive factors to poverty in South Asia. Restrictive factors to poverty are those indicators which are higher value which indicates the worse poverty situation.
According to Figure 10, cooking fuel, sanitation and housing are the main constituting indicators to MPI of South Asia in the period 2003-2009. This means that these three indicators are the main restrictive factors to poverty in South Asia. Similar research findings are seen in the period 2010-2013. This indicates that the living standards of people is the core issue regarding to sustainable poverty reduction in South Asia comparing to the health and education.
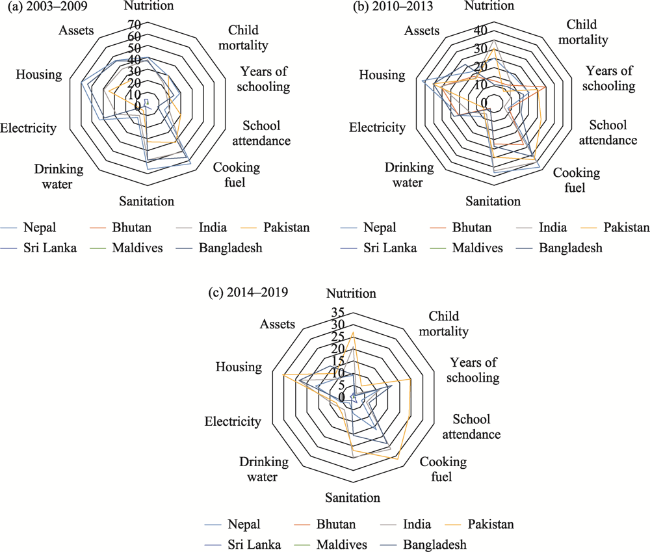
Figure 10 Radar map of MPI indicators in South Asia, 2003-2019
Further, cooking fuel, sanitation, housing and nutrition as well as years of schooling are the main constitutions of MPI in South Asia in the period 2014-2019. This means that these indicators are the restrictive factors to poverty in South Asia. Besides living standards, people’s nutrition and education have become the main influencing factors to approach sustainable poverty reduction in South Asia.

4 Discussion and conclusion

The world has set an ambitious target to eradicate extreme poverty globally by 2030 with the goals to lower the incidence of extreme poverty below 3% and to promote shared prosperity (Jolliffe et al., 2014). In the meantime, the World Bank (2018) also indicates that it is needed for all countries’ poverty reduction rate growing at an average pace of 8% to accomplish the world’s poverty reduction target by 2030. However, this is not feasible in South Asia where poverty is not only all-encompassing, but also unevenly distributed across regions and socio-economic groups. Our study shows that poverty in South Asia has eased in recent decade however the situation of multidimensional poverty is still severe as poor people in this region are facing several forms of deprivation and are most likely to pass it on to the future generations owing to the poor national economy, insufficient supply of public services and other unpredictable risks.
At present, cooking fuel, sanitation, housing and nutrition as well as years of schooling are the main restrictive factors to poverty reduction in South Asia. Poor people in Pakistan, India and Bangladesh are particularly facing the worst situation in terms of health, education and living standards. This shows diverse needs of the impoverished groups. As for achieving sustainable poverty reduction, it is necessary to establish targeted poverty alleviation to identify the real poor and figure out what they need in South Asia. Targeted poverty alleviation has been successfully implemented in China since 2015 to ensure that accurate assistance reaches impoverished people (Li et al., 2016). This helps the governments and other international agencies and organizations to effectively implement poverty alleviation measures to ensure that assistance reaches poverty-stricken villages and households to meet their needs.
Today, the ongoing COVID-19 pandemic is reversing hard-won gains against poverty and creating an unprecedented crisis to the global poverty reduction affairs. South Asia will be the region hardest hit, with 49 million additional people pushed into extreme poverty in the short-term (World Bank, 2020). The sharp decline in international demand of manufactured goods, particularly from the export-oriented sectors, is expected to affect employments creation in South Asia. Large labor income losses are expected for households engaged in labor-intensive sectors and informal services. A domestic outbreak of the pandemic and the consequent burden of healthcare and related disruptions in public services will further exacerbate the negative impacts of COVID-19 pandemic on poor households to get access to medical services and education.
South Asia is undoubtedly a key area of poverty in the world and there needs special attention paid to the region in terms of poverty reduction. Considering the current pandemic and various challenges facing South Asia, improving the resilient capacity for sustainable poverty reduction both at individual, national and regional levels against shocks and risks is an essential part to accomplish the poverty reduction goal by 2030. According to Li et al. (2021), resilient poverty reduction at individual level implies that people are capable of staying in a state of resilience against external shocks to avoid returning to poverty. Resilient poverty reduction at national or regional levels means that a country or a region have the ability to offer conditions to the poor people to develop and approach better-off livelihoods. In South Asia, nutrition and education (including professional training) of the poor people need to be strengthened to enable individuals to find better-paid jobs to further improve their livelihood and stay stable out of poverty. The construction of infrastructures and development of local economy play an important role in building national and regional resilience which is the prerequisite for individuals to maintain better-off livelihoods. Besides, resilient poverty reduction also requests cooperation among countries and the full involvement of economic bodies, NGOs and political bureaus to fulfill their obligations and responsibilities to achieve the 2030 poverty reduction goal.
Finally, we want to emphasize that poverty reduction is an issue which demands both external assistance and internal motivation and action. Various resources input and assistance such as infrastructure construction and investment only serve as an external force to poverty reduction. However, it is the poor people’s resolution and desire for better livelihood that play dominant role in shaking off poverty (Wood, 2008). Thus, the poor groups need to be self-motivated and diligent with their willingness to learn and work hard to change their lives.

Appendix

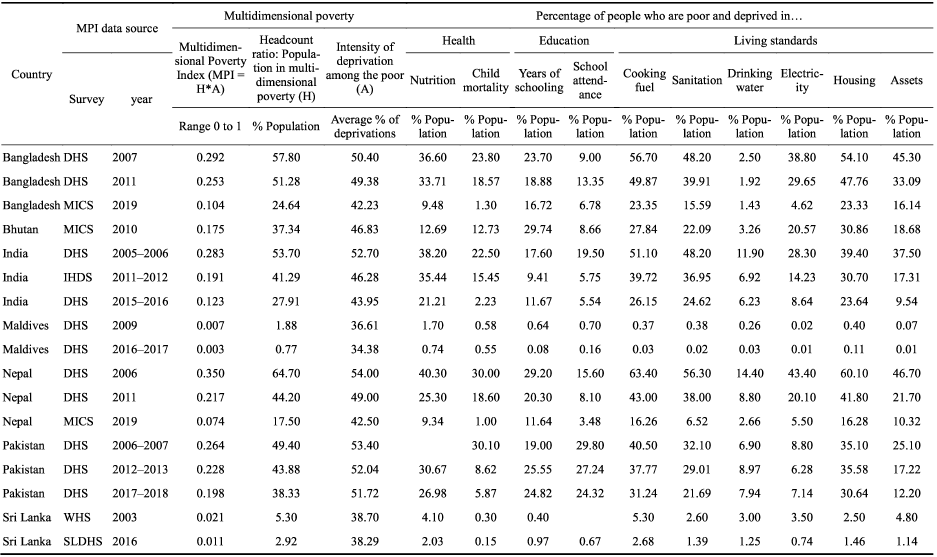
Table 1 The South Asia Multidimensional Poverty Index (MPI)
[1]
Abbas K, Xu D, Li S, 2021. Health implications of household multidimensional energy poverty for women: A structural equation modeling technique. Energy and Buildings, 234: 110661.

DOI

[2]
Alkire S, Dirksen J, Nogales R et al., 2020. Multidimensional poverty and COVID-19 risk factors: A rapid overview of interlinked deprivations across 5.7 billion people. Oxford Poverty and Human Development Initiative (OPHI) Working Paper 53. Oxford: University of Oxford.

[3]
Alkire S, Foster J, 2011. Understandings and misunderstandings of multidimensional poverty measurement. The Journal of Economic Inequality, 9(2): 289-314.

DOI

[4]
Alkire S, Ul Haq R, Alim A, 2019. The state of multidimensional child poverty in South Asia: A contextual and gendered view. Oxford Poverty and Human Development Initiative (OPHI) Working Paper 127. Oxford: University of Oxford.

[5]
Bader C, Bieri S Wiesmann U et al., 2016. Differences between monetary and multidimensional poverty in the Lao PDR: Implications for targeting of poverty reduction policies and interventions. Poverty & Public Policy, 8(2): 171-197.

[6]
Bourguignon F, Chakravarty S R, 2019. The measurement of multidimensional poverty. In: Chakravarty S (eds.). Poverty, Social Exclusion and Stochastic Dominance:Themes in Economics. Singapore: Springer.

[7]
Bourguignon F, Fields G, Foster J, 2012. Economic mobility and the rise of the Latin American middle class. Washington DC:LAC Regional Flagship 2012.

[8]
Bruno M, Ravallion M, Squire L, 2016. Equity and Growth in Developing Countries:Old and New Perspectives on the Policy Issues. Rochester: Social Science Electronic Publishing.

[9]
Cavatassi R, Davis B, Lipper L, 2004. Estimating poverty over time and space: Construction of a time-variant poverty index for Costa Rica. Rome: Food and Agriculture Organization.

[10]
Cohen A, 2010. The multidimensional poverty assessment tool: A new framework for measuring rural poverty. Development in Practice, 20 (7): 887-897.

DOI

[11]
Dirksen J, Alkire S, 2021. Children and multidimensional poverty: Four measurement strategies. Sustainability, 13(16): 9108.

DOI

[12]
Dollar D, Kraay A, 2002. Growth is good for the poor. Journal of Economic Growth, 7(3): 195-225.

DOI

[13]
FAO, 2018. Monitoring food security in countries with conflict situations:A joint FAO/WFP update for the United Nations Security Council. New York: Food and Agriculture Organization of the United Nations, World Food Programme.

[14]
Fosu A K, 2017. Growth, inequality, and poverty reduction in developing countries: Recent global evidence. Research in Economics, 71(2): 306-336.

DOI

[15]
Fosu A K, 2018. The recent growth resurgence in Africa and poverty reduction: The context and evidence. Journal of African Economies, 27(1): 92-107.

DOI

[16]
Jolliffe D, 2001. Measuring absolute and relative poverty: The sensitivity of estimated household consumption to survey design. Journal of Economic and Social Measurement, 27: 1-23.

DOI

[17]
Lakner C, Mahler D G, Negre M et al., 2020. How Much Does Reducing Inequality Matter for Global Poverty? Global Poverty Monitoring Technical Note 13 (June). Washington, DC: World Bank.

[18]
Li Y, Su B, Liu Y, 2016. Realizing targeted poverty alleviation in China: People’s voices, implementation challenges and policy implications. China Agricultural Economic Review, 8(3): 443-454.

DOI

[19]
Li Y, Wu W, Wang Y, 2021. Global poverty dynamics and resilience building for sustainable poverty reduction. Journal of Geographical Sciences, 31(8): 1159-1170.

DOI

[20]
Liu Y, Xu Y, 2016. A geographic identification of multidimensional poverty in rural China under the framework of sustainable livelihoods analysis. Applied Geography, 73: 62-76.

DOI

[21]
Ravallion M, 2015. The Economics of Poverty:History, Measurement, and Policy. New York: Oxford University Press.

[22]
Wood R E, 2008. Survival of Rural America:Small Victories and Bitter Harvests. Kansas: University Press of Kansas.

[23]
World Bank,2018. Poverty and Shared Prosperity 2018 Piecing Together Poverty Puzzle. Washington DC: World Bank Group.

[24]
World Bank, 2020. Poverty and Shared Prosperity 2020 Reversals of Fortune. Washington DC: World Bank Group.

Outlines

/